Programmable Alerts Configuration
Alert Evaluation Script
vuSmartMaps lets you use Python scripts to create programmable alerts. Using an evaluation script, you can generate alerts for breaching any business logic. Below is a typical alert engine execution workflow and where the evaluation script is used.
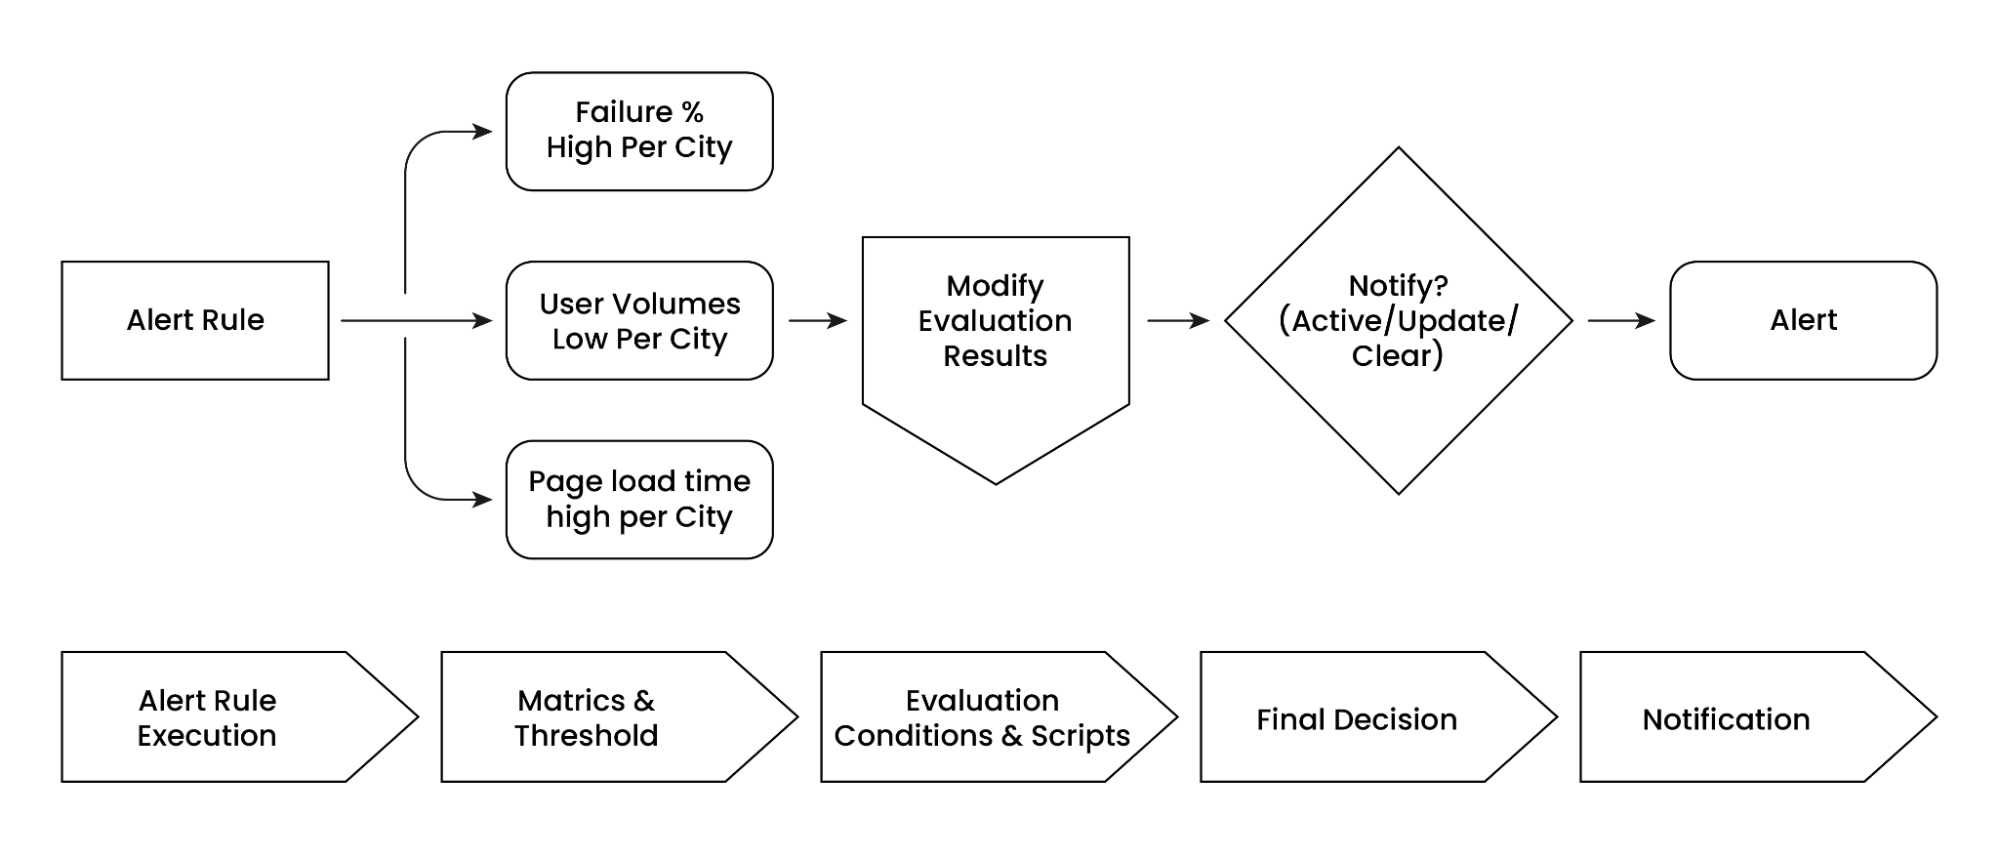
The evolution script runs after metrics are checked and thresholds are applied, allowing you to customize alert behavior. Apart from implementing business logic to generate the alert, you can also tweak alert notification content and channel settings like who gets notified.
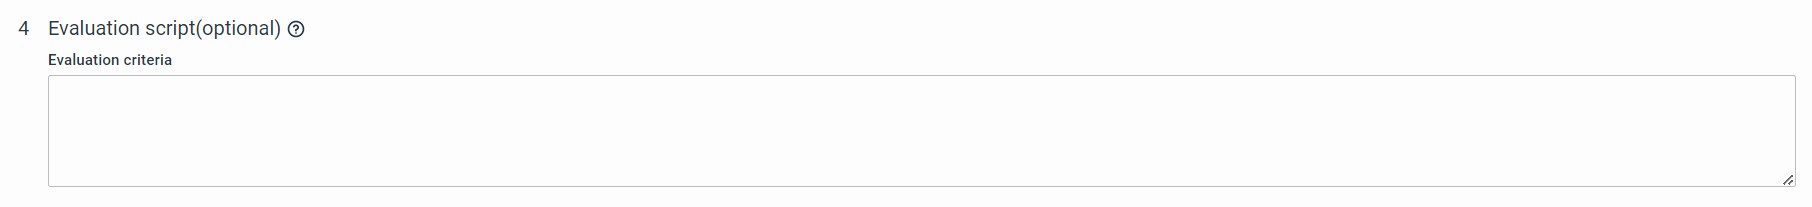
In simple terms, the Python script lets you create detailed and specific alert conditions that fit your needs. You can write this script in the "Evaluation Script" section.
In the evaluation script, you can do the following:
- Set Custom Conditions: You can implement complex conditions using programming logic to determine if the alert should be generated. For instance, you can have different thresholds for "Development" systems or dynamically adjust the threshold based on server type, location, and deviation.
- Control Notifications: Decide which notification channels to use and who should receive notifications. For example, you can send an email to an escalation team if the alarm condition persists for more than 4 hours.
- Customize Notification content: Modify notification content and add extra information. You can include dynamic action recommendations based on metrics and their values.
These options give you a lot of flexibility in how you set up your alerts. We'll explore these features in more detail in the following section.
The programming interface is supported exclusively using Python Language.
Input Parameters for the Script
vuSmartMaps makes the various parameters like a list of metrics, grouping values, and meta data in the evaluation script for you to use in your programming logic. The following table lists the input parameters available to the evaluation script
| Parameter | Type | Description | How to Access |
|---|---|---|---|
| R<n> | Boolean | True or False indicating whether Rule-n thresholds matched or not | The result of Rule-1 is available as variable R1, Rule-2 as R2, etc |
| D | List | The Data Model results list | D[0] contains Data Model values for Rule-1, D[1] for Rule-2 etc. Please note the array like indexing. |
| grouping_values | List | Grouping values associated with the notification. This corresponds to buckets configured in Data Model. | grouping_value[0] for first bucketing value, grouping_value[1] for second etc. Note: If the rule does not have any bucketing configured, grouping_values[0] will beocme the name of the metric |
| META_DATA | Dictionary | Metadata associated with this alarm | |
| META_DATA[‘duration’] | Seconds | Duration for which this alarm has been active | META_DATA.get(‘duration, 0) |
| META_DATA[‘history’] | Dictionary | History of this alarm | Please see the example in the upcoming sections |
Output Parameters available for the script
The following table lists the output parameters available to the evaluation script for controlling the behavior of the alarm.
| Parameter | Type | Description | How to Access |
|---|---|---|---|
| RESULT | Boolean | Setting this value to True results mean alert should be generated. while setting this to False will not generate the alerts. state. | Eg: RESULT = True or RESULT = False |
| R<n> | Boolean | True or False indicating whether Rule-n thresholds matched or not | The result of Rule-1 is available as variable R1, Rule-2 as R2, etc |
| D | List | The Data Model results list | D[0] contains Data Model values for Rule-1, D[1] for Rule-2 etc |
| META_DATA | Dictionary | Metadata associated with this alarm | |
| META_DATA[‘force_update’] | Boolean | True or False indicating whether to send an update notification for this alert or not You can find an example here. |
Changing Evaluation Formula
By default, vuSmartMaps generates an alert only when all conditions in an alert rule are true. So if there are two rules R1 and R2, an alert will be generated if both R1 and R2 are True.
In the evaluation script, each rule’s result is represented by variables like R1, R2, etc., where True is represented as R1 = True. You can use logical operators in the evaluation script. So the above two rules evaluation can be represented in the evaluation script as:
if R1 and R2:

    return True;
You can use "and" and "or" logic to create complex conditions, like R1 and (R2 or R3) and not R4. So for instance, the evaluation script will look like the following if either R1 or R2 condition is to be met:
if R1 or R2:

    return True;
This gives you control over when alerts are generated based on your specific criteria and combinations of conditions.
Accessing Metric Values
In the evaluation script, you can access the current values of the metrics used in your alert conditions. Each metric can be accessed through a multi-level Python data structure. To simplify this process, an accessor function is available to help the evaluation script retrieve the values of specific metric columns from the data model used in your alert rule. This allows you to make informed decisions in your script about whether or not to trigger an alert.
| D | Rule result dictionary |
| rule_identifier | Identifier of the rule (1, 2, etc) |
| metric_column | Metric column |
Example: get_DM_value(D, 1, ‘success_rate’)
# Get the value of success rate which is the metric in Rule 1
current_success = get_DM_value(D, 1, ‘success_rate’)
daily_avg = get_DM_value(D, 1, ‘daily_average’)

RESULT = True

if current_success is not None and daily_avg is not None:
    Ratio = current_success/daily_avg

    If ratio < .75:
        RESULT = False
The metric values can be used to decide on whether to generate an alert or not.
If we want to generate a warning alert if the value is between 80 and 90 and a critical alert if the value is > 90 and should be sent to a few extra folks. So a data model will be created with a threshold of 80. Then we will write Python code to do this check and update META_DATA also to include more people in critical cases.
bw = get_DM_value(D, 1, ‘input_bandwidth’)

If bw and bw >= 80 and bw < 90:
    RESULT = True
    severity = warning
elif bw and bw >= 90:
    RESULT = True
    severity = critical
else:
    RESULT = False
Controlling Alert Generation
Suppose you want to generate an alert only when the transaction success rate is 25% lower than the daily average. You can achieve this by creating a custom evaluation script.
For example, if you have a Data Model named "Success Rates" with metrics "Current Rate" and "Daily Average," the following script can be used:
current_success = get_DM_value(D, 1, ‘Current Rate’)
daily_avg = get_DM_value(D, ‘1’, ‘Daily Average’)

RESULT = True

if current_success is not None and daily_avg is not None:
    if daily_av:
         # avoid division by zero
        ratio = current_success/daily_avg
    else:
        ratio = 0

    If ratio < .75:
        RESULT = False
In the script provided earlier, the variable RESULT plays a crucial role in determining whether an alert should be generated. If you set RESULT to True, an alert will be triggered for the specific situation. If RESULT is set to False, no alert will be generated. If the script doesn't modify the value of RESULT, no alert will be generated by default.
In summary, RESULT serves as the output variable that allows the evaluation script to control when alert notifications are generated based on the conditions and logic you define.
Accessing Grouping Values
You can also access grouping values for a specific alert being evaluated in your scripts. This is useful if your notifications involve multiple grouping levels. For instance, if you're grouping alerts by hostname and interface name, you can access these values within your script as demonstrated in the example provided.
if grouping_values[0] === ‘AppServer’ and
   grouping_values[1] === ‘serial-1-1’
    RESULT = False
else:
    RESULT = True
In the example above, we use grouping values to avoid generating alerts for the serial interface on the host "AppServer." The script accesses grouping values through the grouping_values list, which contains the values for each level of grouping. You can access these values using the Python syntax, such as grouping_values[0] and grouping_values[1]. This allows you to customize alert generation based on specific grouping criteria.
Adding New Fields
You can add new fields to the notifications generated by the system using the evaluation script.
For instance, if you need to include a new field category with values based on the transaction success rate metric, you can achieve this with the following script snippet.
In here, if success rate of the transaction is above 90% we will add it to the ‘Normal’ Category else the category will be ‘Need Investigation’
success_rate = get_DM_value(D, 1, 'Success Rate')
if success_rate and success_rate > 90:
    DYNAMIC_FIELDS[‘category’] = ‘Normal’
else:
    DYNAMIC_FIELDS[‘category’] = ‘Need Investigation’

RESULT = True
As can be seen, any field to be added to the notification generated can be specified in the DYNAMIC_FIELDS dictionary with the corresponding key and value.
Controlling Notification Channels and Recipients
You can control the notification channels and recipients in the evaluation script using the ALERT_CHANNELS list. You can add or remove items from this list to include or exclude specific channels for a particular alert. Here are the keywords for different channels:
- alertByEmail
- alertByReport
- alertByRunBook
- alertByWhatsapp
- alertByTicket
For example, the following code snippet can be used to add Email as one of the channels and remove the Ticketing system as a channel based on conditions. Data model gets the success rate of the online transactions done in the bank by various methods like UPI, NEFT, RTGS, Credit cards, Debit cards etc
success_rate = get_DM_value(D, 1, 'Success Rate')

if success_rate and success_rate > 90:
    ALERT_CHANNELS.append(‘alertByEmail’)
    EMAIL_ID_LIST = ['ops@rban.com','tom@rban.com']
elif success_rate < 80:
    ALERT_CHANNELS.append(‘alertByTicket’)

RESULT = True
Within each channel, a similar facility is available to control the recipients. In the above, two email addresses are configured as recipients.
The list of controls available for different channels is shown below
| Field | Channel | Description |
|---|---|---|
| EMAIL_ID_LIST | List of email addresses. Eg: ops@rban.com | |
| EMAIL_GROUP_LIST | List email group names. Eg: Support | |
| REPORT_LIST | Report | List of Reports. Eg: the “CXO Report” |
| PHONE_NUMBER_LIST | List of phone numbers. Eg: 9881 234 567 | |
| RUNBOOK_SCRIPT | Runbook | Runbook script name. Eg: service_restart |
Controlling Severity
The severity of the alert can be modified using an evaluation script. For example, the severity of the alert is increased to Critical for a certain range of values.
RESULT = False
Success_rate = get_DM_value(D, 1, "Success Rate")
if success_rate and success_rate > 90:
    DYNAMIC_FIELDS['severity'] = 'information'
    RESULT = True
Modifying Summary and Description
Similar to severity, summary and description fields can be modified using an evaluation script.
success_rate = get_DM_value(D, 1, 'Success Rate')

if success_rate and success_rate > 90:
    DYNAMIC_FIELDS[‘summary’] = ‘Resource Usage High for %g’
    DYNAMIC_FIELDS[‘description’] = “Investigation of this server …..”

RESULT = True
As can be seen in the above example, the summary and description created by the script can make use of the format specifiers supported by the system. Please refer to Step 1 of alert creation in this manual for more details on this.
Accessing Duration
The duration for which the current alarm condition has been active is available in the META_DATA dictionary. This can be used for escalating alerts based on the active duration.
In the below example, the script implements an escalation of the alarm condition by sending out a notification to a larger group, if the alarm condition has continued for more than 6 hours. We are keeping it in minutes.
if META_DATA[‘duration’] > 6 *60:
    ALERT_CHANNELS.append(‘alertByEmail’)
    EMAIL_ID_LIST = ['ops@rban.com','tom@rban.com']

RESULT = True
Accessing the History of Alarm
An evaluation script can make use of the history of this alarm condition to decide on the alert behavior. The below example does escalation notification if the condition has been activated more than X number of times in the last 1 week.
if len(META_DATA[‘history’][‘list’]) > 10:
    ALERT_CHANNELS.append(‘alertByEmail’)
    EMAIL_ID_LIST = ['ops@rban.com','tom@rban.com']

RESULT = True
Using Enrichments in alerts
We can use the enrichments available in vuSmartMaps to enrich the alert document or to use those enrichments in evaluation scripts for any other purpose.
We have a lookup function available for this named get_value_from_lookup_file. It takes the following arguments -
-
tenant_id- Tenant Id -
bu_id- Bu Id -
lookup_file_name- Name of the lookup file -
key- Key to be used to do the lookup. This can also be a list of keys in case of a multi-level lookupThe given "key" can either be a single key or a list of keys
- In case of multi-level lookups
- For ex: key = ["circle1", "region2", "code"] in a lookup
- circle1:region1:
code: '255'
region2:
code: '254'- will give '254' as output`
RESULT = False
if R1:
    add_fields = D[0]['Alert for WAN Link Down - BGP State Change SNMP  North'']['metrics']['BGP Peer State']['includes']
    M1 = get_DM_value(D, 2, "LinkUsage")
    M2 = get_DM_value(D, 2, "bgp_peer_remote_address")
    M3 = get_DM_value(D, 2, "Circle")
    M4 = get_DM_value(D, 2, "BranchName")
    M5 = get_DM_value(D, 2, "BranchCode")
    M6 = get_DM_value(D, 2, "DeviceIP")
    M7 = get_DM_value(D, 2, "ISP")

    AssignmentGroup = get_value_from_lookup_file("1", "1", "Assignment-Grp.yml", [M3, M7, "AssignmentGroup"])

   DYNAMIC_FIELDS["Assignment_Group"] = AssignmentGroup
   DYNAMIC_FIELDS["Assigned_Organization"] = get_value_from_lookup_file("1", "1", "AssignedOrg.yml", [AssignmentGroup, "Organization"])
   DYNAMIC_FIELDS["code"] = get_value_from_lookup_file("1", "1", "code.yml", "Nexus")
Using Time of Alert
In certain cases, the decision on alert may have to be made based on the time at which the alert is being generated.
The time of alert is available in the OBSERVATION_TIME variable.
For example, if different thresholds are to be used for business hours and non-business hours, the following logic can be used.
success_rate = get_DM_value(D, 1, 'success_rate')
# Time in the local time zone at which this alert is being generated
# OBSERVATION_TIME is a Python datetime object and all
# operations/functions supported in datetime object can be used on this

# we will get the hour of the day
hour = int(OBSERVATION_TIME.strftime("%I"))

# and check if the hour of the day falls in business hours and adjust the threshold accordingly
threshold = 80 if hour >= 9 and hour <= 17 else 60

RESULT = True if success_rate and success_rate > threshold else False
If different thresholds are to be used for weekdays and weekends, the following logic can be used
# If different thresholds are to be used for weekdays and weekends, the following logic can be used
success_rate = get_DM_value(D, 1, 'Success Rate')

# Time in the local time zone at which this alert is being generated
# OBSERVATION_TIME is a Python datetime object and all
# operations/functions supported in datetime object can be used on this
# fetch the day of the week

day = OBSERVATION_TIME.strftime("%A")

# and check if the day of the week falls on a weekend, and adjust the threshold accordingly
threshold = 50 if day in {'Sunday', 'Saturday'} else 70

RESULT = True if success_rate and success_rate > threshold else False
Internally, OBSERVATION_TIME is the last alert execution time in the local timezone
Evaluation script to map columns in Alert Console
1. Evaluation script to map Alert console listing columns (Region, Status, Device IP, Affected Category, Business Impact, and Source)
Below is a map of the columns/fields in the Alert Console list view table. The keys are the Column names in the UI table and the values are a list of fields using any of which we can populate the corresponding column in the UI. This has to be done using DYNAMIC_FIELDS in the evaluation script.
Backend mapping logic
      "Region": ["location", "Location"],
      "Assignee": ["assignee"],
      "Status": ["status"],
      "Device IP": ["DeviceIP", "target", "host"],
      "Affected Category": ["category"],
      "Business Impact": ["impact"],
      "Source": ["source"],
As you can see, above is the mapping kept in backend where the Key is the actual name of column used in Alert console columns and the value(s) are the fields you can use in Evaluation script (Dynamic fields) for mapping the actual values. For example, to populate `Device IP` column in the Alert Console table, one can add any of the following in the evaluation script:
Dynamic Fields in Evaluation Script
DYNAMIC_FIELDS[‘DeviceIP’] = '1.0.0.0’   OR
DYNAMIC_FIELDS[‘target’] = '1.0.0.0’   OR
DYNAMIC_FIELDS[‘host’] = '1.0.0.0’
Now suppose you want to give dynamic values to the key instead of a static value, then you can use the following method in evaluation script.
First get the values in a list and then assign this list to the dynamic field. For example, here we are trying to get the IP addresses in the data model column name: IP into a list device_ip. Then this list device_ip is mapped to the dynamic field ‘target’.
device_ip = get_vumetric_value(D, 1,‘IP’) - here IP is the Data model column name which has IP addresses
DYNAMIC_FIELDS[‘target’] = device_ip
2. Evaluation script to map Alert console -> Alert Summary Page -> Alert Trendgraph dropdown
Currently, only ‘Region’ wise Alert trend is supported. This can be configured in the same way as above.
DYNAMIC_FIELDS[‘location’] = ‘Bengaluru’

OR, if there

city = get_vumetric_value(D,2,’Region’)
DYNAMIC_FIELDS[‘location’] = city
Evaluation Script to Configure Related Dashboard
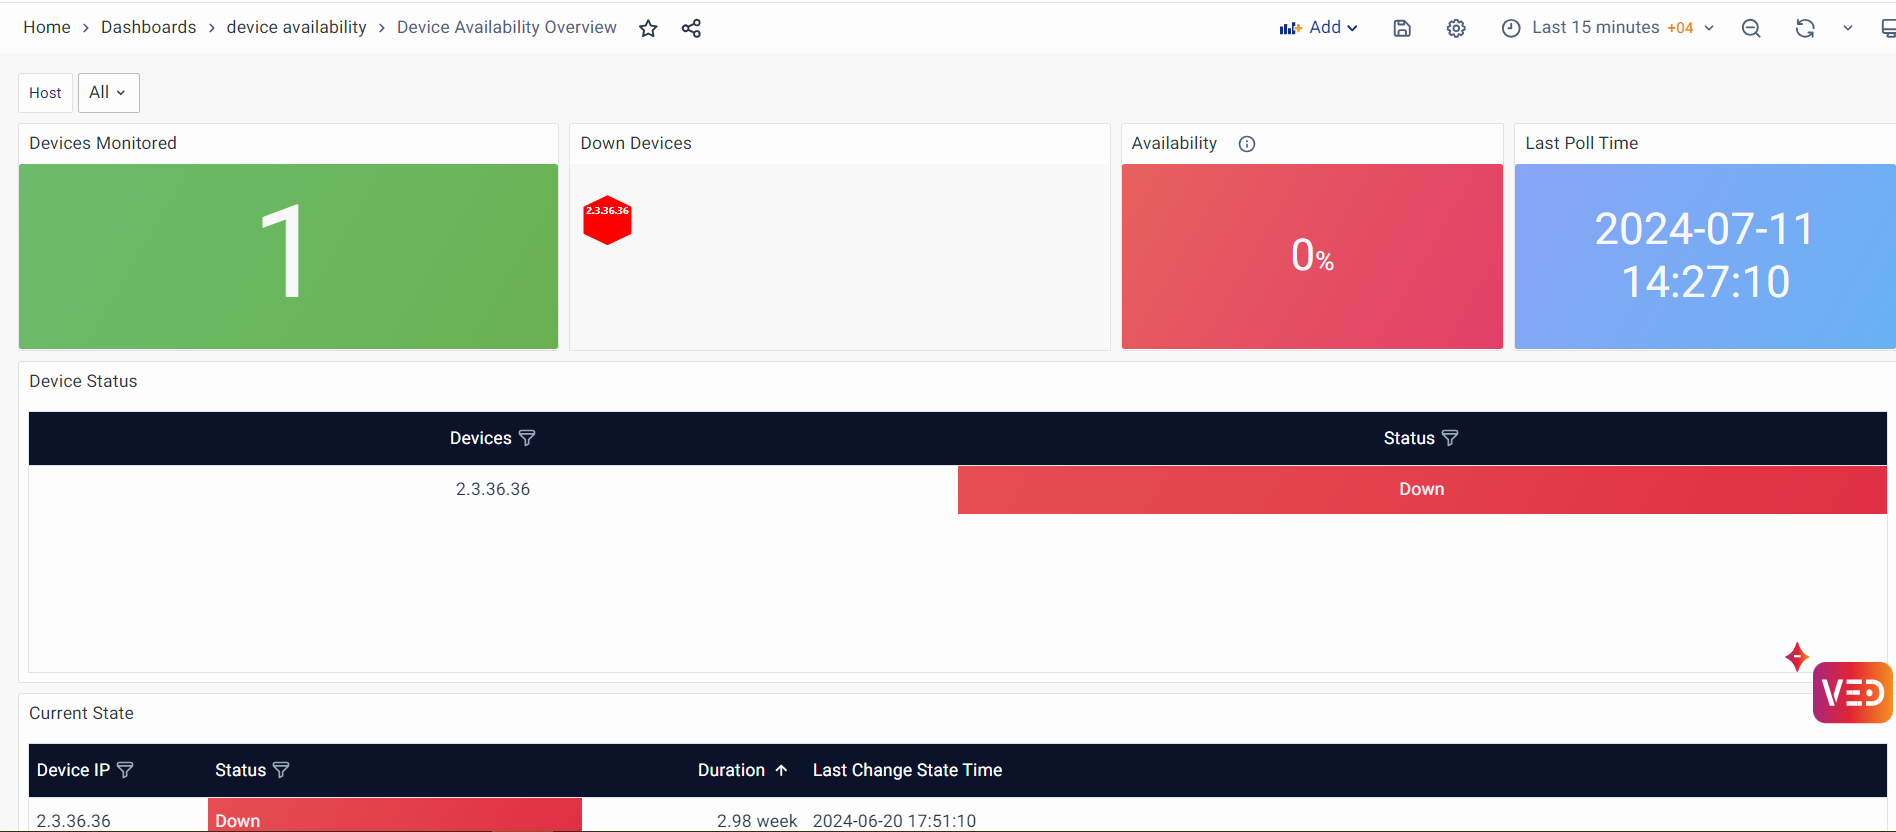
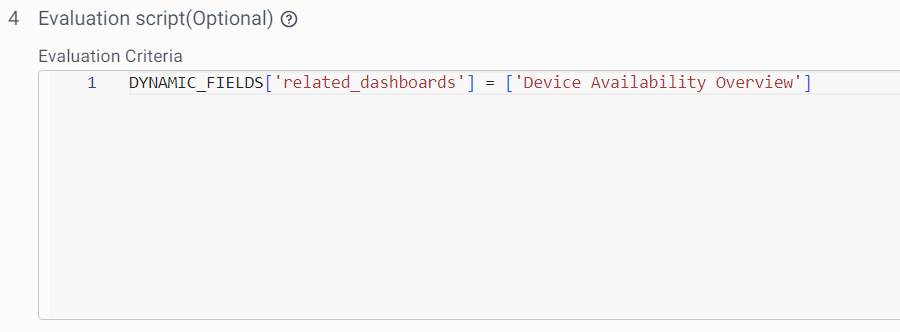
To configure Related dashboards of an alert, use the YAML configuration as shown below. “Device Availability Overview” is the name of the dashboard which is preconfigured and called here.
The output of this configuration is seen in the ‘detailed view’ of the Alerts on the Alert Console.
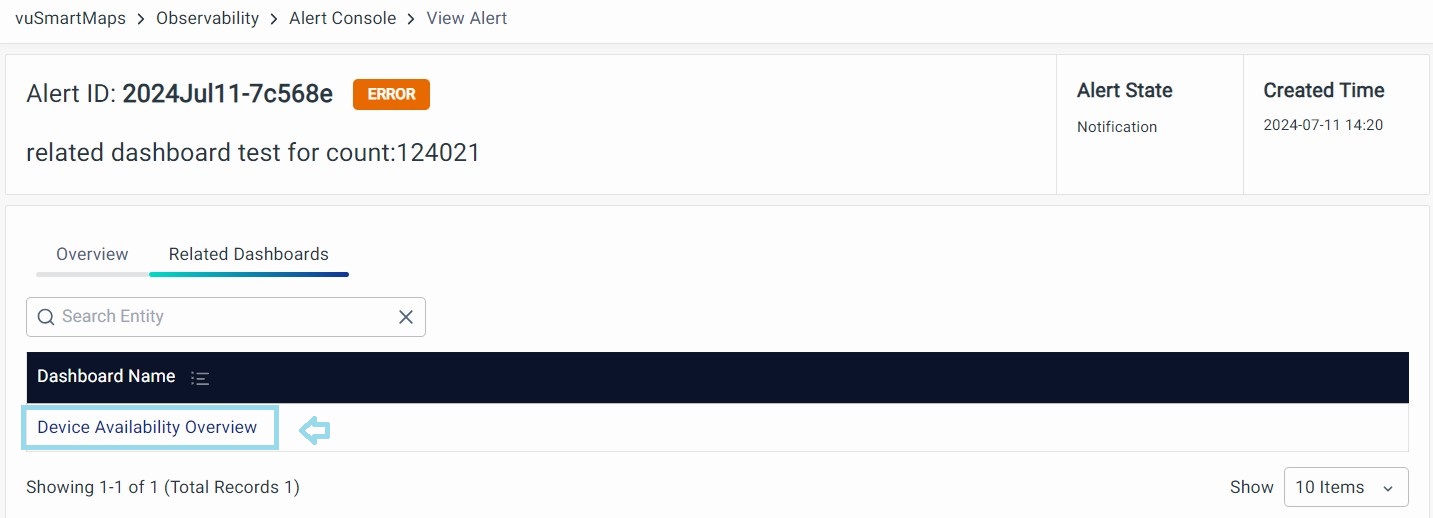
Click on the name of the dashboard highlighted and the respective dashboard will be displayed.