Configuring Insight Cards
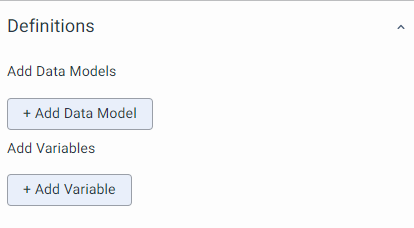
Insight Cards Section
These steps provide an overview of how to work with Insight Cards.
Step 1: To create a new Insight Card or Insight Card Template, click the + button in the top right corner of the Insight Cards tab.
Step 2: You will be directed to the configuration page, where you can choose one of the following options:
- Create Insight Card: Manually select Data Models, add Variables and Scripts, and input HTML/Markdown Template code to create a custom Insight Card.
- Create Insight Card Using Template: Utilize an existing Insight Card Template to create your Insight Card.
You can create an Insight Card Template by clicking the Save As Template button on the configuration page.
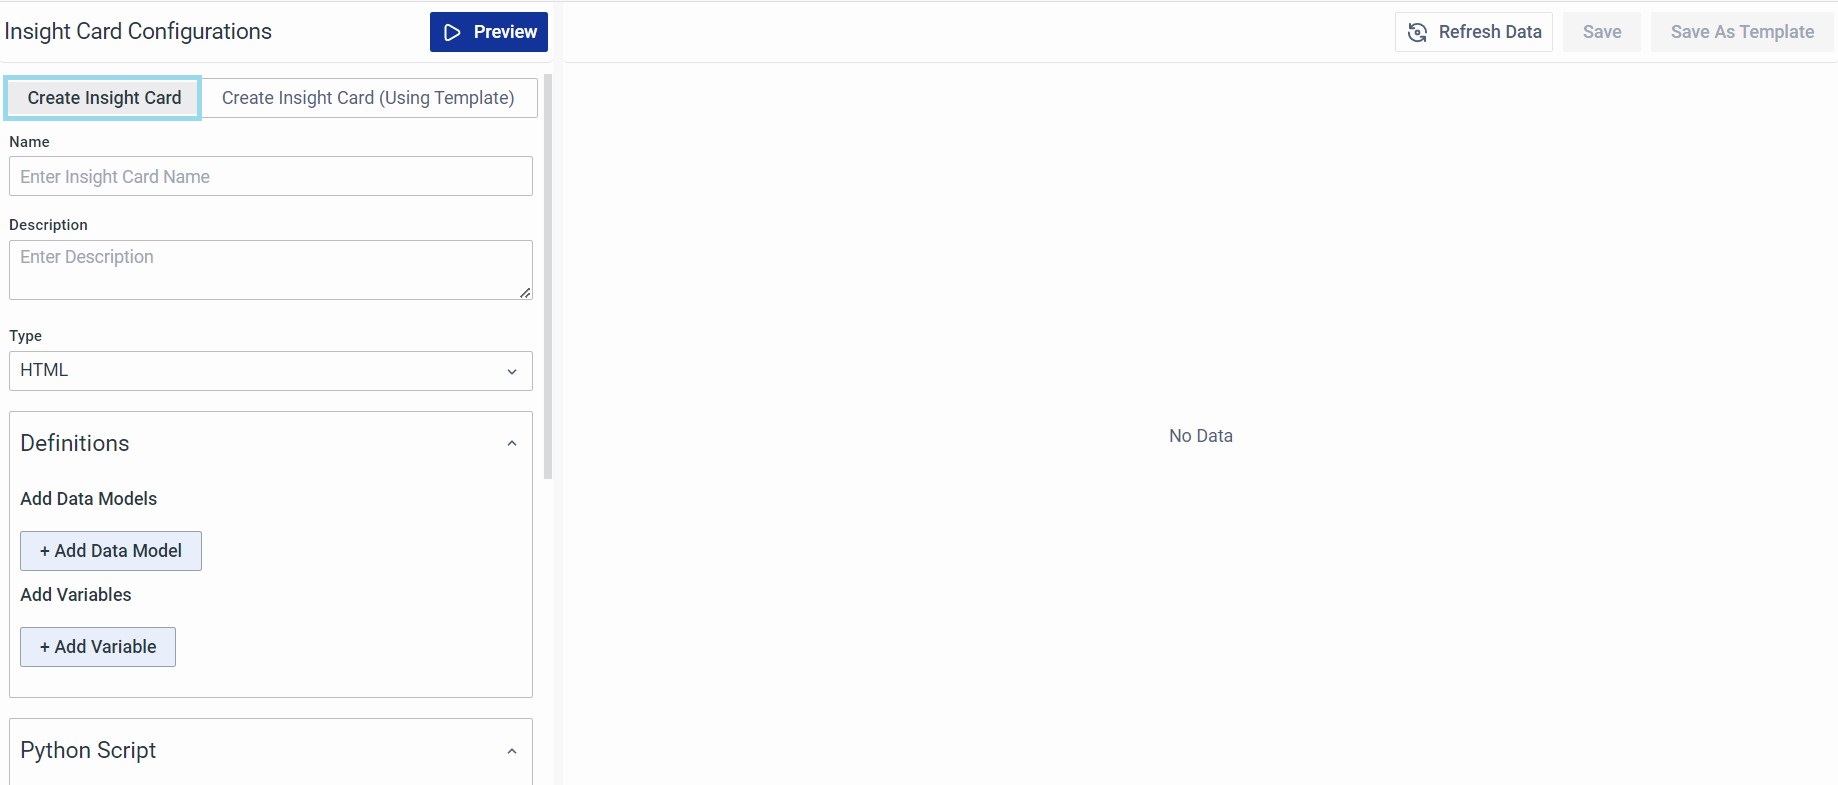
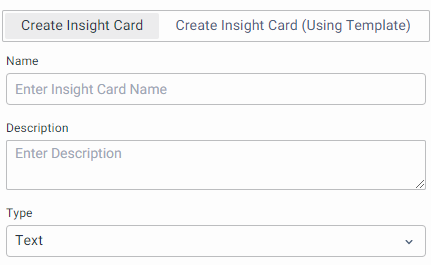
Create Insight Card
This option allows you to manually craft Insight Cards by selecting Data Models, incorporating Variables and Scripts, and entering HTML/Markdown Template code
-
Name: Provide a unique name for the Insight Card
-
Description: Enter the description based on the requirement
-
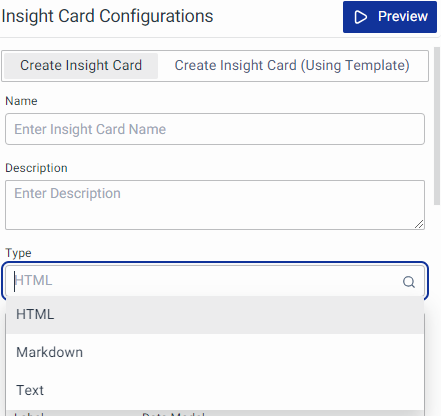
Type: Insights come in three types: Text, HTML, and Markdown.
- Choose 'HTML' to open an HTML code editor.
- Choose 'Markdown' to open the Markdown editor.
- For 'Text' type, no additional editor is needed."
-
Definitions: You can now use Labels and associate them with Data Models and Variables. This makes it easier to incorporate new Data Models and Variables in the future without any code changes.
-
Add Data Models: Choose a Data Model based on the requirements from the dropdown. A Data Model contains 7 elements
- Label: The label is nothing but an identifier to the selected Data model, you can use this Label in the Python script to refer to the Data model and for the selected ‘Time Range’
- Data Model: Select a Data Model from the list of existing Data Models.
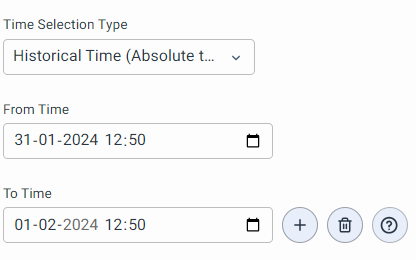
- Time Selection Type: There are 3 options here:
- Contextual time (Default): This considers the time and timezone of your system.
- Time-Shift (Relative): You can enable this to track shifts automatically based on the local time. So you don't need to change shifts manually Select this option and choose the time range.
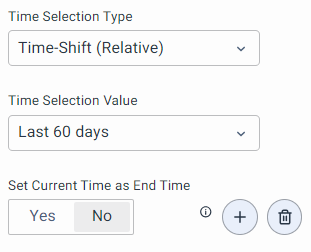
- Click on the Time Selection Value drop-down to seek past data.
- Current time as end time: Setting Yes will consider the current time as the end time while previewing insight. Setting No will consider the end time from the Global Time Selector.
- Example: Take a dashboard displaying key performance indicators (KPIs) over the last 15 minutes. However, if a user chooses to view historical data, the visualization will adjust to display information for the selected time. In such cases, the top section of the dashboard will consistently show data from the last 15 minutes, using the current time as the endpoint. Even if the other panel in the dashboard shows data for the selected time, the top KPI will always be the live feed.
- Historical Time (Absolute time range) - Select From date & time and To date & time for which you would like to seek data.
- Eye icon: Click this button to preview the selected Data Model. It just shows what metrics are available.
- + icon: Click on this button to add another Data model
- Delete icon - Click on this button to remove an added Data Model
- i - icon (Help text) - To view help text, the help text will come as a tooltip. If a template is used to create this Insight card then this help text will contain information configured when creating the template.
-
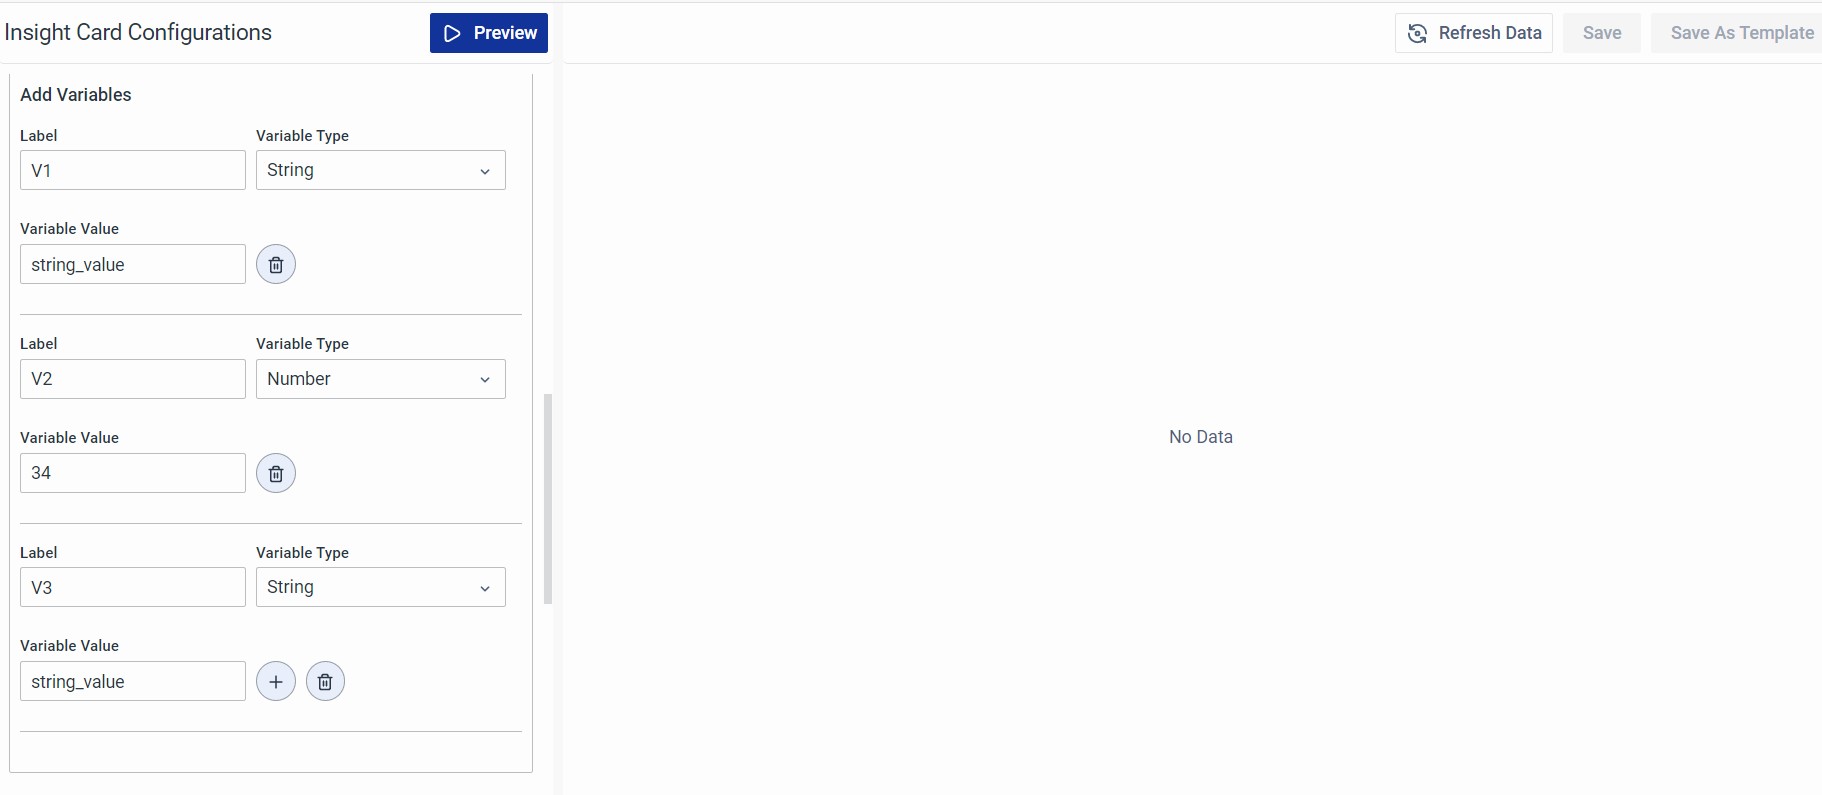
Add Variables: These are versatile values used in Python Scripts or templates to simplify the process.
- Label: Used to reference a specific variable in Python scripts.
- Variable Type: Choose between String or Integer from the dropdown.
- Variable Value: Enter the appropriate string or integer based on the chosen type.
These variables can be utilized in Python scripts, reducing the need for static values and enhancing the templatization of Insight cards.
- Python Script: Add the necessary script for the Insight Card.
- Python scripts can access selected definitions (including data models and variables) to process data and store results in the predefined variable VALUE. These results are later used for rendering.
- Data models are accessed in Python as
DM['Label of DM in insights'] - Variables are accessed as
$<variableLabel>. - You can learn more in the Practical Use Case - Insight without Using Template section.
- HTML or Markdown Code: Create your own HTML or markdown. You can learn more in the Practical Use Case - Insight without Using Template section.
The screen features the following buttons:
Preview: This allows users to preview the Insight Card. Until the preview is executed, the Save and Save as Template options at the top right remain inactive. This ensures that the data is functioning correctly.
Refresh Data: Use this button to refresh the data and fetch the latest values.
Save: Select this option to save the Insight Card with the name provided in the Name field of the configuration section.
Save As Template: Click on Save as template to open a dialog box. Enter the Template Name, Description, and Help Texts for Data Models and Variables. Names and Descriptions are mandatory fields. This option pre-fills the details of Data Models and Variables created in the configuration section.
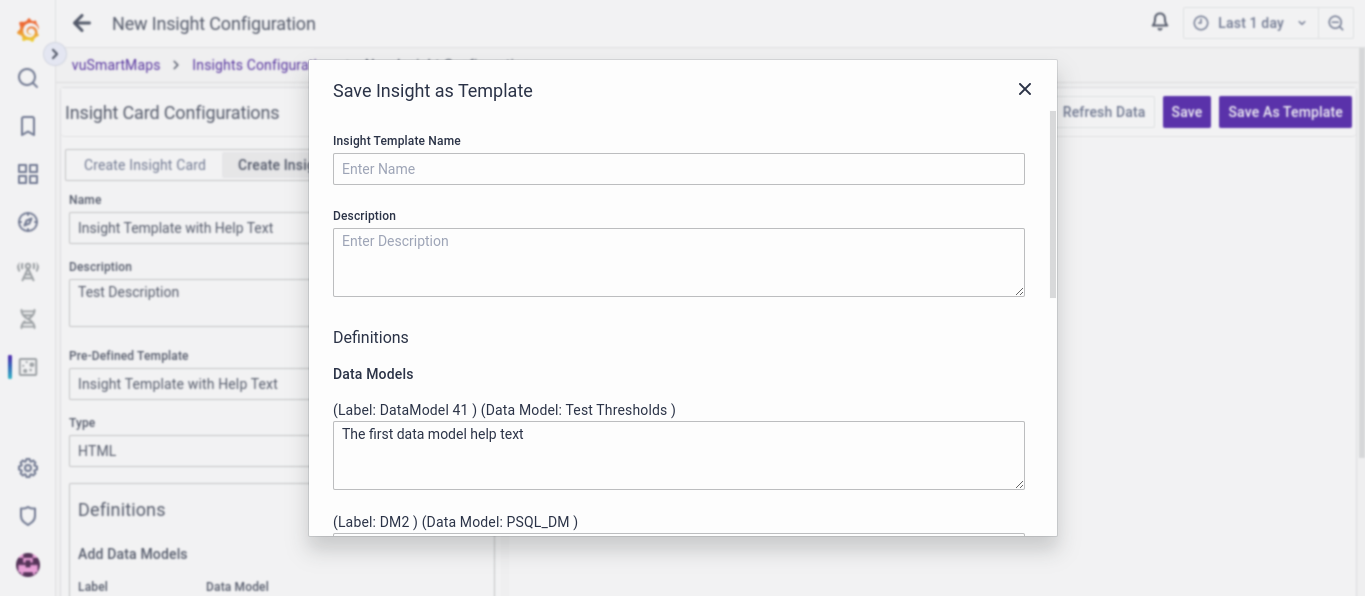
Click the Save button to save the configurations as an Insight Card Template, and it will be accessible on the Insight Card Templates list page.
Practical Use Case - Insight without Using Template
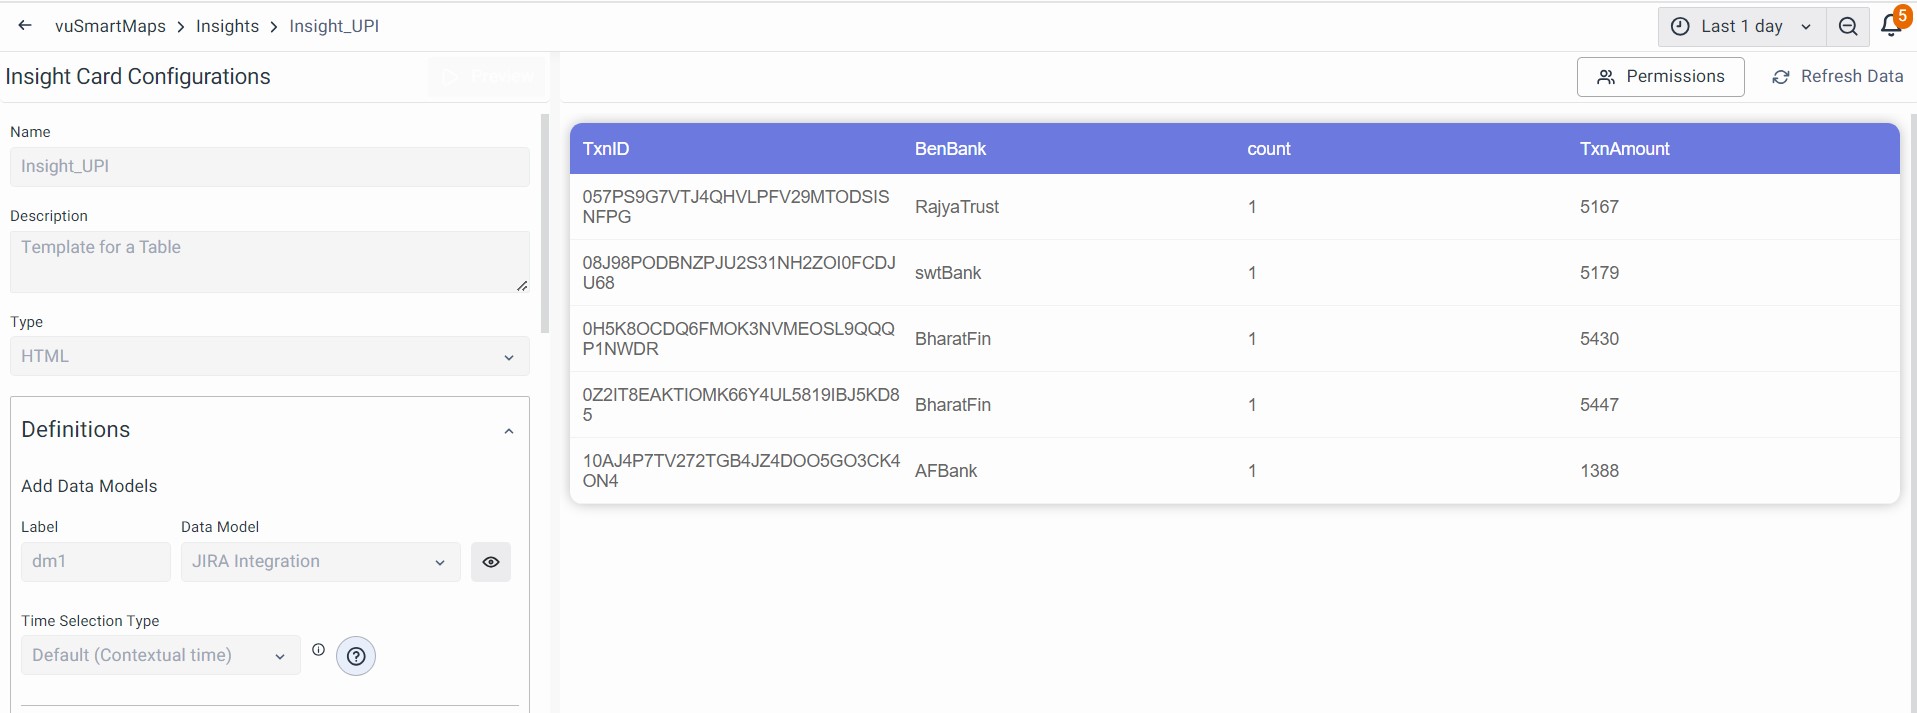
A Data Model is essential for each insight. In this instance, we will generate an insight that provides a “System Status determined by Transaction Duration”.
For this demonstration, you have a Data Model named "Txn Duration," and its output is
The Data Model consists of four columns with associated values. Since no grouping is specified in the Data Model, the resulting output will consistently contain only one row.
Step 1:
Navigate to the Insight Configurations and choose the "Create Insight Card" tab.
Step 2:
Define your Data Model and Variables for the insights.
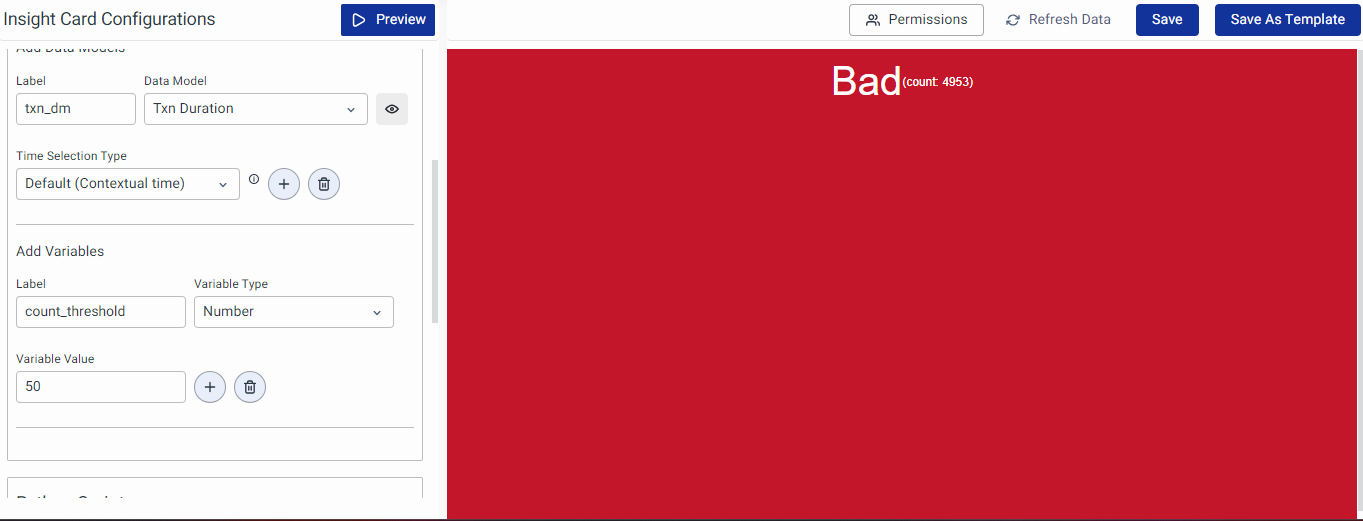
Data Model: In the insights, you have the flexibility to load multiple Data Models (DMs) based on your needs. To incorporate DMs into your insights, navigate to the Definitions section. Click on the Add Data Model button to include a DM.
Once you click on Add Data Model, you will encounter fields to input the Data Model information. These fields include:
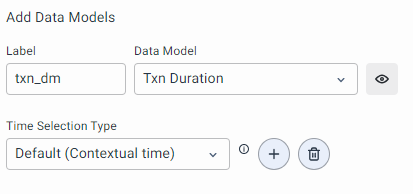
- Label: In our example, we are naming the Data Model
txn_dm. - Data Model: This is a dropdown menu where you select the specific Data Model you want to incorporate.
- Time Section Type: This is a dropdown field that allows you to choose the time format. For most use cases, the "Default" option is suitable.
Variables: Variables are optional components that allow you to define rules or configurations. To add a variable, follow these steps:
- Click on the Add Variable button. After clicking, you will be prompted to input information for the variable.
- For our insight, we're incorporating a variable to set a count threshold. I've named this variable
count_threshold, designated it as a numerical type, and assigned a value of 50.

Step 3:
Crafting the logic using Python code and generating output values.
The insight leverages Python programming to derive meaningful outputs. To achieve this, you extract relevant data from the Data Model and utilize variables to construct our business logic according to specific requirements, yielding the output values for display.
In Python, the initial step involves storing Data Model information in a variable. For instance, you have assigned the data from the Data Model to a variable named "data." All the added Data Models in the Data Model section are stored in a dictionary named DM. You can access each Data Model using its label, as specified during the Data Model setup.
Syntax:
a = DM['<data_model_label>']
In our example, we wrote it like this:
data = DM['txn_dm']
The data retrieved from the Data Model will consistently be an array of dictionaries, where the keys of each dictionary correspond to the column names assigned in the Data Model. The number of rows in the Data Model translates to the number of dictionaries present in our data.
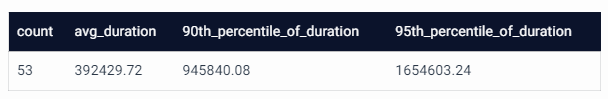
Here is an example of the sample output for our data:
[
    {
        'count': 45,
        'avg_duration': 437290.87,
        '90th_percentile_of_duration': 917727.07,
        '95th_percentile_of_duration': 1582993.26
    }
]
In the presence of additional rows, the same dictionary structure would be repeated for each corresponding row, appearing as many times as there are rows in the dataset.
Sample:
[
    {'count': 5031, 'avg_duration': 437290.87, '90th_percentile_of_duration': 917727.07, '95th_percentile_of_duration': 1582993.26},
    {'count': 4823, 'avg_duration': 401829.45, '90th_percentile_of_duration': 890321.12, '95th_percentile_of_duration': 1520123.14},
    {'count': 5167, 'avg_duration': 415736.21, '90th_percentile_of_duration': 932874.55, '95th_percentile_of_duration': 1605876.39},
    # ... more dictionaries representing additional rows
]
Next, we will extract the variable value for use in our Python logic to determine whether the status is categorized as good or bad. For any variable defined in the variable section, it becomes accessible through the dictionary VAR.
Syntax:
threshold = VAR['<variable_label>']
In our example we use:
threshold = VAR['count_threshold']
Complete Python code for the same:
# Retrieve data from the 'txn_dm' Data Model
data = DM['txn_dm']

# Retrieve the value assigned to the 'count_threshold' variable
threshold = VAR['count_threshold']

# Check if data is available
if len(data) > 0:
    # Extract 'count' from the first dictionary in the 'data' array
    count = data[0]['count']

    # Check if the count exceeds the specified threshold
    if count > threshold:
        # Set color and state for a 'Bad' status
        color = '#C4162A'
        state = f'Bad <span class="count_span">(count: {count})<span>'
    else:
        # Set color and state for a 'Good' status
        color = '#73BF69'
        state = f'Good <span class="count_span">(count: {count})<span>'
else:
    # Set color and state for 'No Data' scenario
    color = '#E0E0E0'
    state = "No Data"

# Assign the determined color and state values to the VALUE dictionary
VALUE['color'] = color
VALUE['state'] = state
The VALUE dictionary serves as the output container, holding the result for presentation. This variable is instrumental in formatting the output according to the desired display format.
We have the option to choose among HTML, TEXT, and Markdown formats. For this explanation, we focus on HTML as it is a widely utilized format. HTML offers flexibility, enabling the incorporation of complete HTML, CSS, and JS. This flexibility allows us to craft visually appealing and colorful insights tailored to our preferences.
Step 4:
Choose the Output Type and Craft the Output Template
Specify the desired output type. The output values are stored in the VALUE dictionary, and these values can be incorporated into HTML using a mustache template to showcase the intended results.
HTML template
<style>
  .insight_card{
      position: absolute;
      inset: 0;
      font-family: 'Inter-Medium', sans-serif;
      padding: 10px 20px;
  }

  .insight_value {
      font-size: 40px;
      margin-bottom: 10px;
      text-align: center;
      color: white;
      display: flex;
      align-items: center;
      justify-content: center;
  }

  .count_span {
    font-size: 12px;
  }
</style>
<div class="insight_card"  style="background-color:{{color}}">
  <div class="insight_value">
        {{{state}}}
  </div>
</div>
This Mustache template is a simple HTML structure designed to dynamically incorporate values from your program, particularly from the VALUE dictionary, into the HTML output. Let's break it down:
<div class="insight_card" style="background-color:{{color}}">:
This div represents the outer container of your insight card. class="insight_card" is a class attribute for styling purposes, providing a common style to elements with this class. style="background-color:{{color}}" sets the background color dynamically based on the value stored in the color variable from your Python code.
<div class="insight_value">{{{state}}}</div>:
This div, with a class of insight_value, is nested inside the outer container. It is intended to display the main content or value of your insight. {{{state}}} injects the content dynamically from the state variable in your Python code.
The triple curly braces ({{{ }}}) are used to render the HTML content as raw HTML, allowing any HTML tags within the state variable to be interpreted and displayed correctly.
Step 5:
Execute and save the insight. Click on the preview button at the top to view the output of the insight. Upon previewing, you will witness the output aligning with the designed structure.
The output is:
In this iteration, we adjusted the threshold value within our variable to 5000.
The output is:

Save the insight along with its description. Your insight is now saved and ready for use in the dashboard.
Create Insight Card Using Template
Pre-built insights can be directly loaded, and by making simple adjustments to the Data Model and variable settings, a brand-new insight can be created without the need for manual Python coding or template creation in the system.
This facilitates users in easily configuring insights based on their specific requirements. Additionally, users have the flexibility to modify any logic or user interface elements as needed to align with their unique preferences or evolving requirements.
Step 1:
Navigate to the Insight Configurations and choose the Create Insight Card tab.
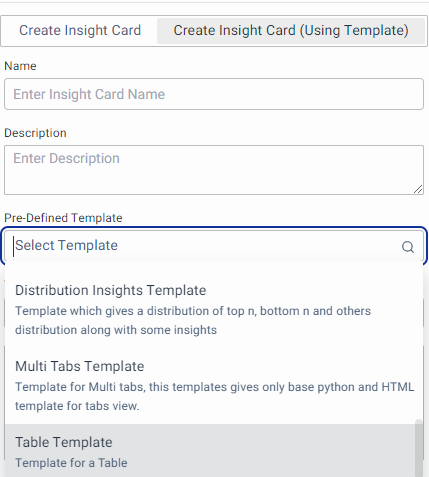
You will encounter a dropdown menu labeled "Pre-Defined Templates," providing access to various templates. Choose the one that suits your use case. To explore all pre-defined templates, refer to the Insight Templates List page. Here, you can open and review the templates to visualize how the insights might appear. Once you select the insight, its default Data Model, Variables, Python code, and template will be automatically loaded.
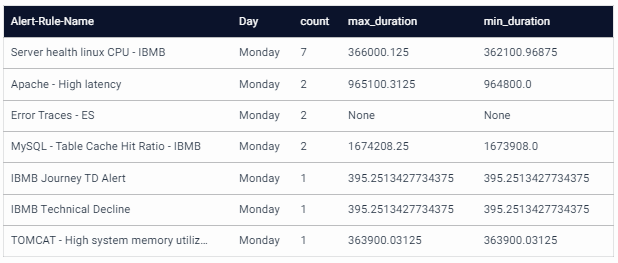
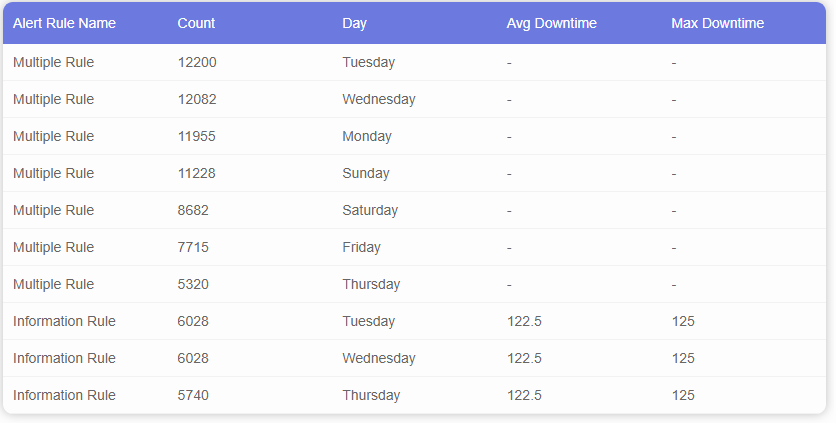
In this example, you choose the “Table Template” as the insight template. The Data Model, named "Alert count" has the following structure:
Step 2:
Choose Your Data Model. The Data Model is automatically populated with its label for the selected insight template. You have the option to select your own Data Model and execute it to observe how the template behaves with the new Data Model.
It's important to note that most templates come with built-in validation, and if any configuration is required, an error message will guide you through the setup. Each template created will have its documentation outlining the configuration process for the Data Model and variables specific to that insight.
If we load our Data Model "Alert count" and encounter an error message in the template, the error details are as follows:
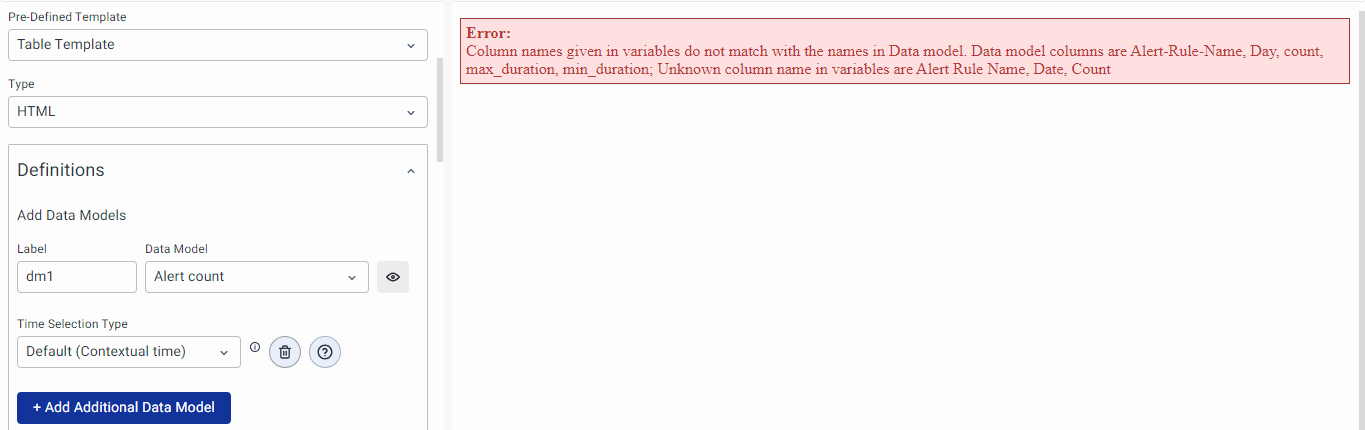
This approach guides the user by indicating the necessity of providing accurate column names in their variables within the insight. It helps identify any incorrect names and provides a list of available variable names in the selected Data Model. This prompts the user to configure the variables in the template accurately, ensuring a proper setup before execution.
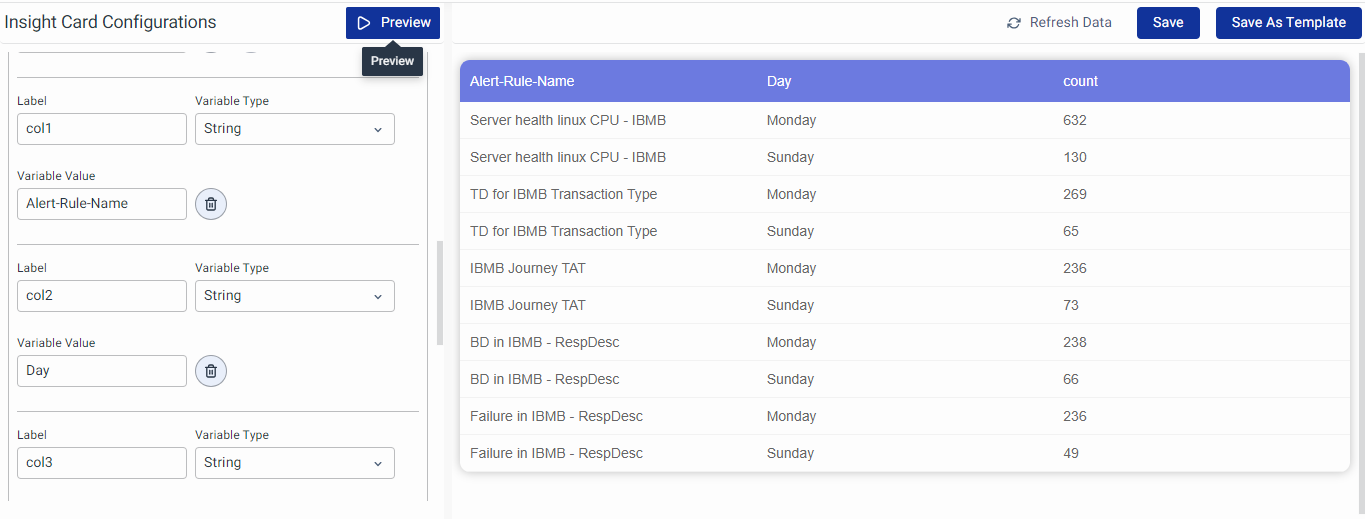
After successfully passing the validation and completing the execution, the insight loads and provides the user with the desired output. This indicates that the configuration is accurate, and the insight is now ready for use, delivering the expected results.
The output after the proper configuration is:
Step 3:
Save: Select this option to save the Insight Card with the name provided in the Name field of the configuration section.
Once you save the insight, it becomes available for use in dashboards.The documentation for the Table Template can be found at the following link: Table template
Insight Actions
On the main Insights page, you can conveniently perform three primary actions:
- View
- Edit
- Delete
View Insights
To view the details of an Insight, simply click on the name of the Insight you want to access. All Insight names are clickable for easy access to their configurations.
Edit Insights
To edit an Insight, simply click on the Edit button associated with the specific Insight Card.
Permissions
Now, You can click on Permissions to manage Object Level Permissions in the Insights Card. The screen will look like this, For every role, you can attribute 3 types of permission.
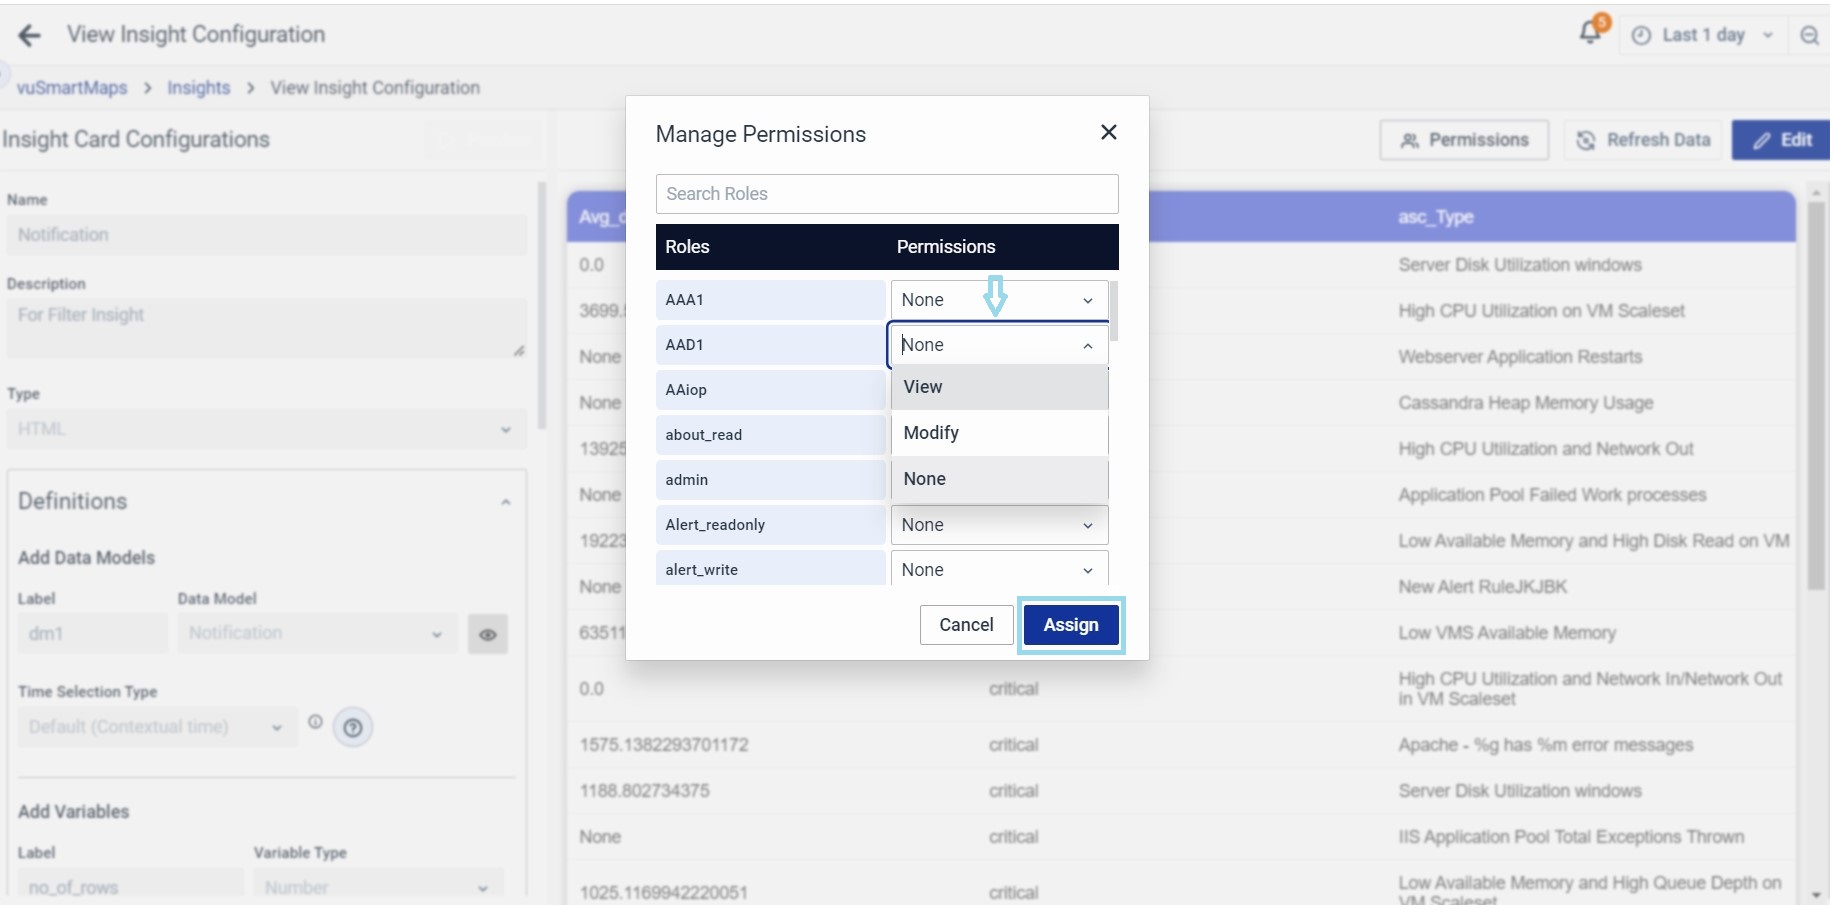
- None: There are no permissions given.
- View: The selected user can only view the Insight Card.
- Modify: The selected can also modify and make changes to the Insight Card.
Delete Insights
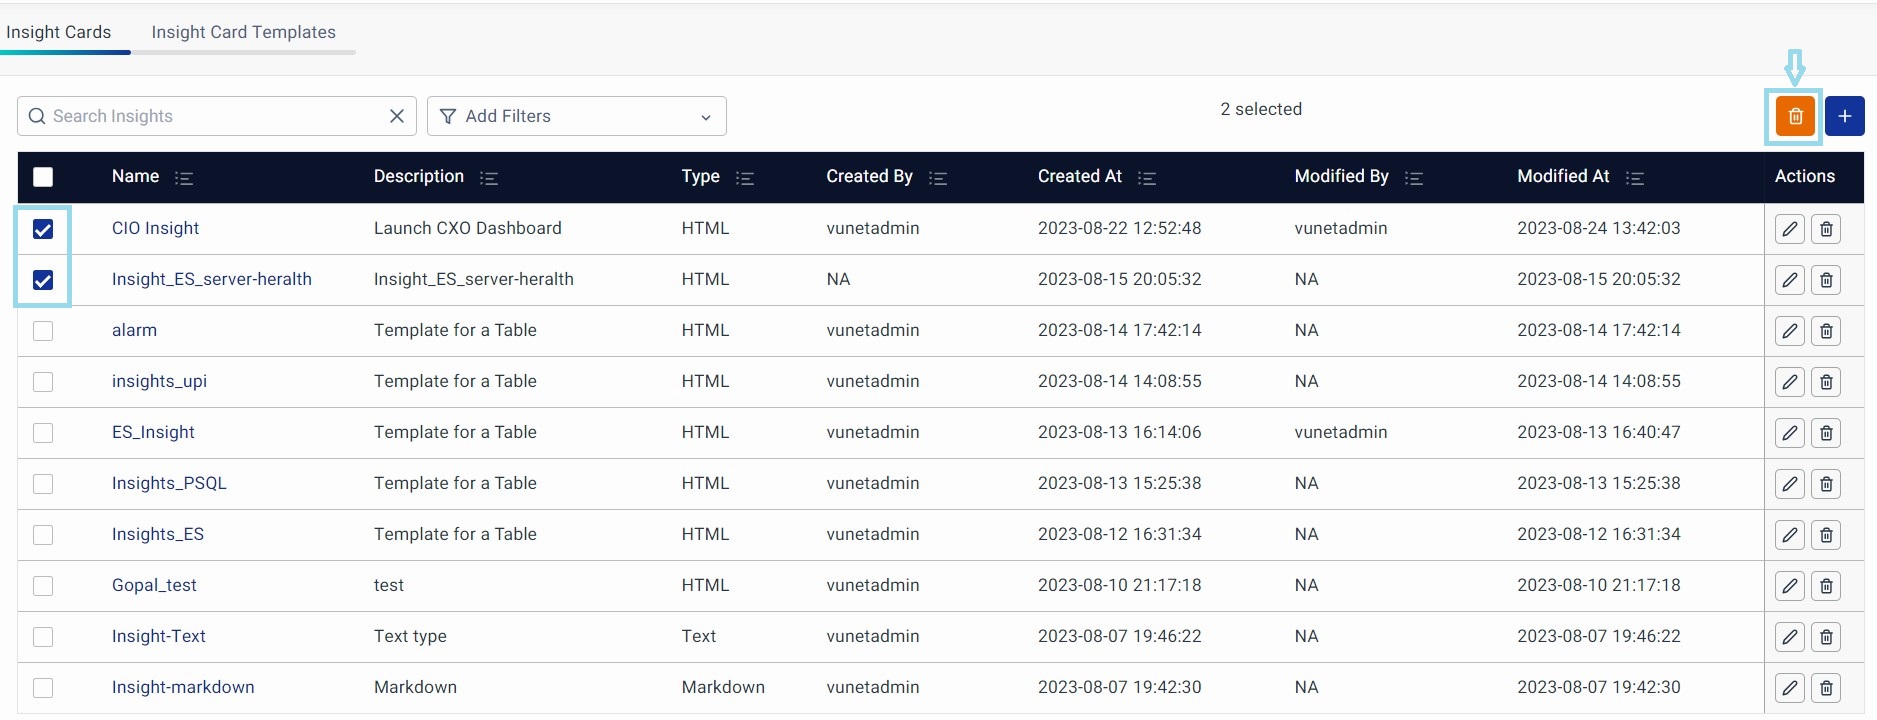
Deleting an Insight Card is straightforward. Locate the Insight Card you want to remove, and in the Action column, click the Delete option.
Multi-Delete: To delete multiple Insight Cards at once, simply select the cards you want to remove by checking the boxes on the left, and then click the Delete button at the top right.
Insight Card Templates Section
In the Insight Card Templates section, you'll find a list of Insight Cards saved as templates, including some pre-installed ones.
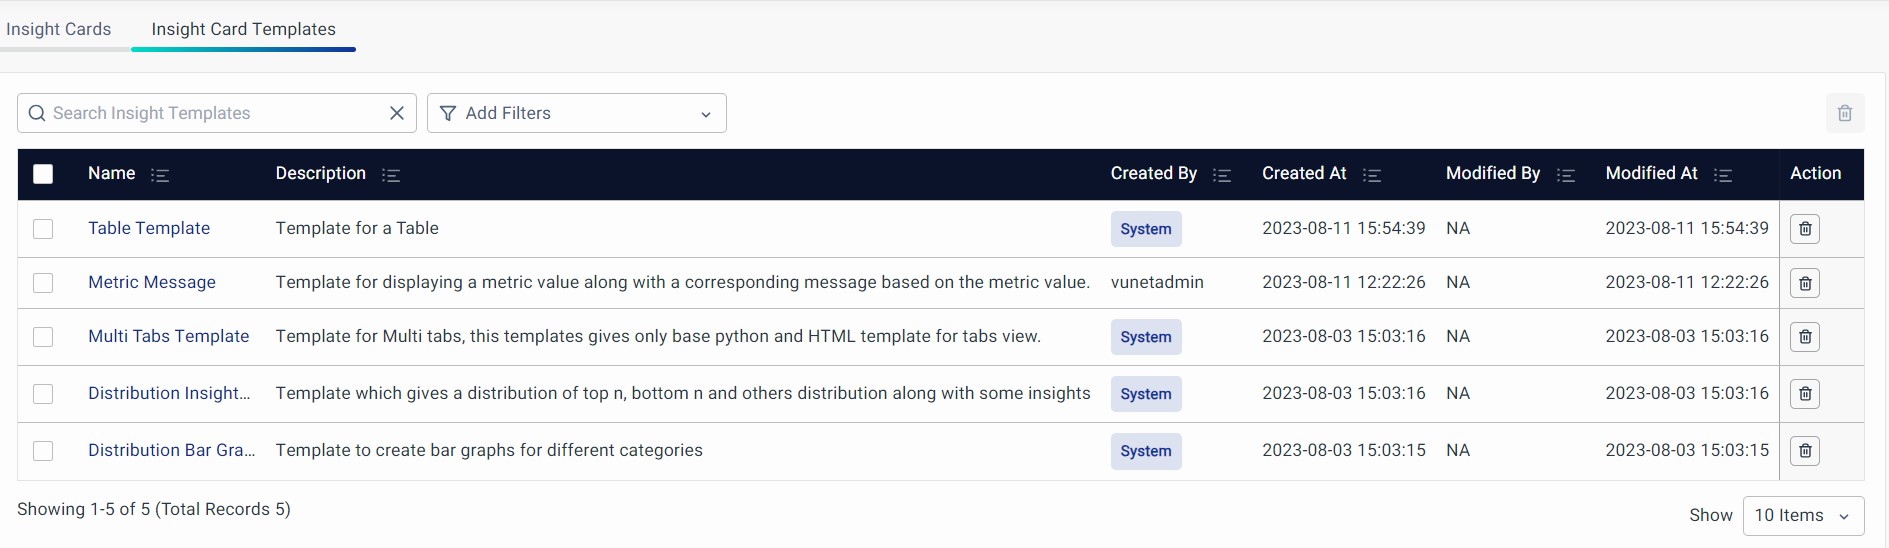
Pre-installed Templates
With pre-installed templates, users can instantly access a range of designs without searching, downloading, or creating templates from scratch. These templates are selected based on thorough testing and evaluation to offer various functionalities.
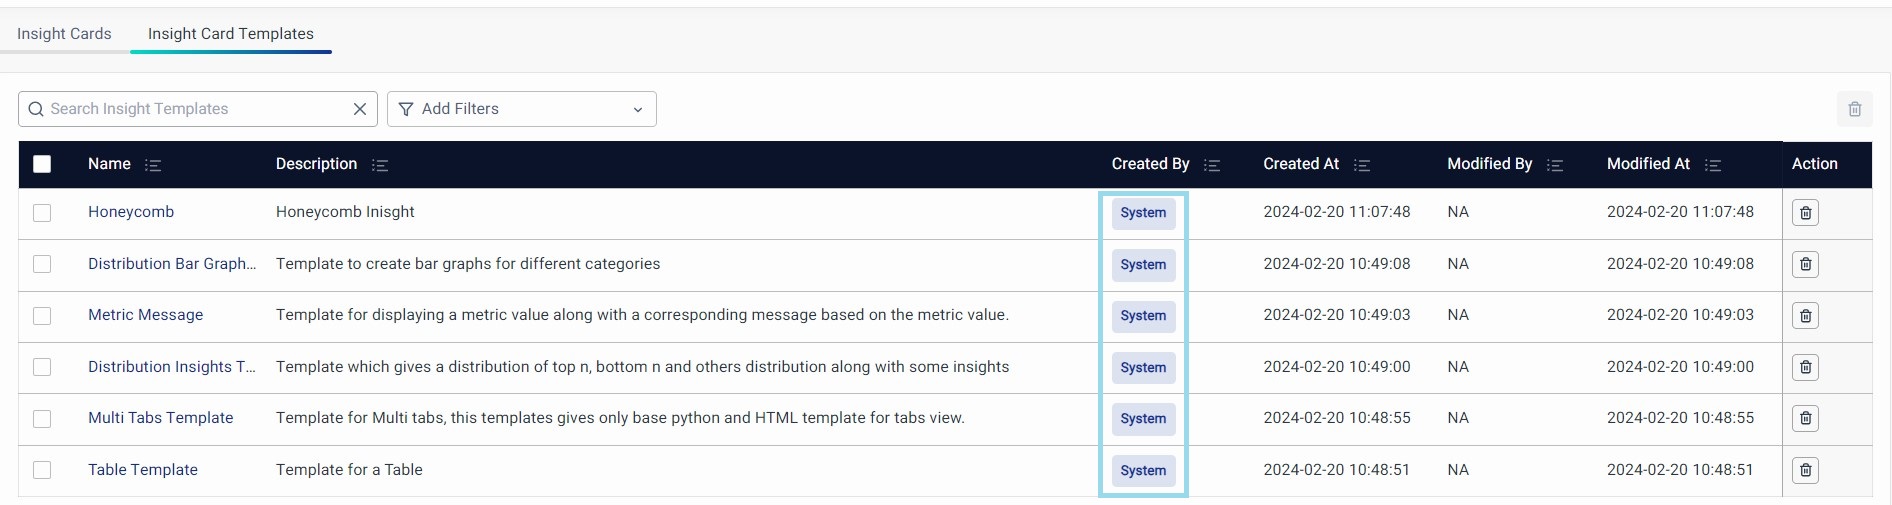
Each template was meticulously developed, taking into customer’s specific requirements and considerations to offer a comprehensive range of options
Let me guide you through three pre-installed templates here.
Dynamic Table Template
This template provides a structured format for organizing data in a tabular layout. It enables users to present information in a concise and visually appealing manner, enhancing readability and comprehension.
You can learn to use this template here.
Distribution Bar Graph Template
With this template, users can effectively visualize and analyze data distribution patterns. It offers intuitive graphing capabilities, allowing users to explore and present data in a visually engaging way, facilitating insights and decision-making.
You can learn to use this template here.

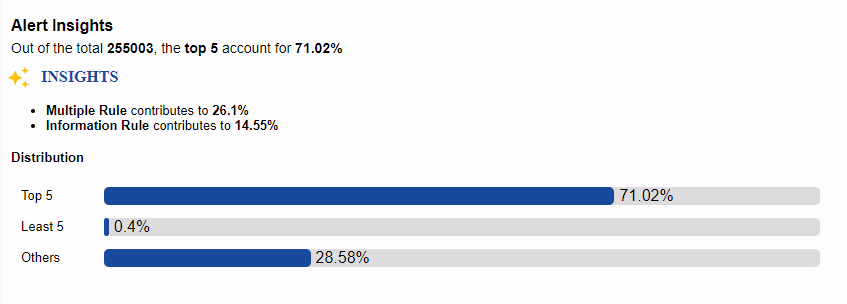
Distribution Insights Template
This template combines the power of data analysis with insightful visual representation. It enables users to extract meaningful conclusions and observations from the distribution data, enhancing the understanding and interpretation of complex datasets.
You can learn to use this template here.
Honeycomb Insight Visualization
Hexagon Insight Visualization empowers you to assess the status of diverse buckets, offering customized options for varying bucketing levels, conditions, and individualized coloring for each hexagon.
You can learn to use this template here.
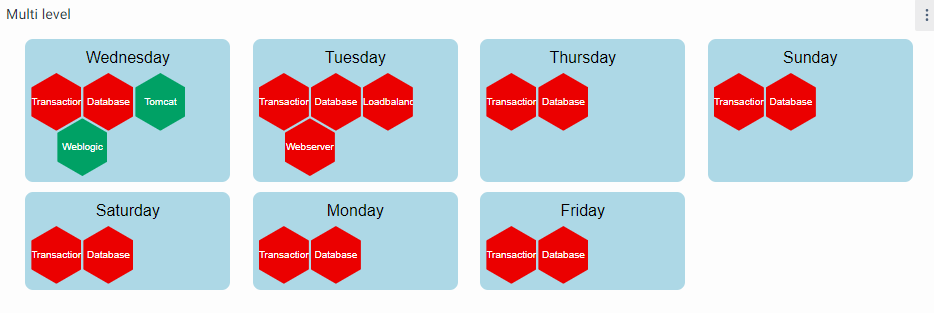
Hexagon Insight Visualization - Multi Level
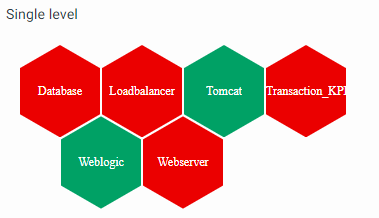
Hexagon Insight Visualization - Single Level
Dashboard Insight Visualization
The Dashboard Tab feature enables users to organize and navigate through various dashboards effortlessly. By creating tabs, users can easily switch between different sets of data visualizations, enhancing the overall dashboard experience and streamlining data exploration.
You can learn to use this template here.
Insight:

In Dashboard:
Configure Dashboard Panel with Insight
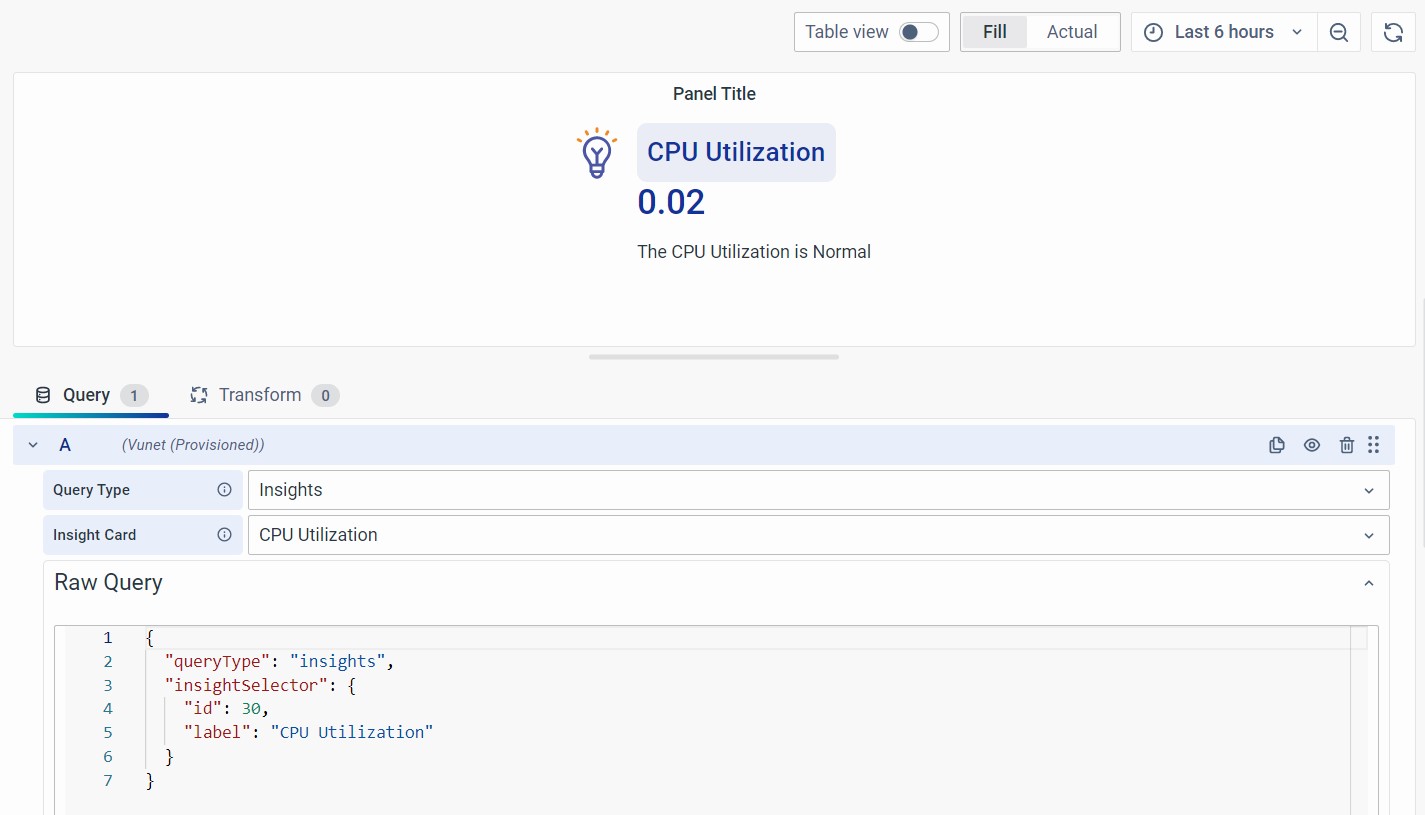
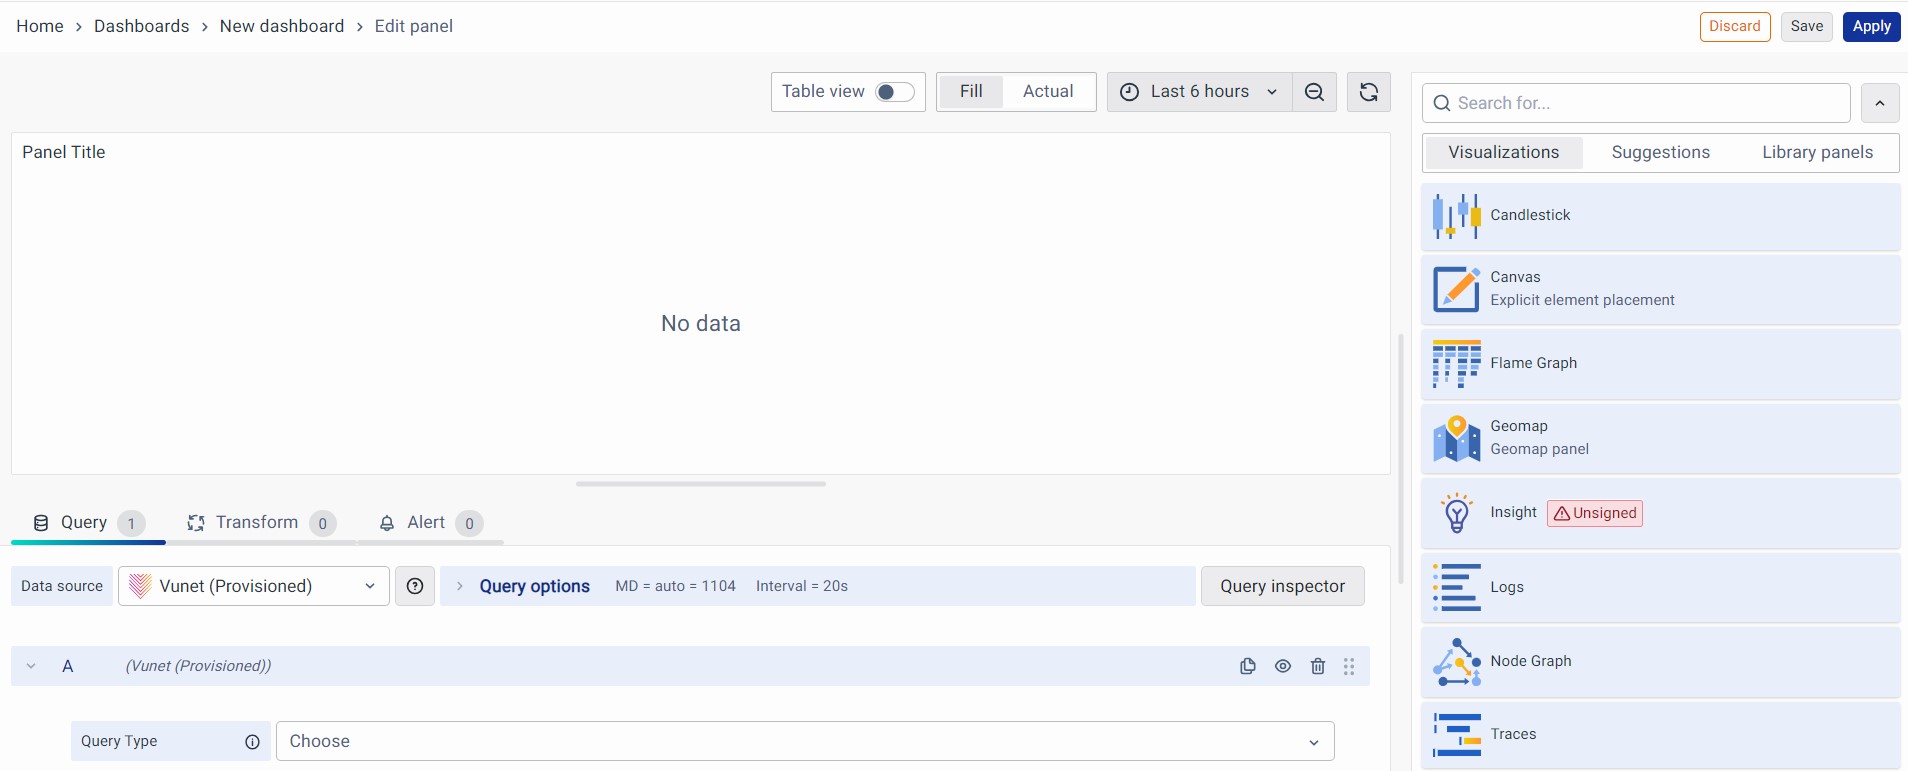
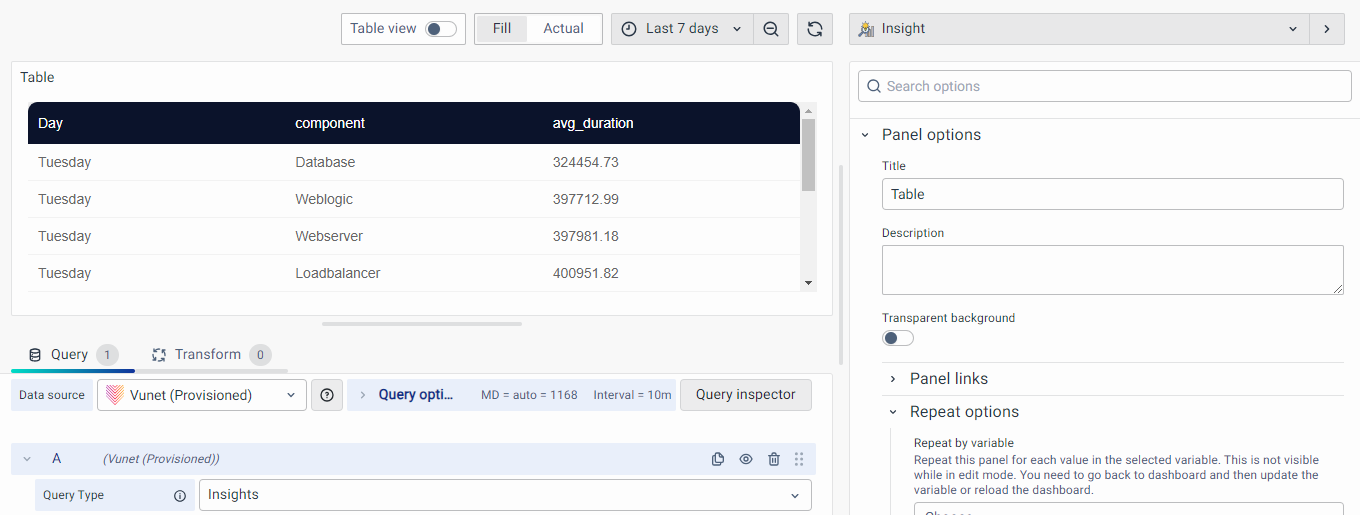
In this section, you can add a new insight and configure it on the panel creation page. It consists of the following steps.
Create a Dashboard and proceed with the following steps.
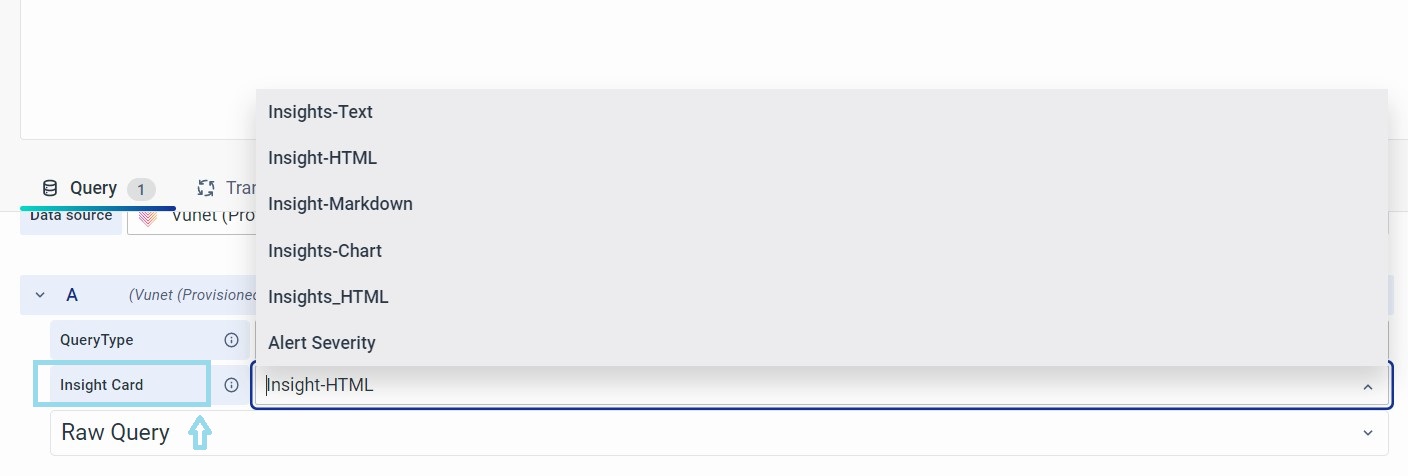
Step 1: To change the default visualization, click on the dropdown on the top right and select “Insight”
Step 2: Select the Query Type as “Insights”
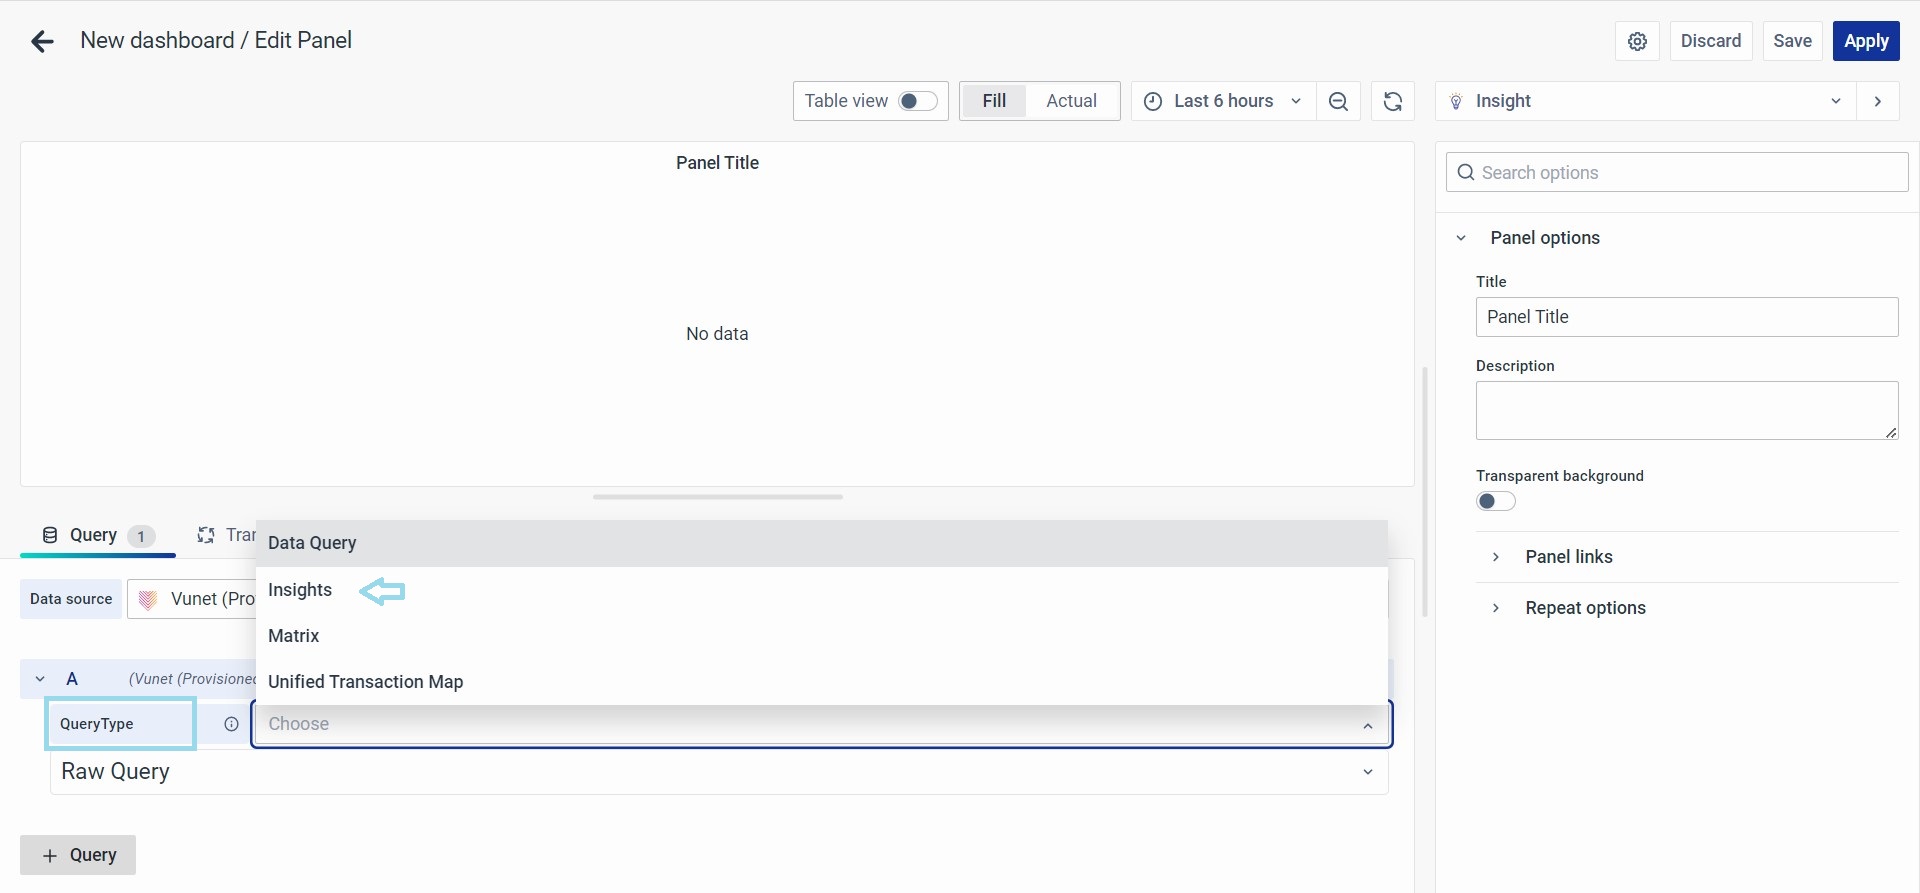
Step 3: Choose the Insight Card from the dropdown.
Step 4: Sample Results - The sample results for HTML, Markdown, or Text Insights Visualization.
- Visualization for HTML type Insight:
- Visualization for Markdown type Insight:

- Visualization for Text type Insight: