Unified Transaction Map (UTM)
Introduction
A Unified Transaction Map (UTM) is a visual representation that illustrates the functional flow of components within a network, application, or transaction. Its purpose is to display:
-
An interconnection map of logical components, highlighting key metrics for each node and link. In this context, a "node" represents a logical component, and a "link" represents the connection between two such components.
-
A time-progress functional map, offering insights into the different stages and elements involved in the various phases of a business transaction.
Working with UTM
UTM comprises 4 important processes.
- Creating UTM is your guide to creating and configuring Unified Transaction Maps with ease. Discover how to configure graphs to visualize your UTM. Learn to create nodes and links, assigning icons, data models, and metrics to your nodes.
- UTM Actions will walk you through the essential actions you can take to manage your Unified Transaction Map (UTM) configurations with ease. On the main page, you have three primary actions - Edit, Copy, and, Delete. You can click on the name of the UTM to View the UTM configuration. We'll show you how to edit settings, manage permissions, and remove configurations.
- Configure UTM Visualization lets you pick your recently created Unified Transaction Map for your UTM panel.
- Visualization Options will help you personalize your UTM (Unified Transaction Map) and other visualizations to get the most out of your data. You have various options at your fingertips:
Creating UTM
Follow the steps to create a UTM configuration.
Step 1: Log in to the vuSmartMaps.
Step 2: vuSmartMaps UTM can be accessed from the left navigation menu (Configure Observability > UTM).

Step 3: On the UTMs List Page, click the + icon in the table header to go to the UTM Configuration Page. The UTM Configuration page will look like the image below in step 4.
Step 4: Make the configurations on the left side and click Preview to apply the changes.
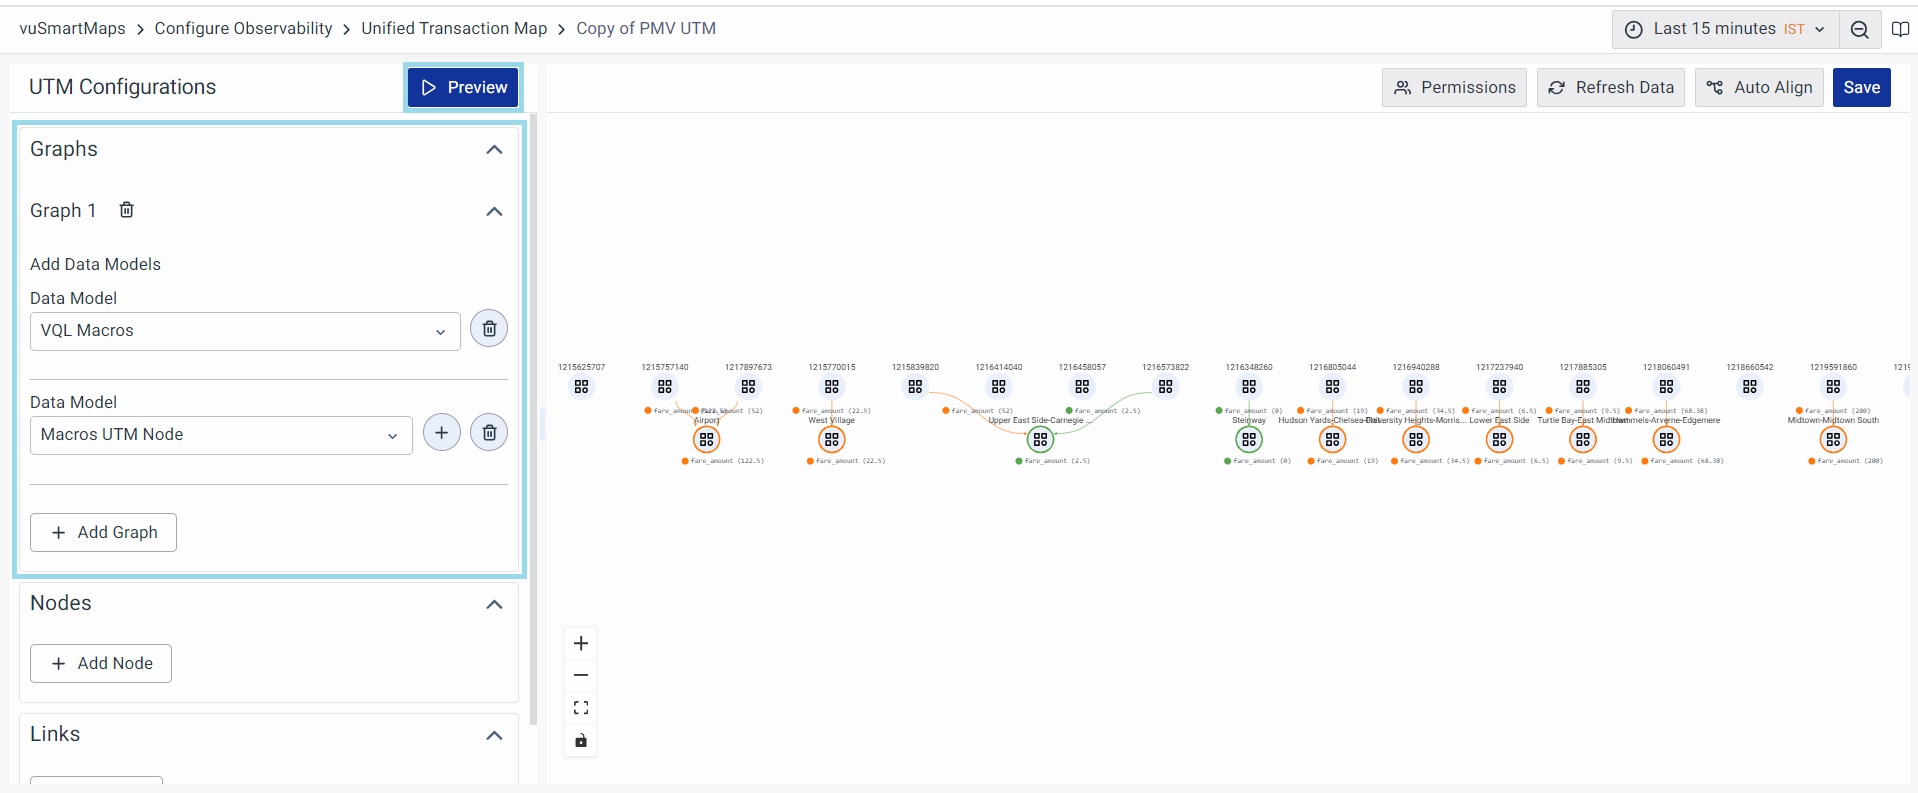
Configuring Graphs
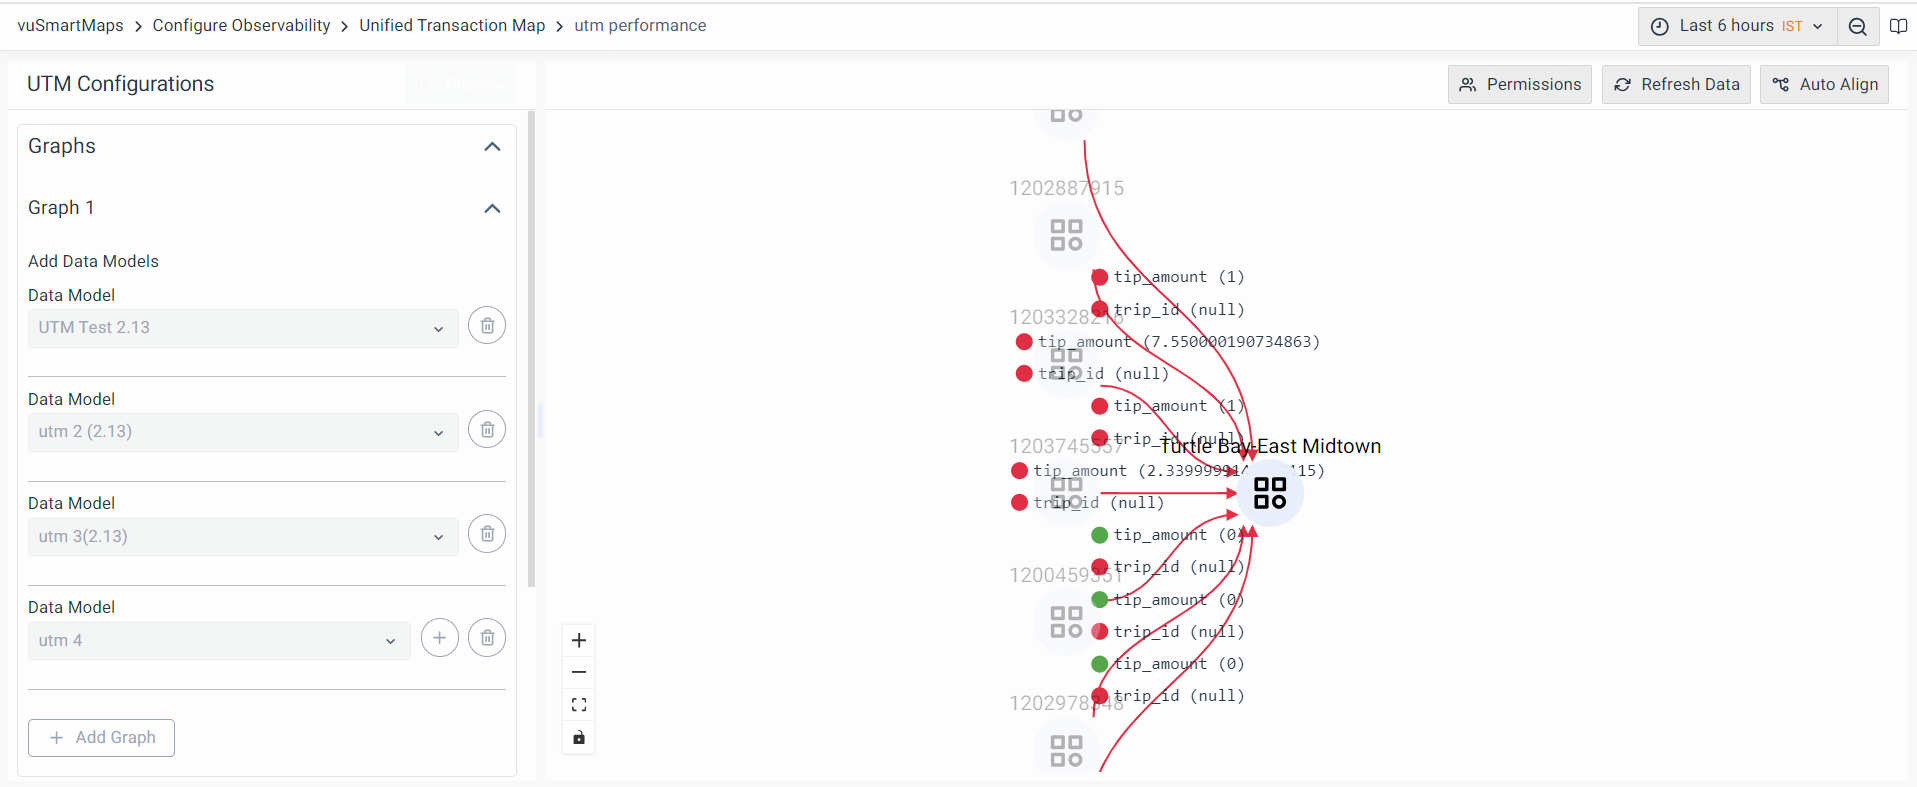
You can visualize the UTM by configuring Data Models. Follow these steps:
Click on + Add Graph under Graphs, enter the graph name, and select the Data Model. You can add multiple Data Models using the + Add Data Model button.
- You can create multiple graphs by clicking the + Add Graph button at the bottom of the Graphs section.
- UTM will be visualized if the selected Data Models have supporting data.
- While configuring the Data Model for UTM using Graph, we can add only 2 grouping fields in the Data Model’s Set Properties section. Also, make sure to include Metrics in the respective Data Models while specifically creating them for configuring UTMs.
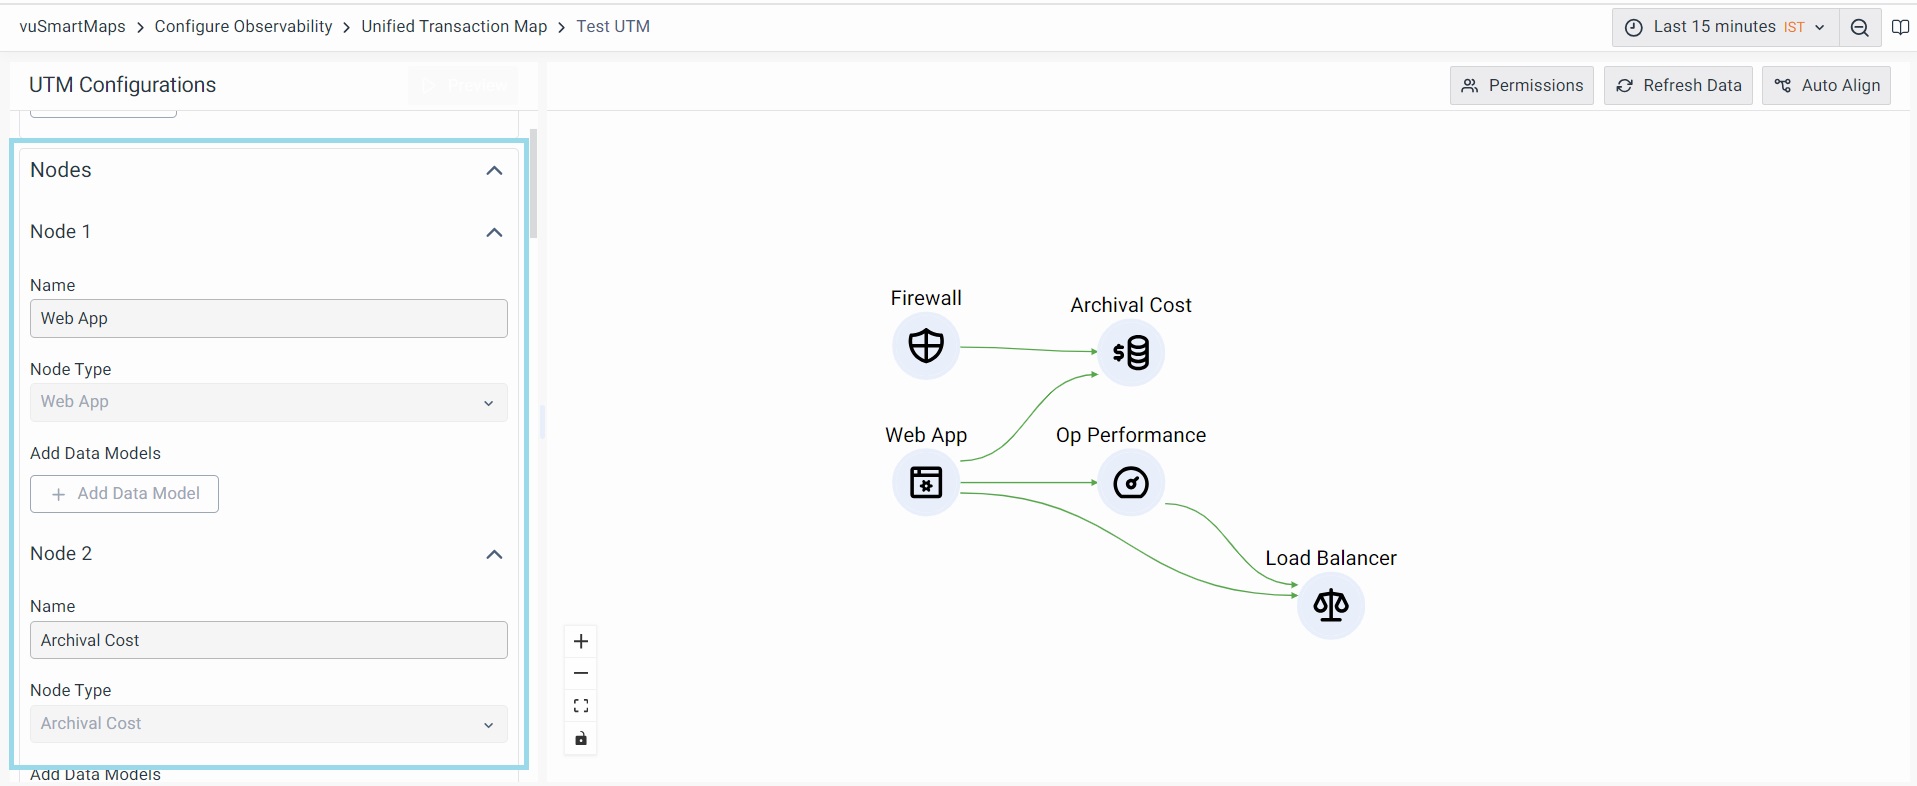
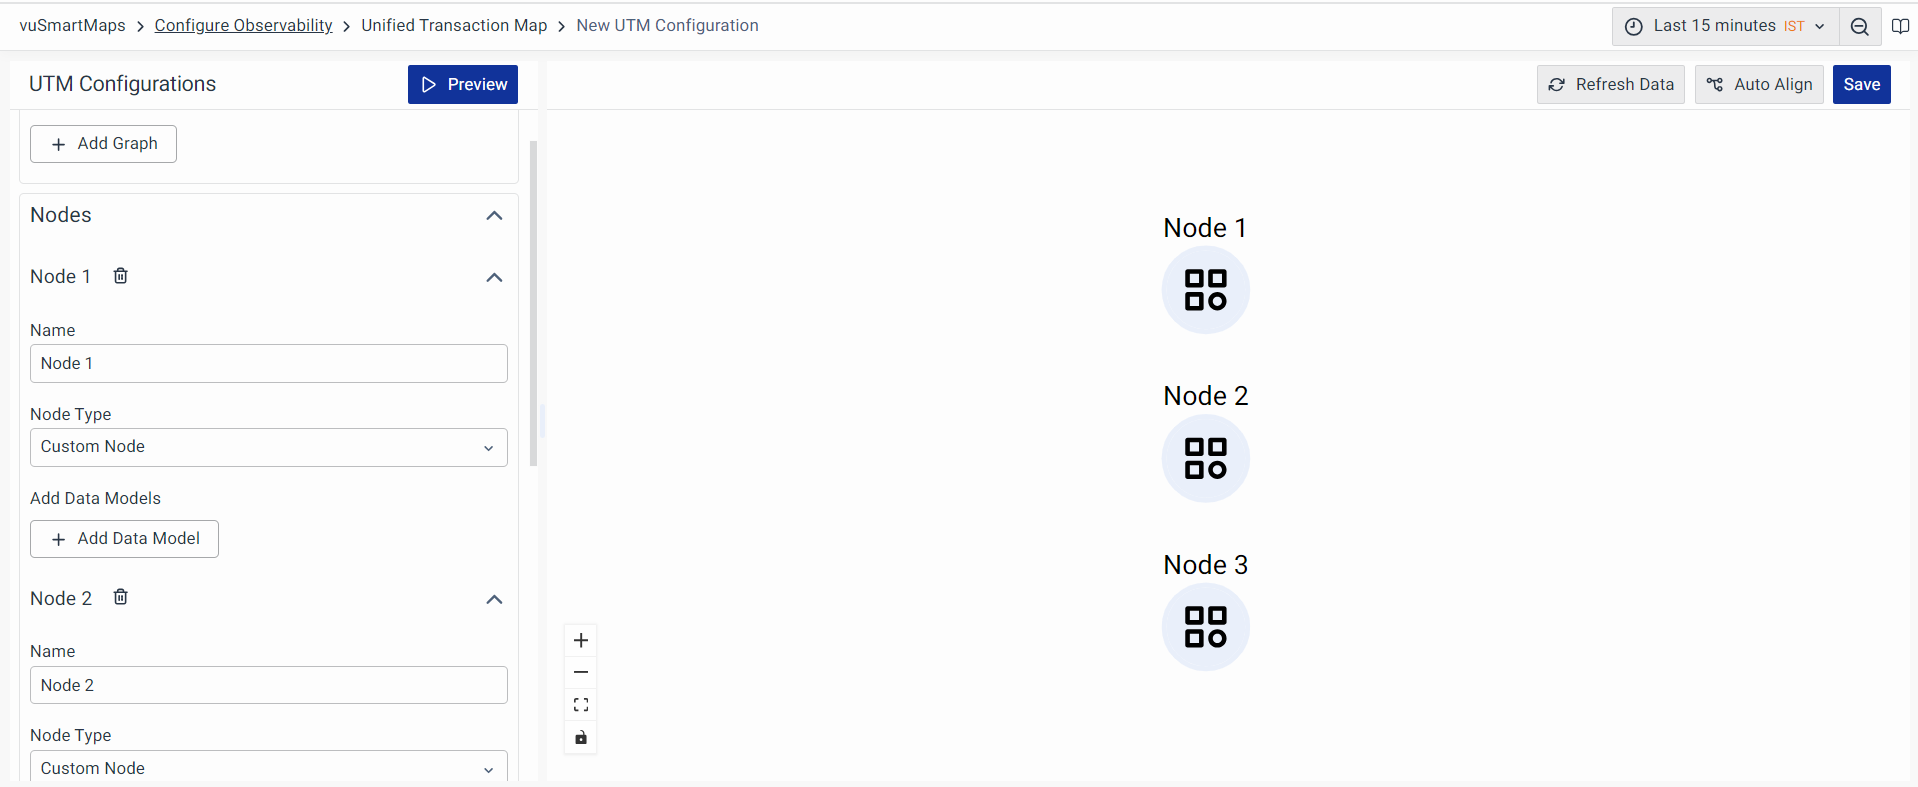
Configuring Nodes and Links
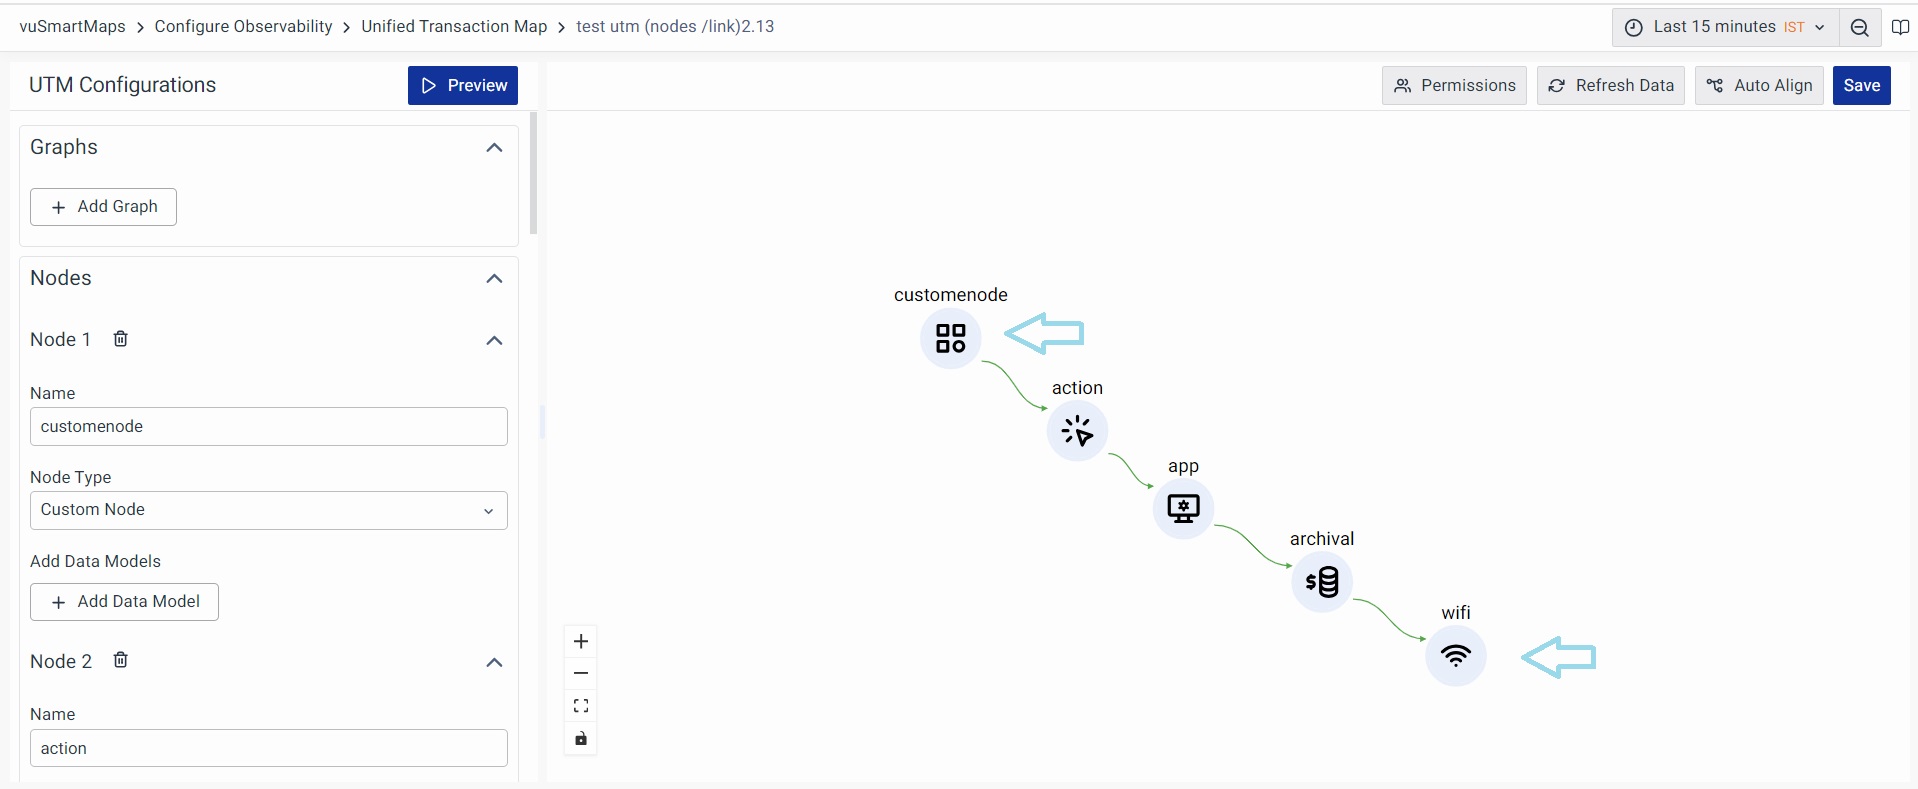
To visualize the UTM, create nodes and links with these steps:
Step 1: Click + Add Node under Nodes, and enter the node name.
Step 2: Choose the Node Type from the dropdown to assign icons to the nodes. The "customnode" type has the default icon.
Step 3: Select the Data Model and metric from the dropdown. Add multiple Data Models to add multiple metrics for 1 node using the + Add Data Model button.
You can create multiple nodes by clicking the + Add Node button at the bottom of the Nodes section.
Click Preview at the top to visualize the data.
Next, create Links:
Step 4: Click + Add Link under Links, and enter the link name.
Step 5: Select the From Node and To Node from the dropdown (nodes created earlier). All the nodes created in the previous section will be listed in the drop-down here.
Step 6: Choose the Data Model and metric from the dropdown. Add multiple Data Models with the + Add Data Model button.
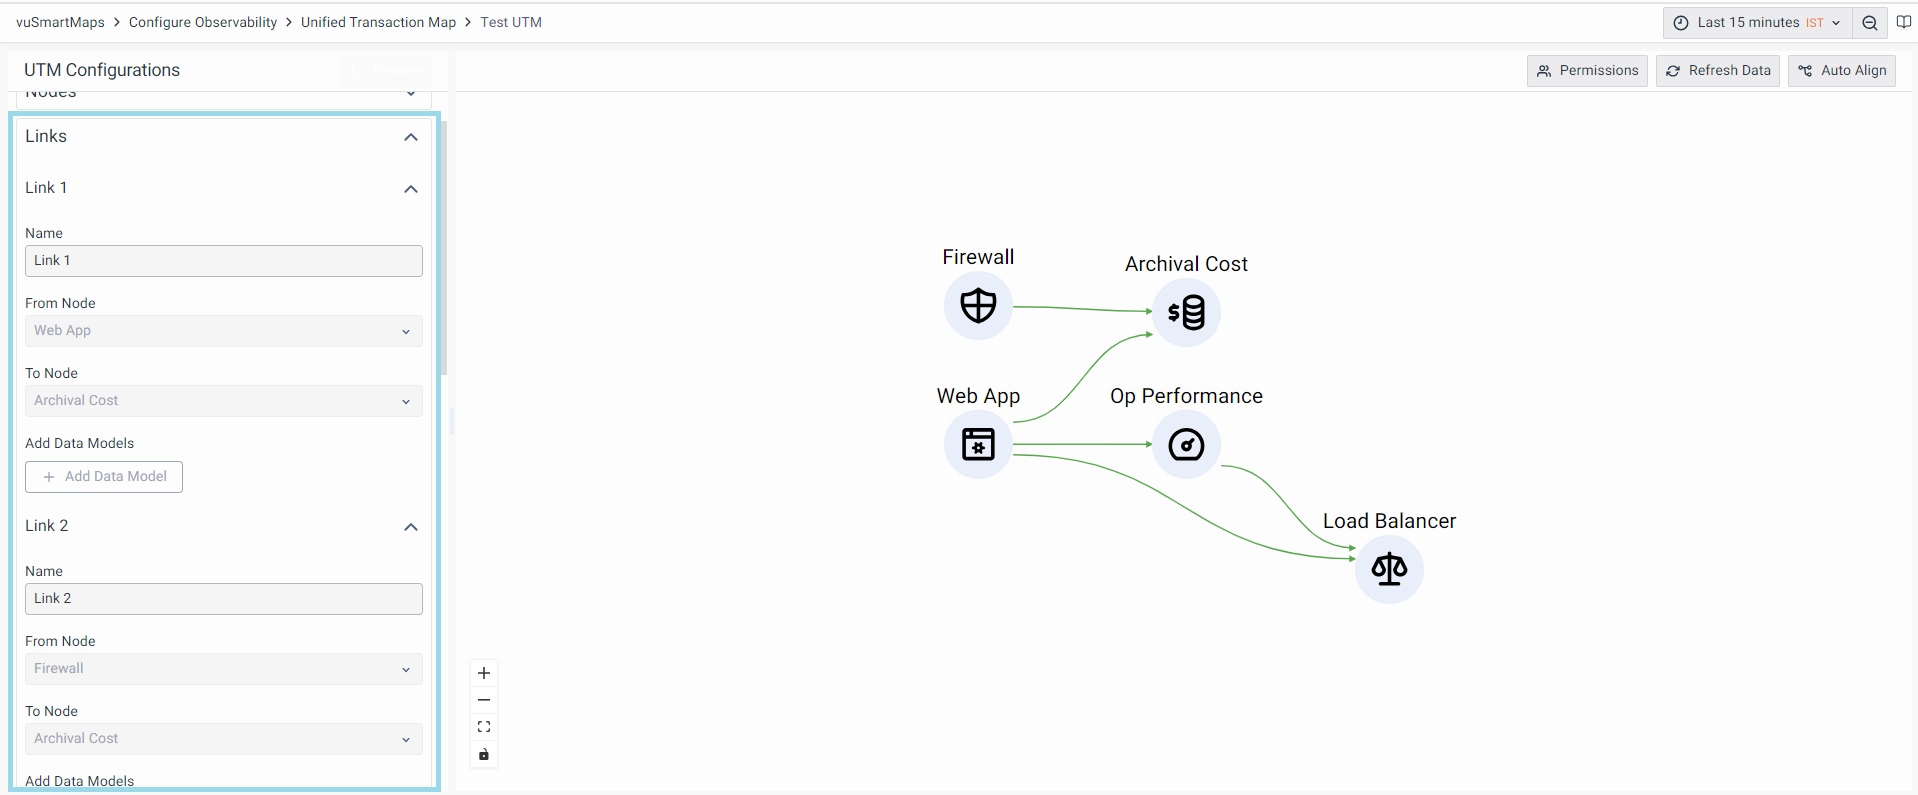
Multiple links can be created by clicking + Add Link at the bottom of the Links section.
Step 7: Click Save on the top right and provide a unique name for the UTM dashboard (maximum 50 characters).
Other Options
To change the time range and refresh the data, use the Date Time selector and Refresh button in the top right corner.
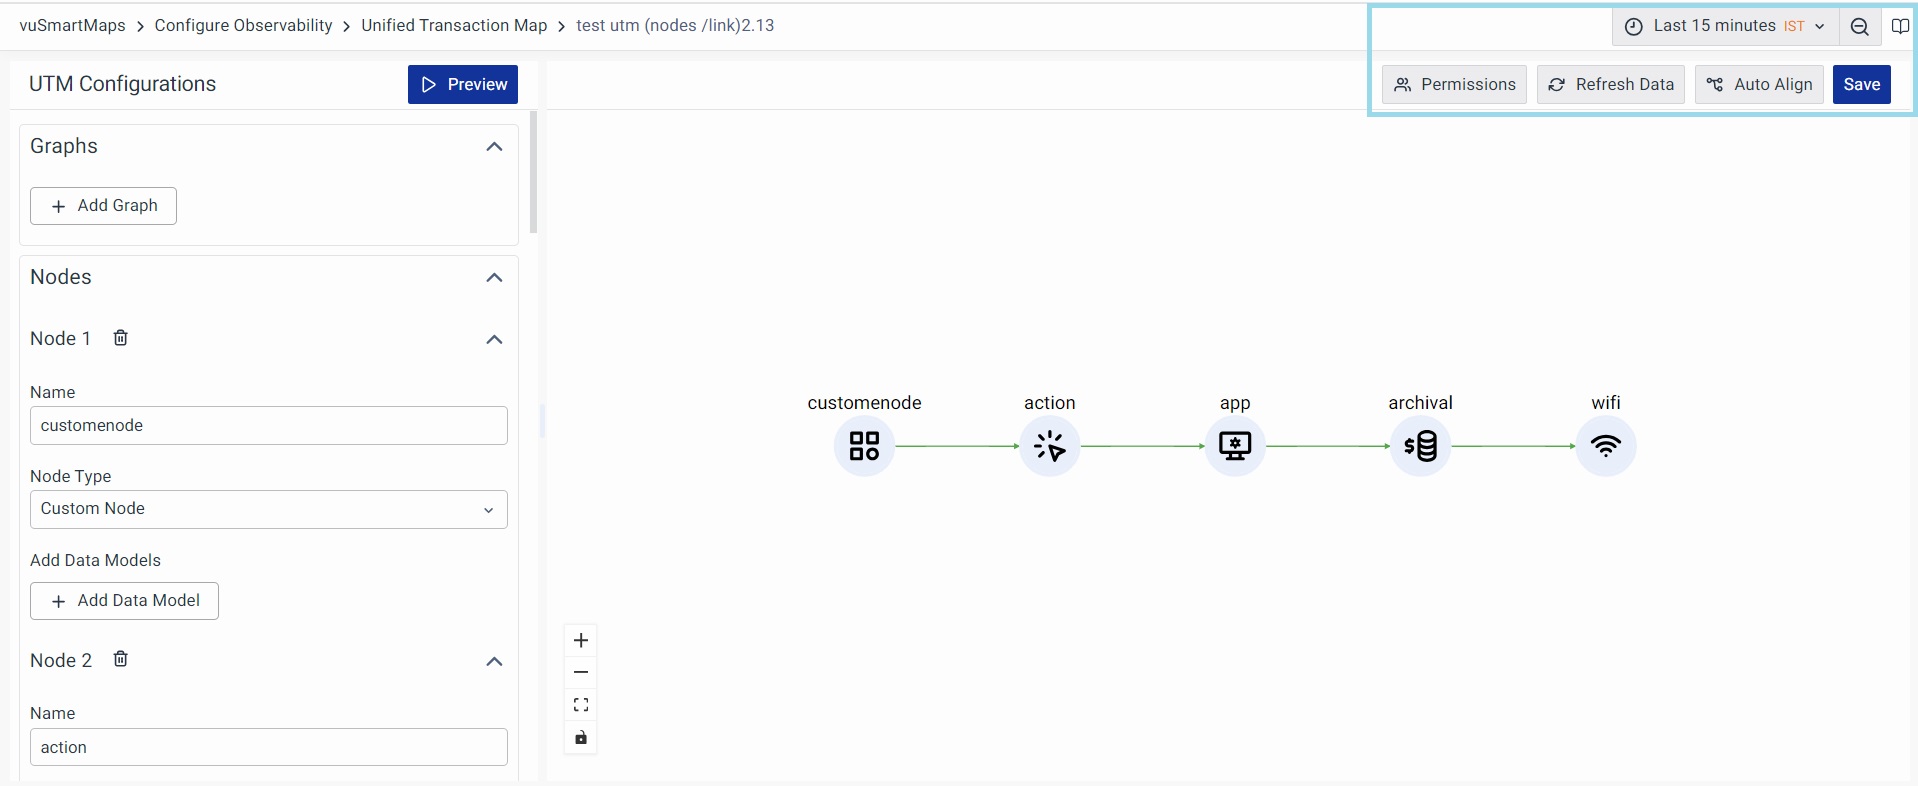
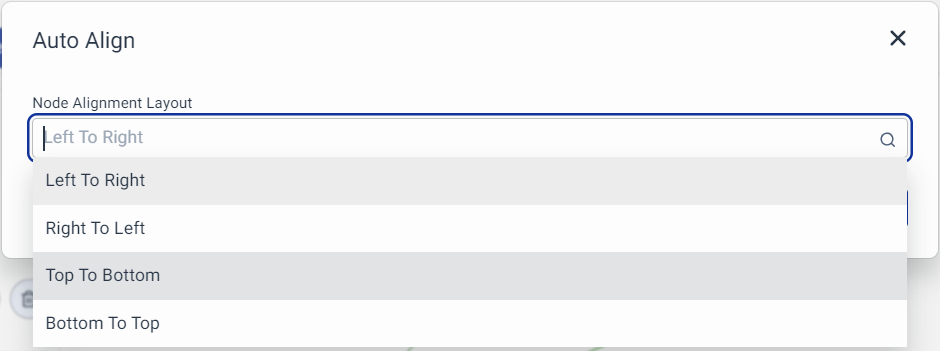
Auto Align allows users to automatically align their maps for better visualization. It supports four alignment layouts: Left to Right, Right to Left, Top to Bottom, and Bottom to Top, making it easier to organize and view service interactions.
Drag and Drop can reposition nodes. Save the updated visualization by clicking Save.
UTM Actions
You can easily perform actions on your UTM configurations on the main page. There are three main actions:
- View
- Edit
- Copy
- Delete
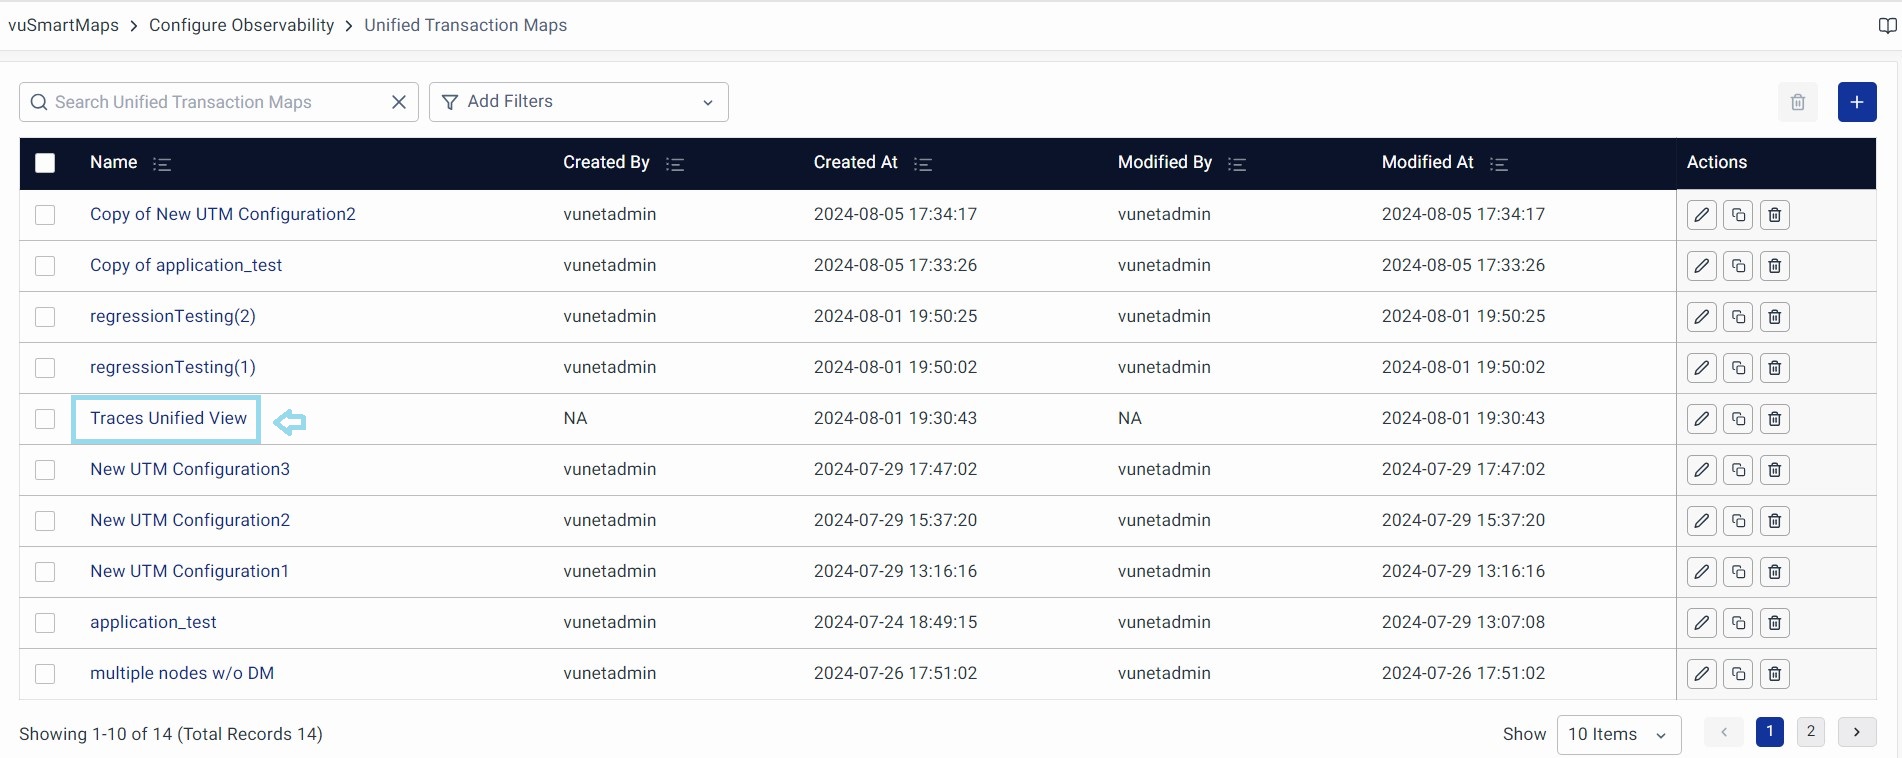
View UTM
Click the Name of UTM to view the configurations. All the names are clickable as shown below
Edit UTM
- Click the Edit button to make changes to your UTM.
- After making your edits, click Preview to see the new UTM setup.
- To finalize your changes, click Save.
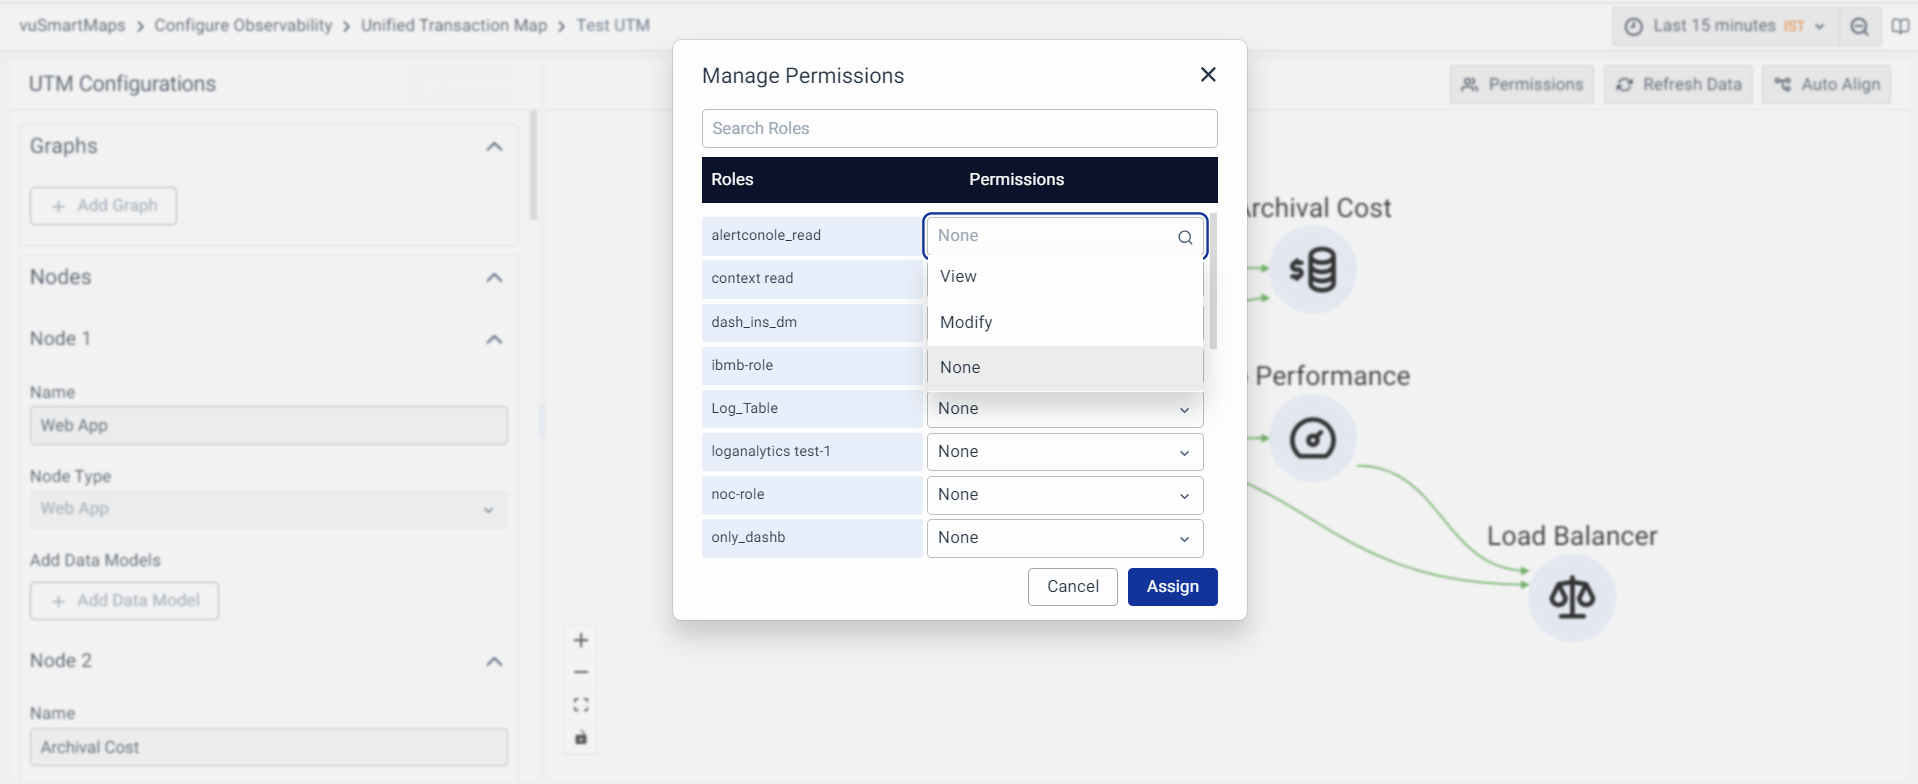
Permissions
Now, You can click on Permissions to manage Object Level Permissions in the UTM.
- Click Permissions to manage who can access and modify the UTM.
- You can assign three types of permissions for each role:
- None: No permissions.
- View: Allows viewing only.
- Modify: Grants the ability to make changes to the UTM.
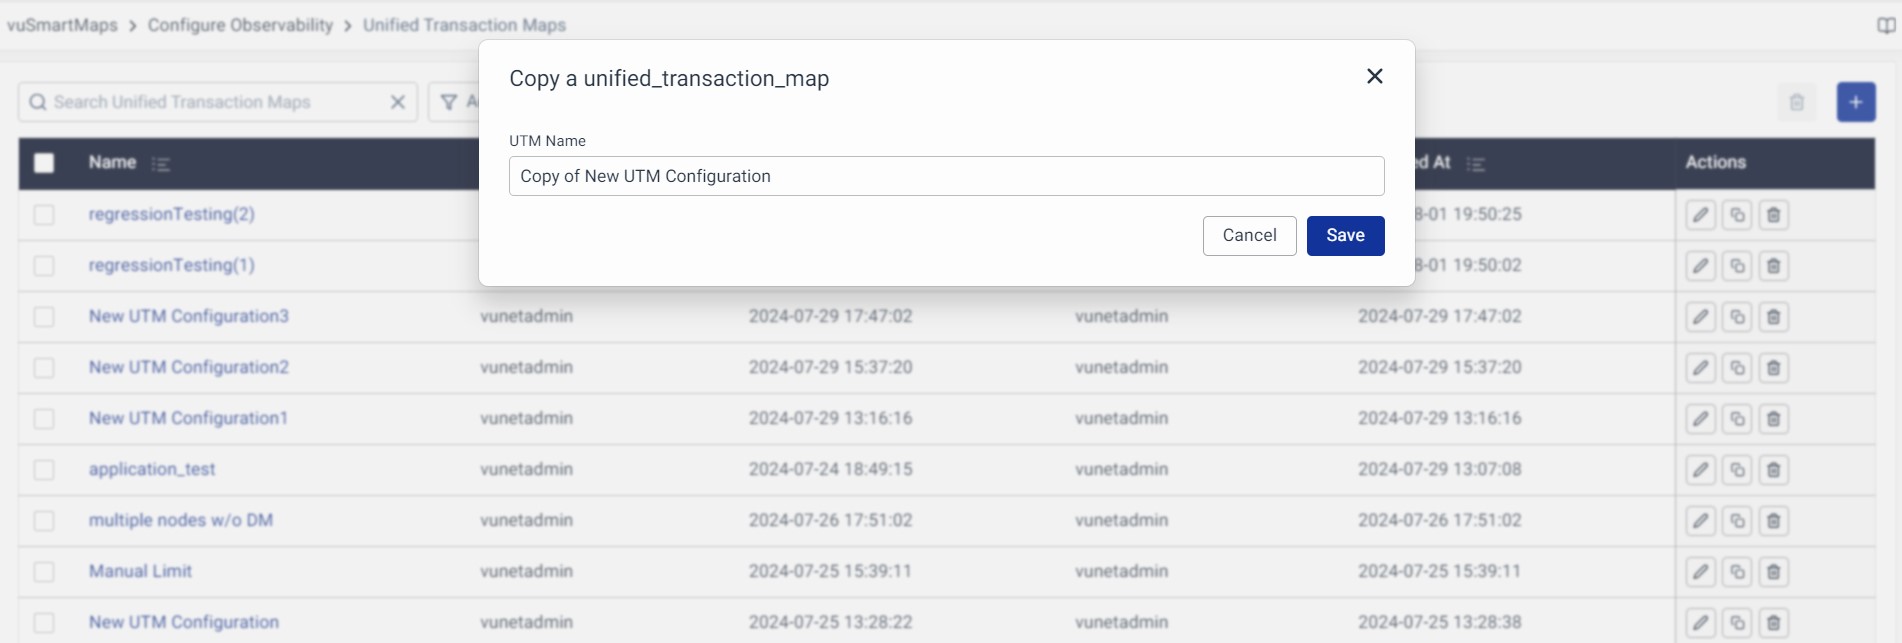
Copy UTM
Click on the Copy button to clone a UTM and Rename the cloned UTM based on the requirement.
Delete UTM
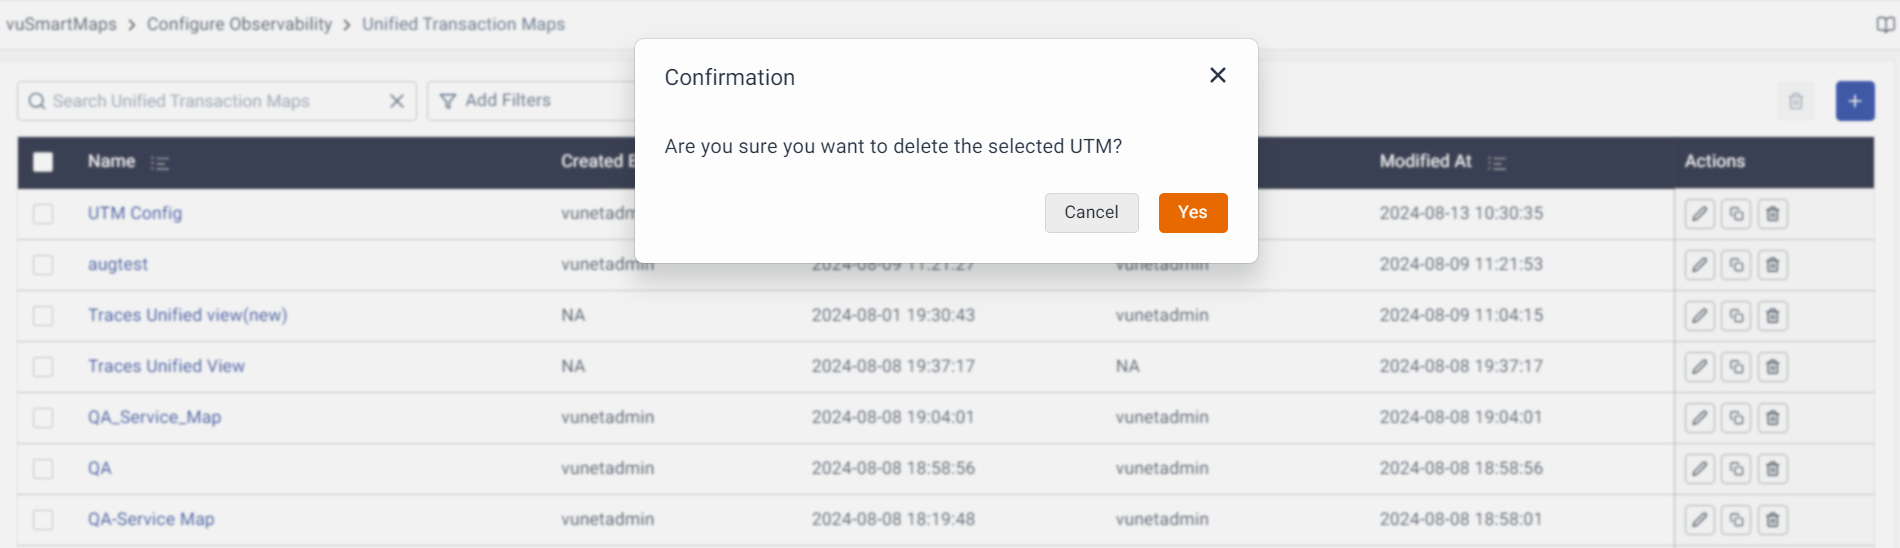
- Click Delete to remove a selected UTM.
- Confirm by clicking Yes to proceed with the deletion.
Once your UTM configuration is complete, the next step is to Configure the UTM Visualization panel on the Panel creation page.
