Log Analytics
Introduction
Log Analytics on the vuSmarMaps™ platform empowers users to explore, analyze, and visualize logs across applications, including those from various banking systems. With its intuitive interface and advanced querying capabilities, Log Analytics allows users to efficiently retrieve log data, identify trends, and gain actionable insights from vast volumes of log information.
The module optimizes log ingestion by focusing on relevant logs and leveraging data compression to primarily reduce storage costs. Additionally, it provides the flexibility to drop logs by context streams, further reducing costs and enhancing system performance. Compatible with S3 API-based object storage, Log Analytics also supports flexible object storage with the option to retrieve data on demand, ensuring that users can access historical logs whenever needed. Role-based access control (RBAC) ensures secure access, allowing only authorized users to view sensitive logs at both the dashboard and Log Analytics module levels. Log masking further enhances data privacy and compliance by concealing sensitive information in logs (refer to this section for more details on data masking).
To streamline querying, Log Analytics features Vunet Query Language (VQL), enabling users to build complex queries quickly and conduct precise, effective searches. This combination of features allows for rapid root cause analysis (RCA) within seconds, driving faster issue resolution and minimizing downtime.
From interactive visualizations to powerful search and filtering options, Log Analytics on vuSmarMaps provides a robust solution for streamlined log management, empowering teams to make informed, data-driven decisions with ease.
Getting Started
Accessing Log Analytics
- The Log Analytics page can be accessed from the platform left navigation menu by navigating to Observability -> Log Analytics.
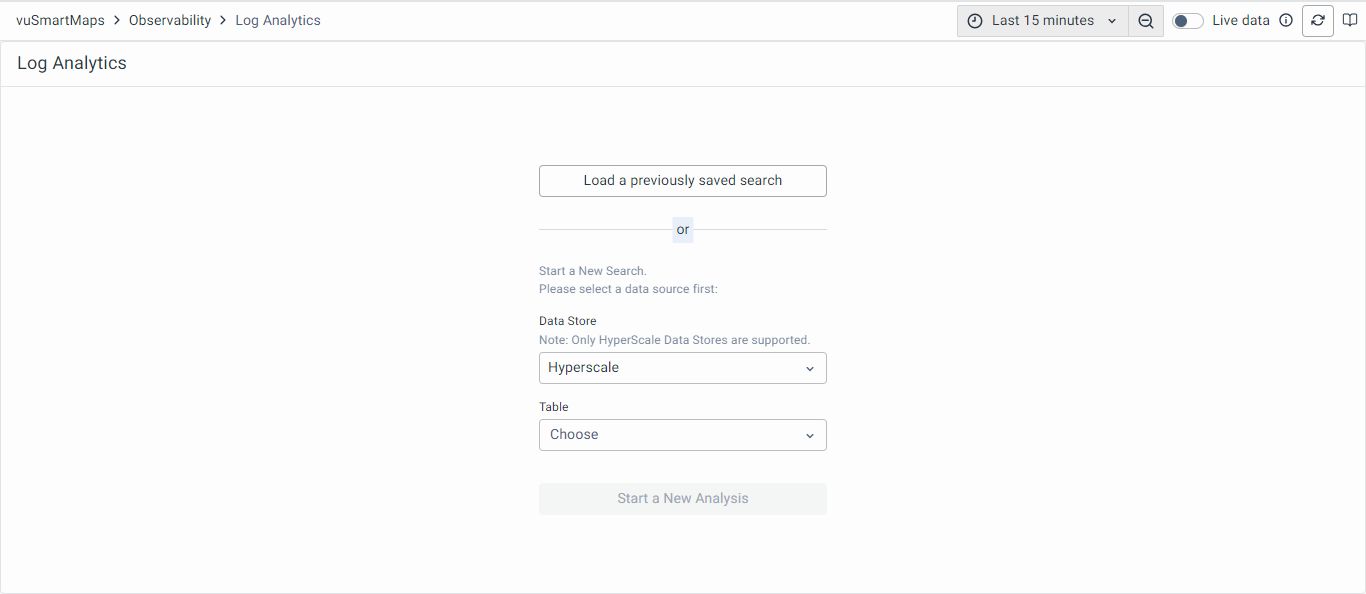
- When you click on Log Analytics, you will be directed to the following landing page.
User Interface Overview
At the landing page of log analytics, you have the provision to select Data Store and Table to start the new analysis. Hyperscale is selected as default data store.
-
Data Store allows you to choose the particular Data Store
-
Table option allows you to choose from where you want to fetch the logs.
Previously, all tables in the selected Data Store were listed on the Log Analytics page. Now, only the tables a given user has access to are displayed. For more details, refer to the User Management Guide.
The Data Stores are database connection instances configured in the data modeling workspace. Each Data Store defines a separate connection to a database instance, either internal or external, using which data analysis can be done. VuNet’s HyperScale database instances are the only types of Data Stores supported for log analytics. The default internal HyperScale Data Store instance will be available in all systems for use in log analytics.
Once the Data Store and Table are selected, the log analytics module provides a listing of matching logs for the time selected, without any other filters.
To ensure the table appears in the Log Analytics table listing, it must contain the following fields: timestamp, message, log_uuid, and message_lower.
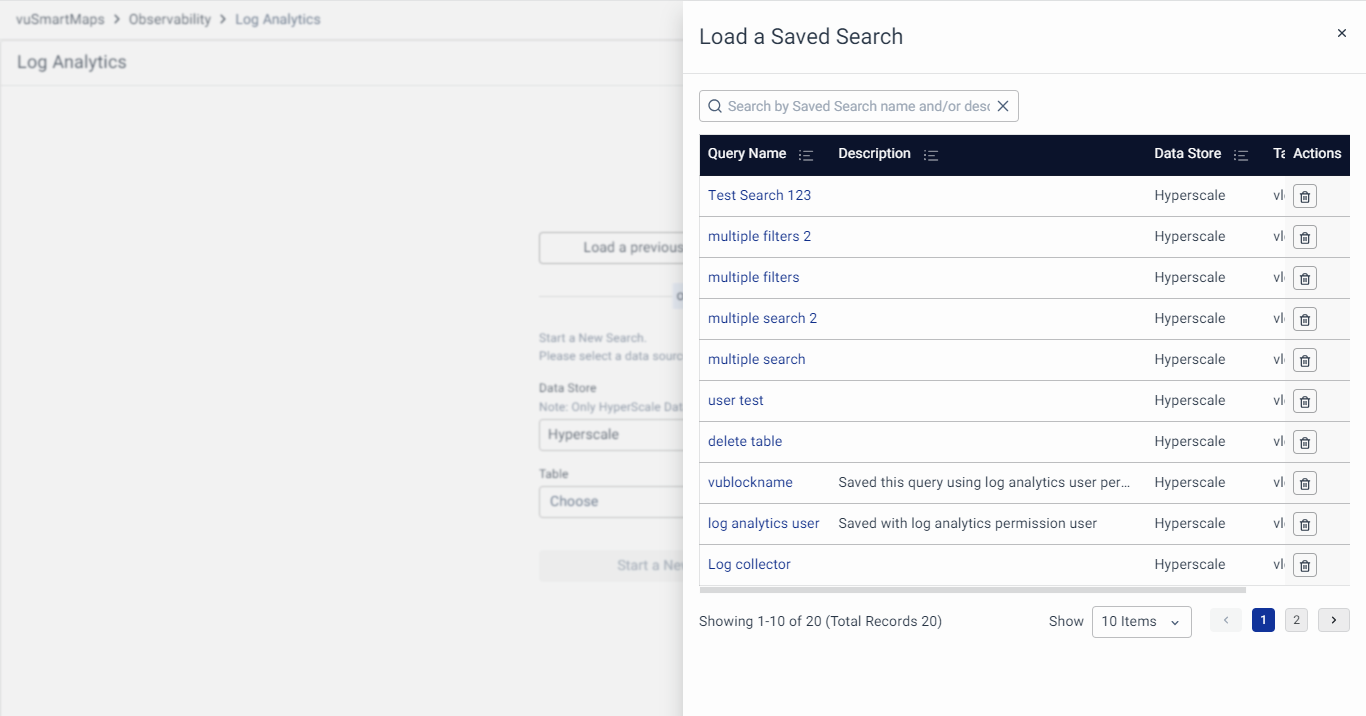
- Conversely, you have an option to load the previously saved search.
- Once the Data Store and Table are selected you will be landed on the following page.
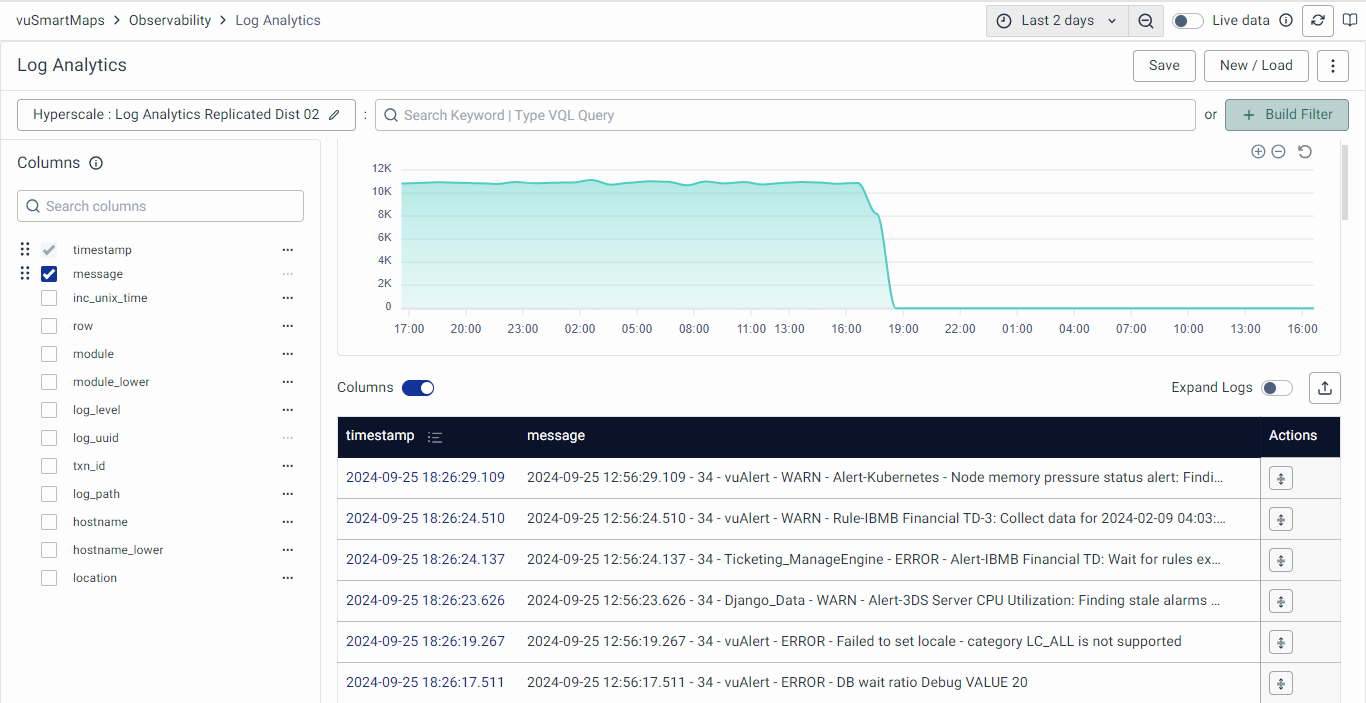
- If you want to change the selected data store and table, click on the currently selected data store at the top left.

- You will be redirected to the page where you selected the Data Store and Table. Now, make the desired selections and click the Start a New Analysis button.
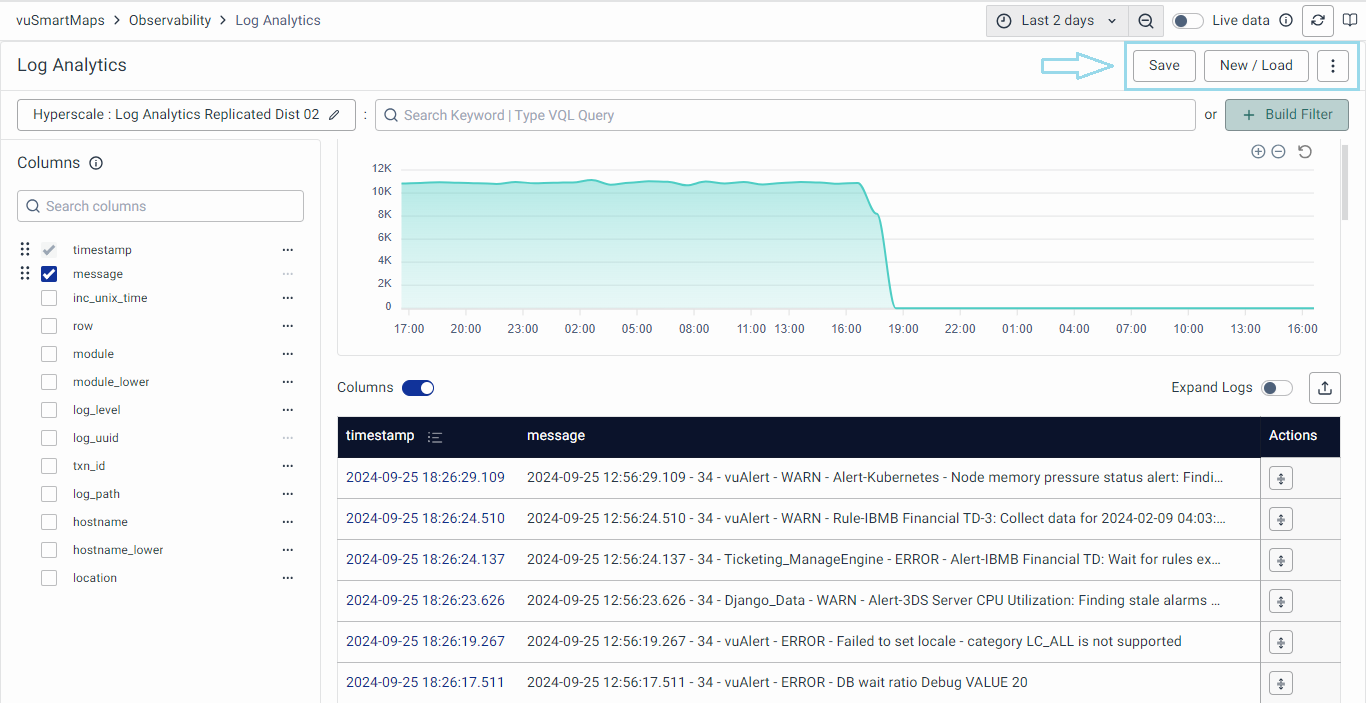
- At the top right corner, you’ll find the global time selector, allowing you to gain insight into the logs at a specific time range selected.
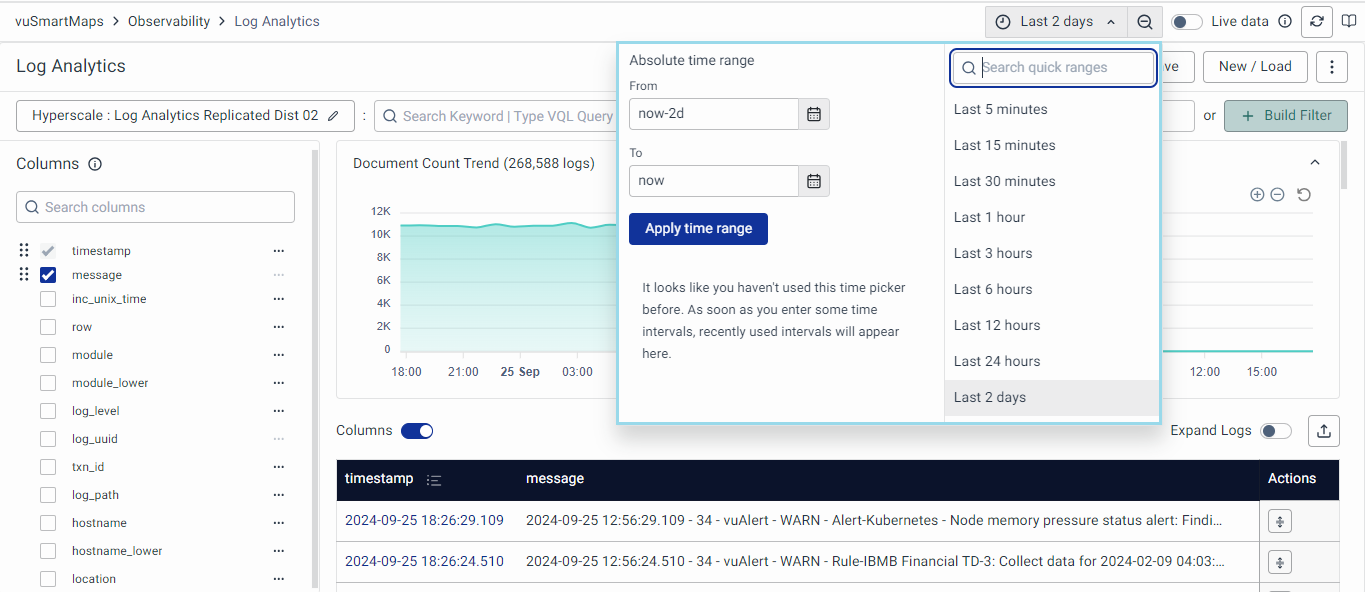
- Besides the time filter, there's a Live data toggle button that, when enabled, provides the user with the real-time display of the most recent 500 records from the last five minutes, automatically refreshing every 10 seconds.
- The refresh button beside the Live data toggle enables data refresh, and the User Guide tab redirects you to the Log Analytics User Guide.
Below are the action buttons, each serving a specific purpose:
- Save: Clicking the button opens a context menu with two options. For new search, the Save option is disabled; you need to use ‘Save as’. For a saved search, use ‘Save’. In an already saved search, ‘Save As’ functions like a clone.
- New/Load: This button allows you to initiate a new search or access previously saved searches.
- More Actions: Here, users can grant permissions on saved searches.
-
The search query field allows you to input VQL-based text queries to retrieve specific logs from the Table.
-
Clicking the VQL button on the search bar opens the VQL help section documentation in a new tab.
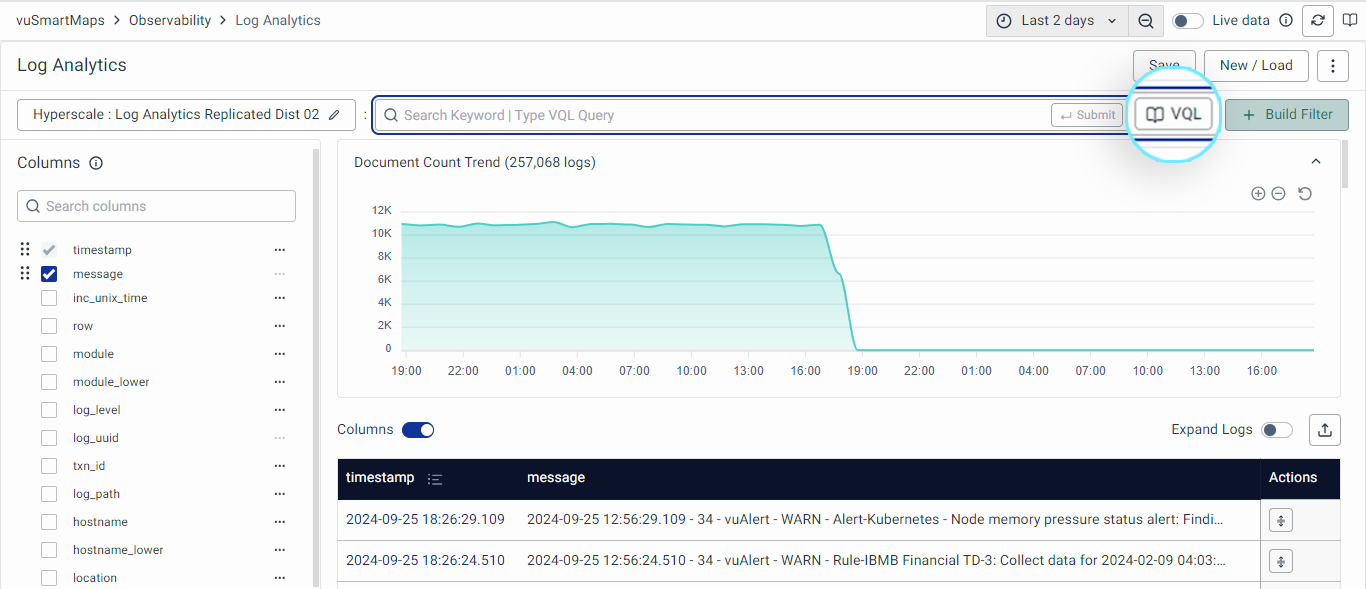
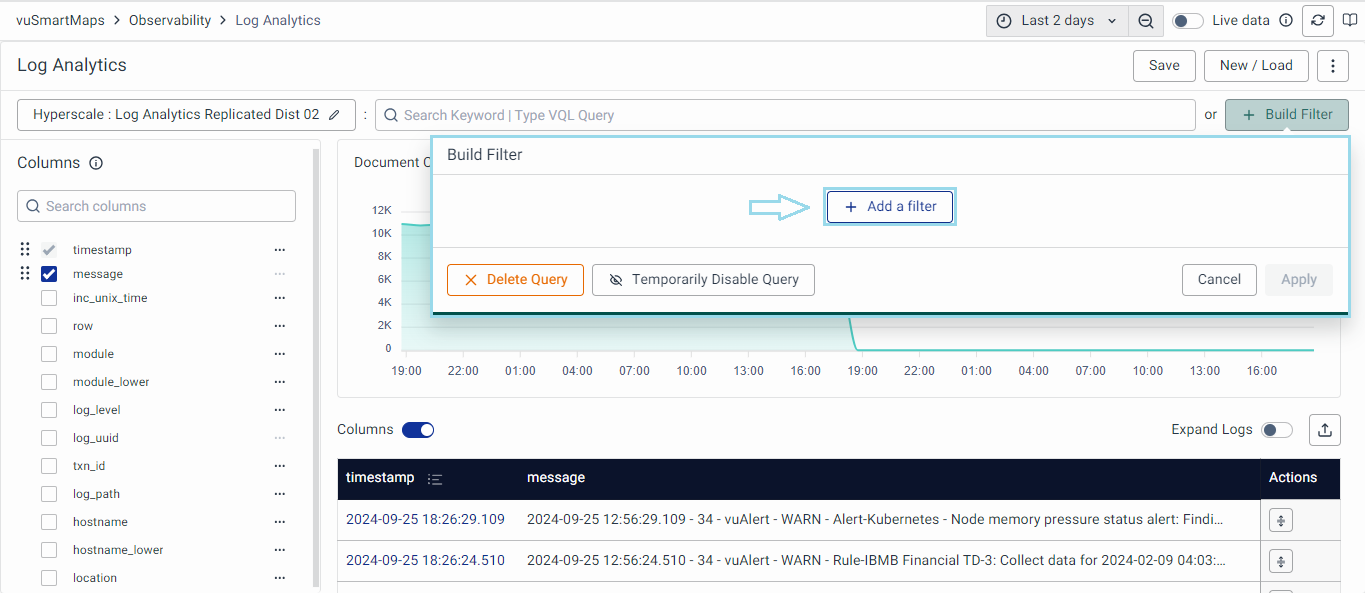
-
The Build Filter option located next to the search box allows you to add filters. By clicking 'Add Filter,' you can select columns and operators to filter out specific logs in the table.
- The Columns option on the left enables you to choose which columns are displayed in the Table. By default, the ‘timestamp’ and ‘message’ fields are selected on the Table.
Column options may vary depending on the Data Store and selected Table. A maximum of twenty-five columns can be selected at a time.
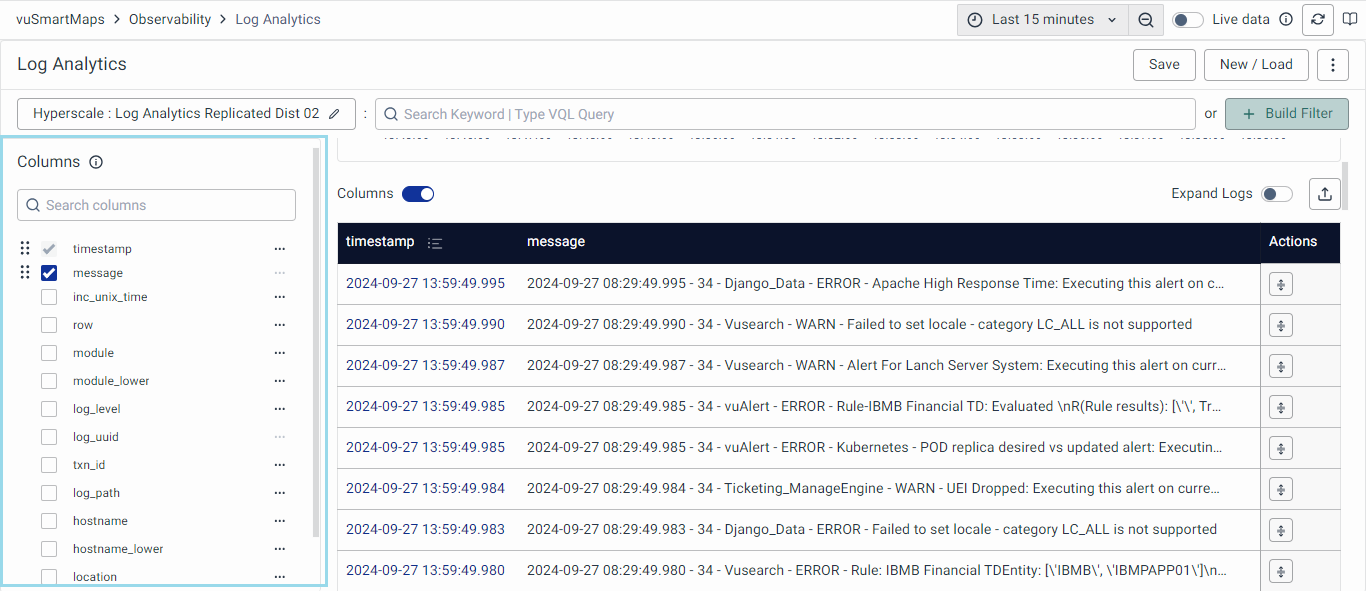
On the right-hand side, the area chart and log table are displayed based on the selected Data Store, Table, and time range. This enables you to visualize trends and analyze log data precisely tailored to the chosen parameters, enhancing the effectiveness of the data exploration and analysis within the platform.
For further details on how to effectively analyze and visualize log data, refer to the Exploring Log Data page.
