Creating a New Report
Introduction
-
To access Report Builder, Navigate from the left navigation menu
Configure Observability > Report Builder -
All Reports created by the admin will be listed under the Report Builder. This functionality allows you to generate reports; for instance, generating a Long term data storage report is accessible via the report builder.
-
The following fields will be displayed.
- Name: This field displays the name of the report.
- Status: This indicates whether the report is currently active or inactive.
- Schedule: If applicable, this field will display the frequency at which the report is set to generate (e.g., weekly, daily, or monthly). Additionally, it will indicate the specific time if the report has been initiated to generate either periodically or as a one-time scheduled report. Administrators can configure this.
- Created At: Shows the date and time when the report was first created.
- Modified At: Indicates the date and time of the most recent modification.
- Actions: There are three action buttons under this.
- Edit: Modify the report, manage permissions, or make copies.
- Delete: Delete the respective report.
- Preview and Generate Reports: This allows you to preview and generate reports.
In addition, there are other options available at the top of the table
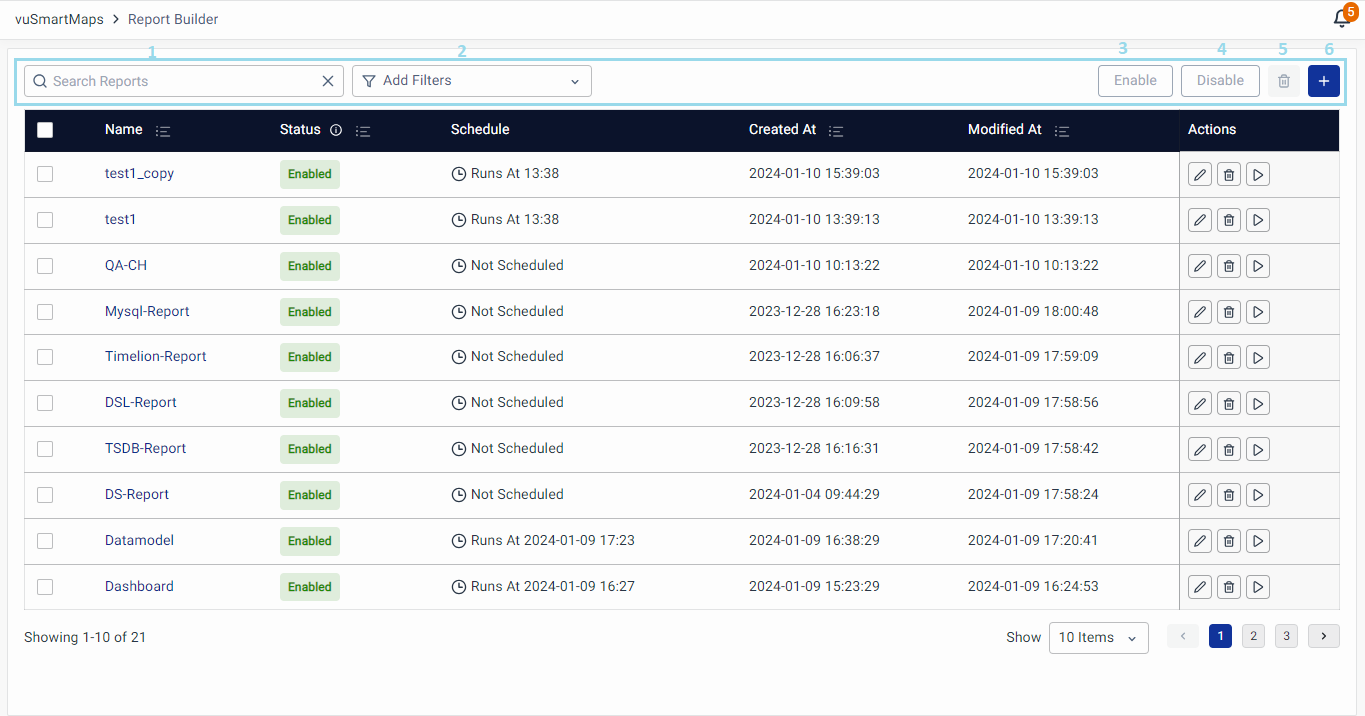
- Search Box: Users can locate a specific report by entering its name into the search box.
- Add Filters: Users can perform searches by applying filters, including Name, Status, Created at, and Modified at. Multiple filters can be applied simultaneously.
- Enable: To enable a report, select its checkbox, which activates the 'Enable' button. Click Enable to make the report accessible for users to generate. You can enable multiple reports simultaneously.
- Disable: To disable a report, select its checkbox, which activates the 'Disable' button. Click Disable. Disabled reports are not available for users to generate reports. You can disable multiple reports simultaneously.
- Delete: Check the report's checkbox, then click Delete. You can delete multiple reports together.
- + Create New Report: This button will enable the users to create a new Report.
Creating New Report
To create a report:
- Click on the + button (Create New Report).
- On clicking, you will be redirected to the following page.
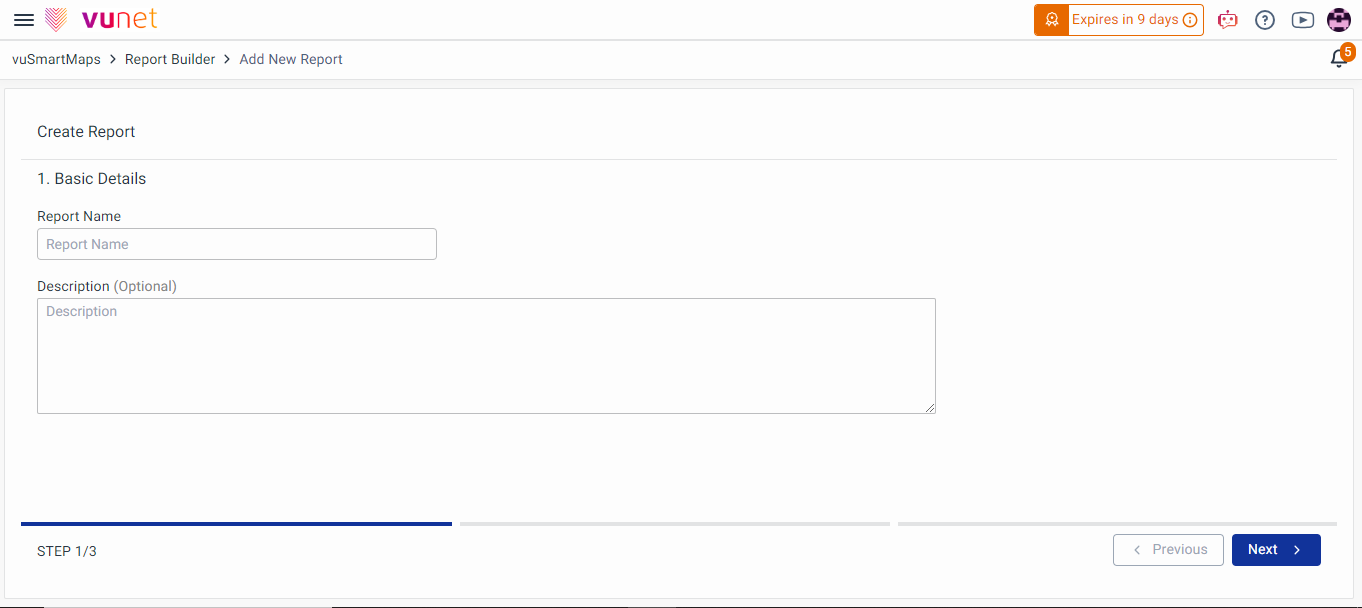
Creating a Report consists of three steps:
Step 1: Basic Details
Step 2: Manage Report Contents
Step 3: Schedule to Generate and Distribute
Step 1: Basic Details
Enter the following details and click on the next tab
- Name of the Report
- Description (Optional)
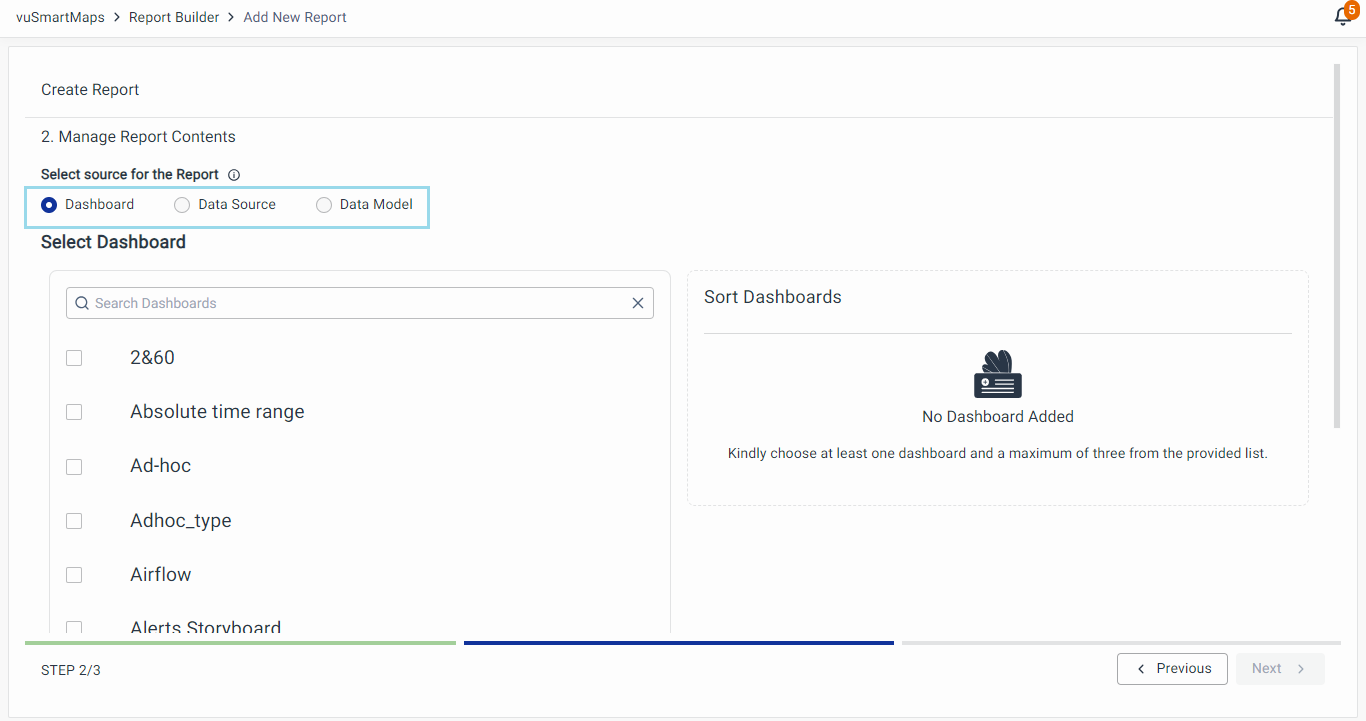
Step 2: Manage Report Contents
This section has 3 tabs to select the source of the Report. The following are the sources:
- Dashboard
- Data Source
- Data Model
Only one source can be chosen at a time for generating reports.
Now, let’s generate the reports using each of these sources.
Dashboard
- Pick the dashboard you need for making reports.
- To create reports from a dashboard, tick the checkbox next to its name.
- The chosen dashboard appears on the right in the 'Sort Dashboard' section.
- You can arrange the order of dashboards there.

You can select up to 3 dashboards at once for generating reports. To replace a selected dashboard, click delete which is located on the right of the 'Sort Dashboard' section and then proceed with your desired selections.
Time Filter
From the Time Filter option, set the exact time range for the reports you want to generate.
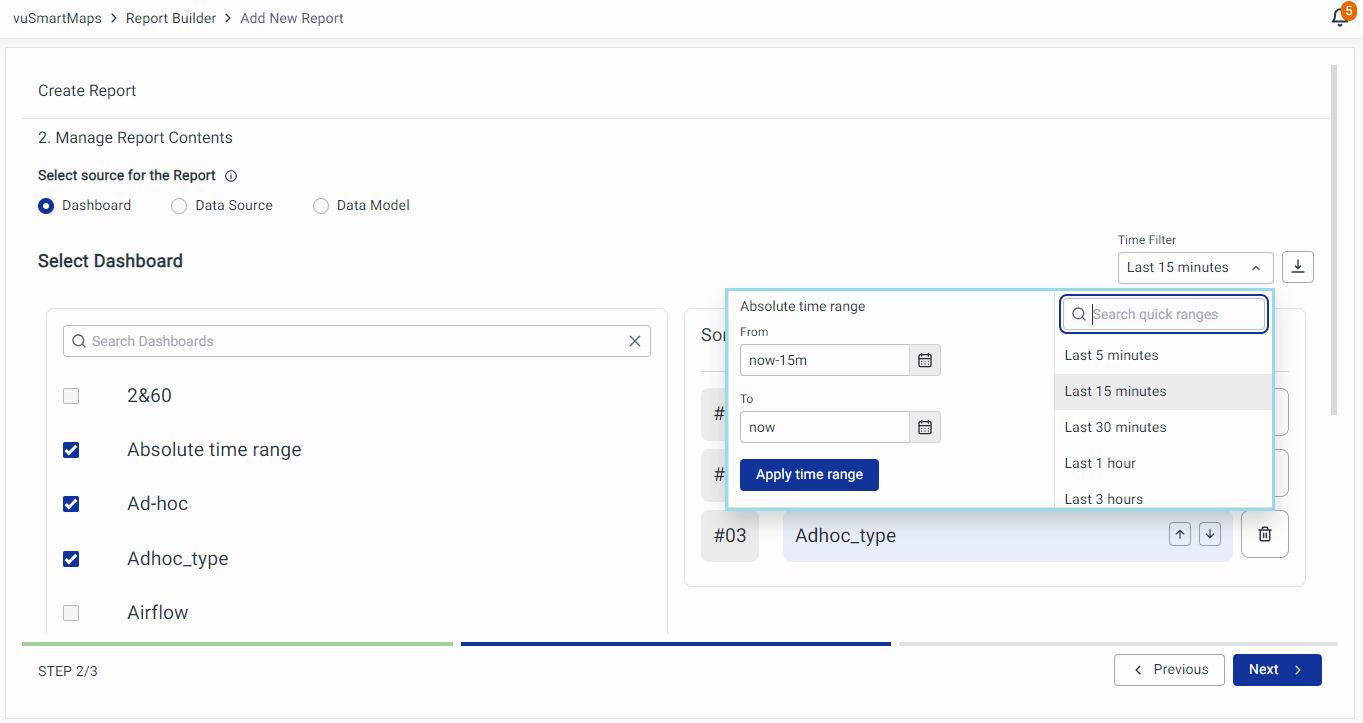
- Additionally, you can download the instant reports. Just click the Download button located next to the Time Filter option to get the report.
- When you click Download, the report will be downloaded directly to your local system from the user interface.
- Now, let's create the Reports using the Data Source.
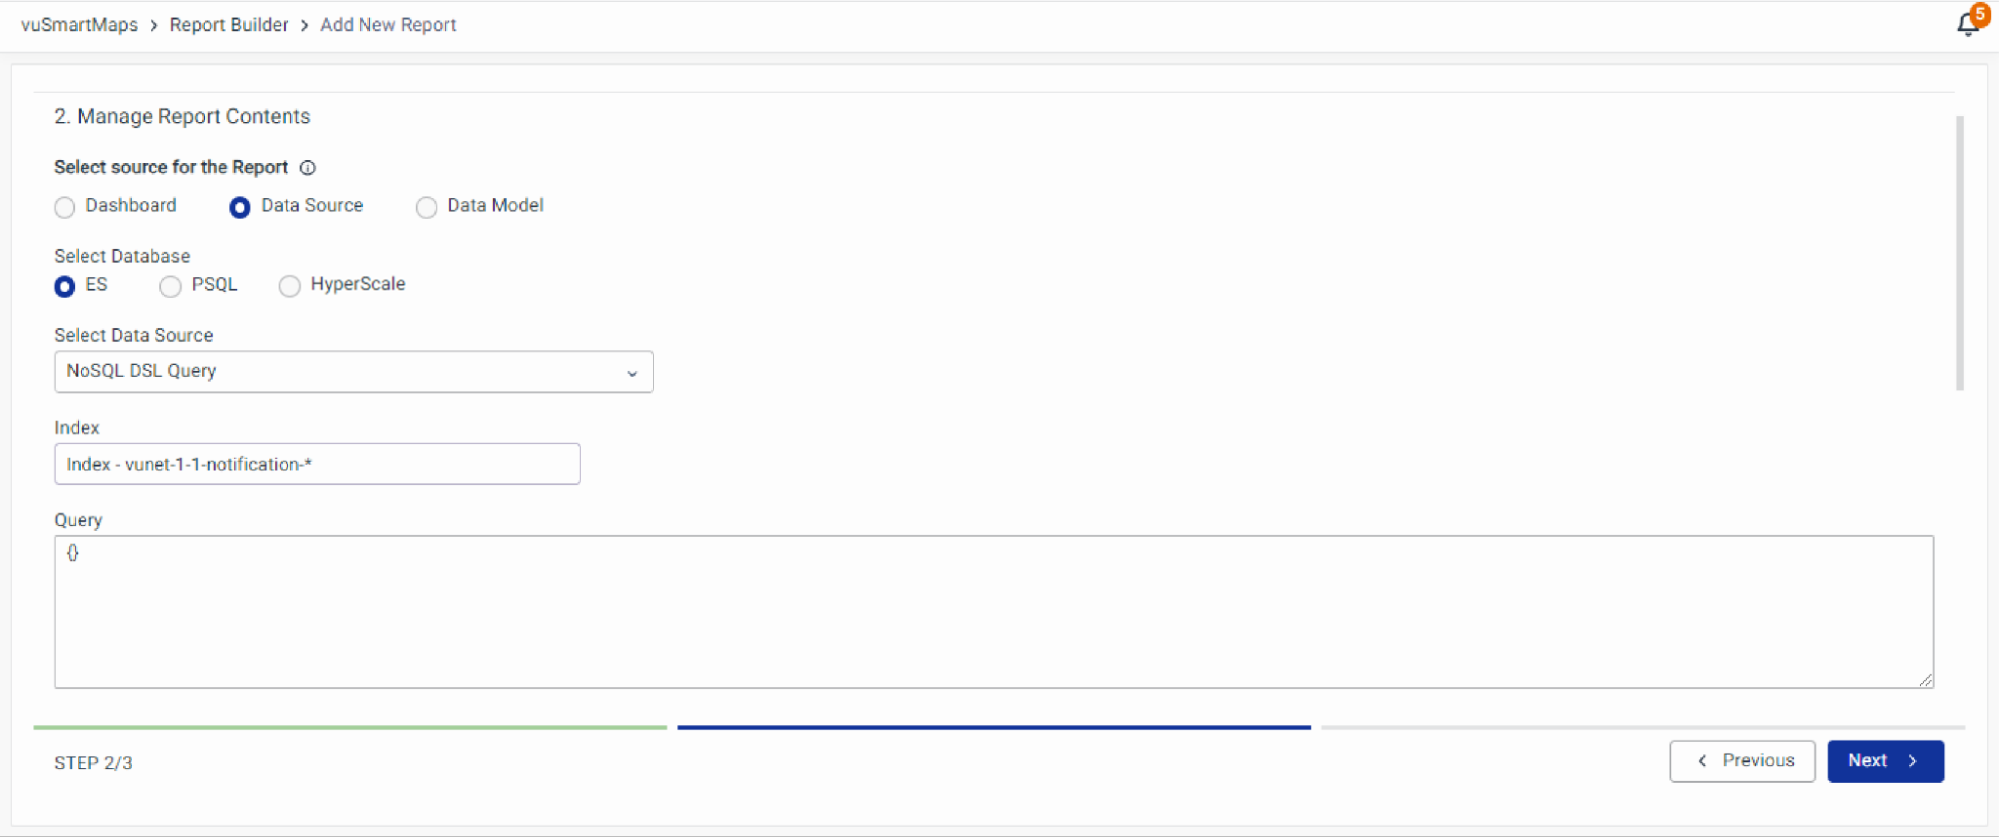
Data Source
Before selecting the data source, select the Database:
- ES
- PSQL
- Hyperscale
The following are the supported data sources:
Es contain:
- NoSQL DSL query
- NoSQL Timelion query
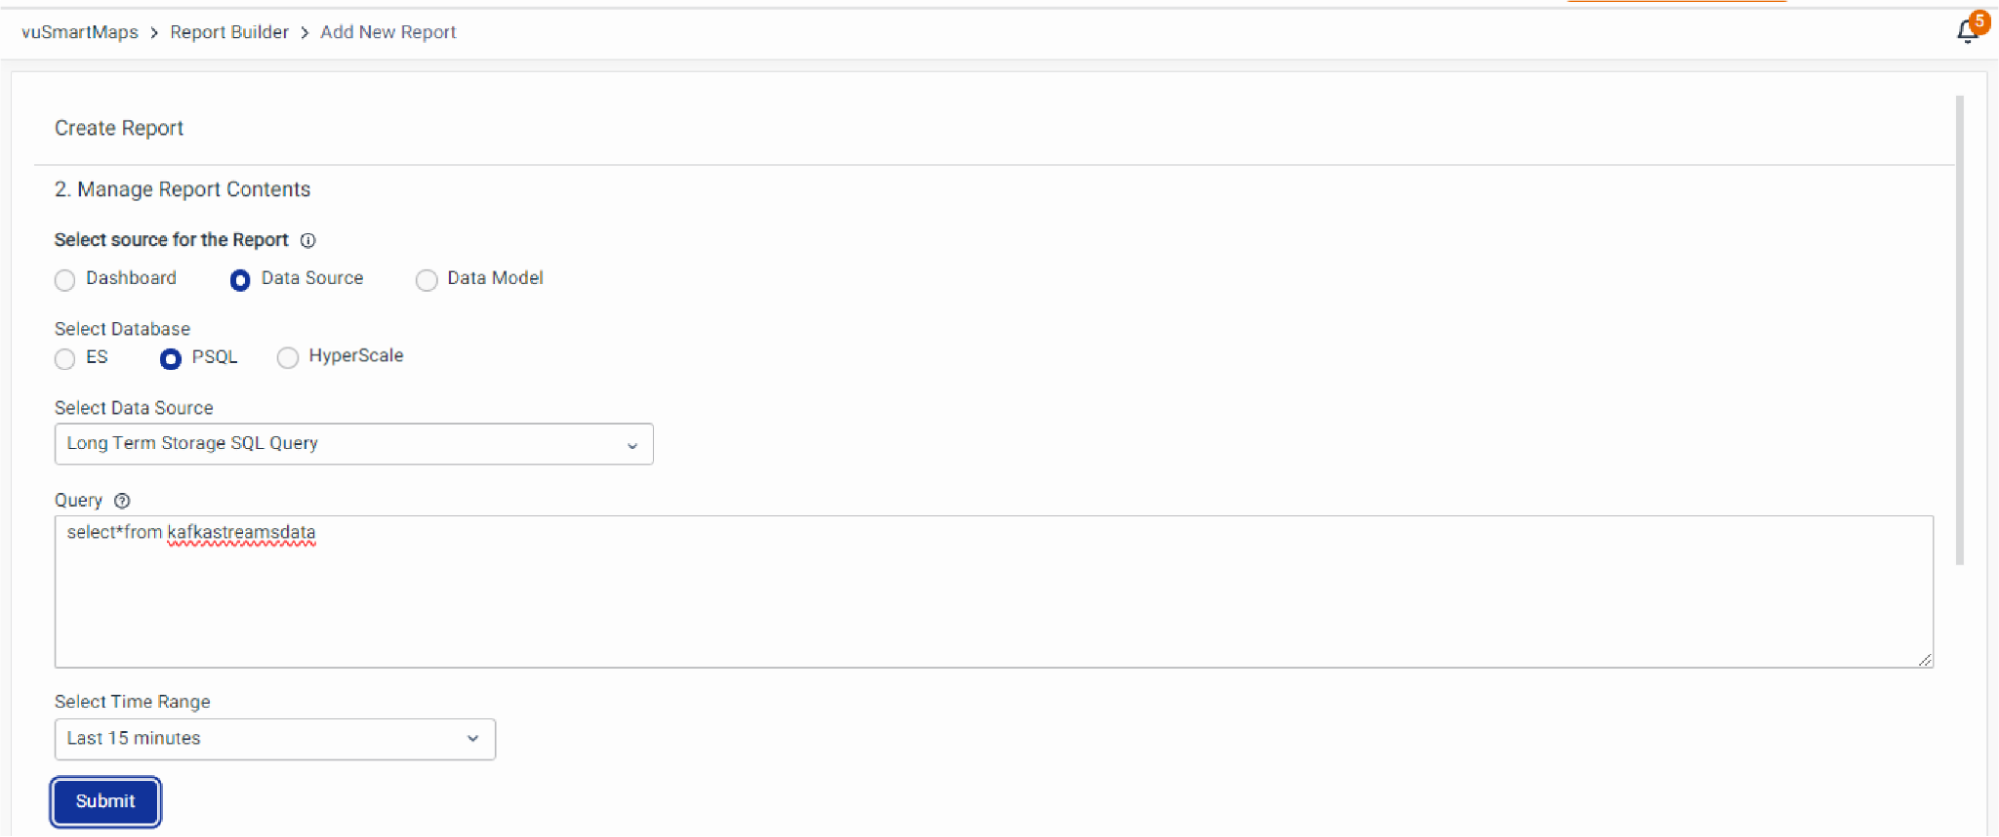
PSQL contains:
- Internal Storage SQL query
- Long-Term Storage SQL query
ES Database
- NoSQL Timelion Query
The user can provide the ES Timelion query in the ES Query. 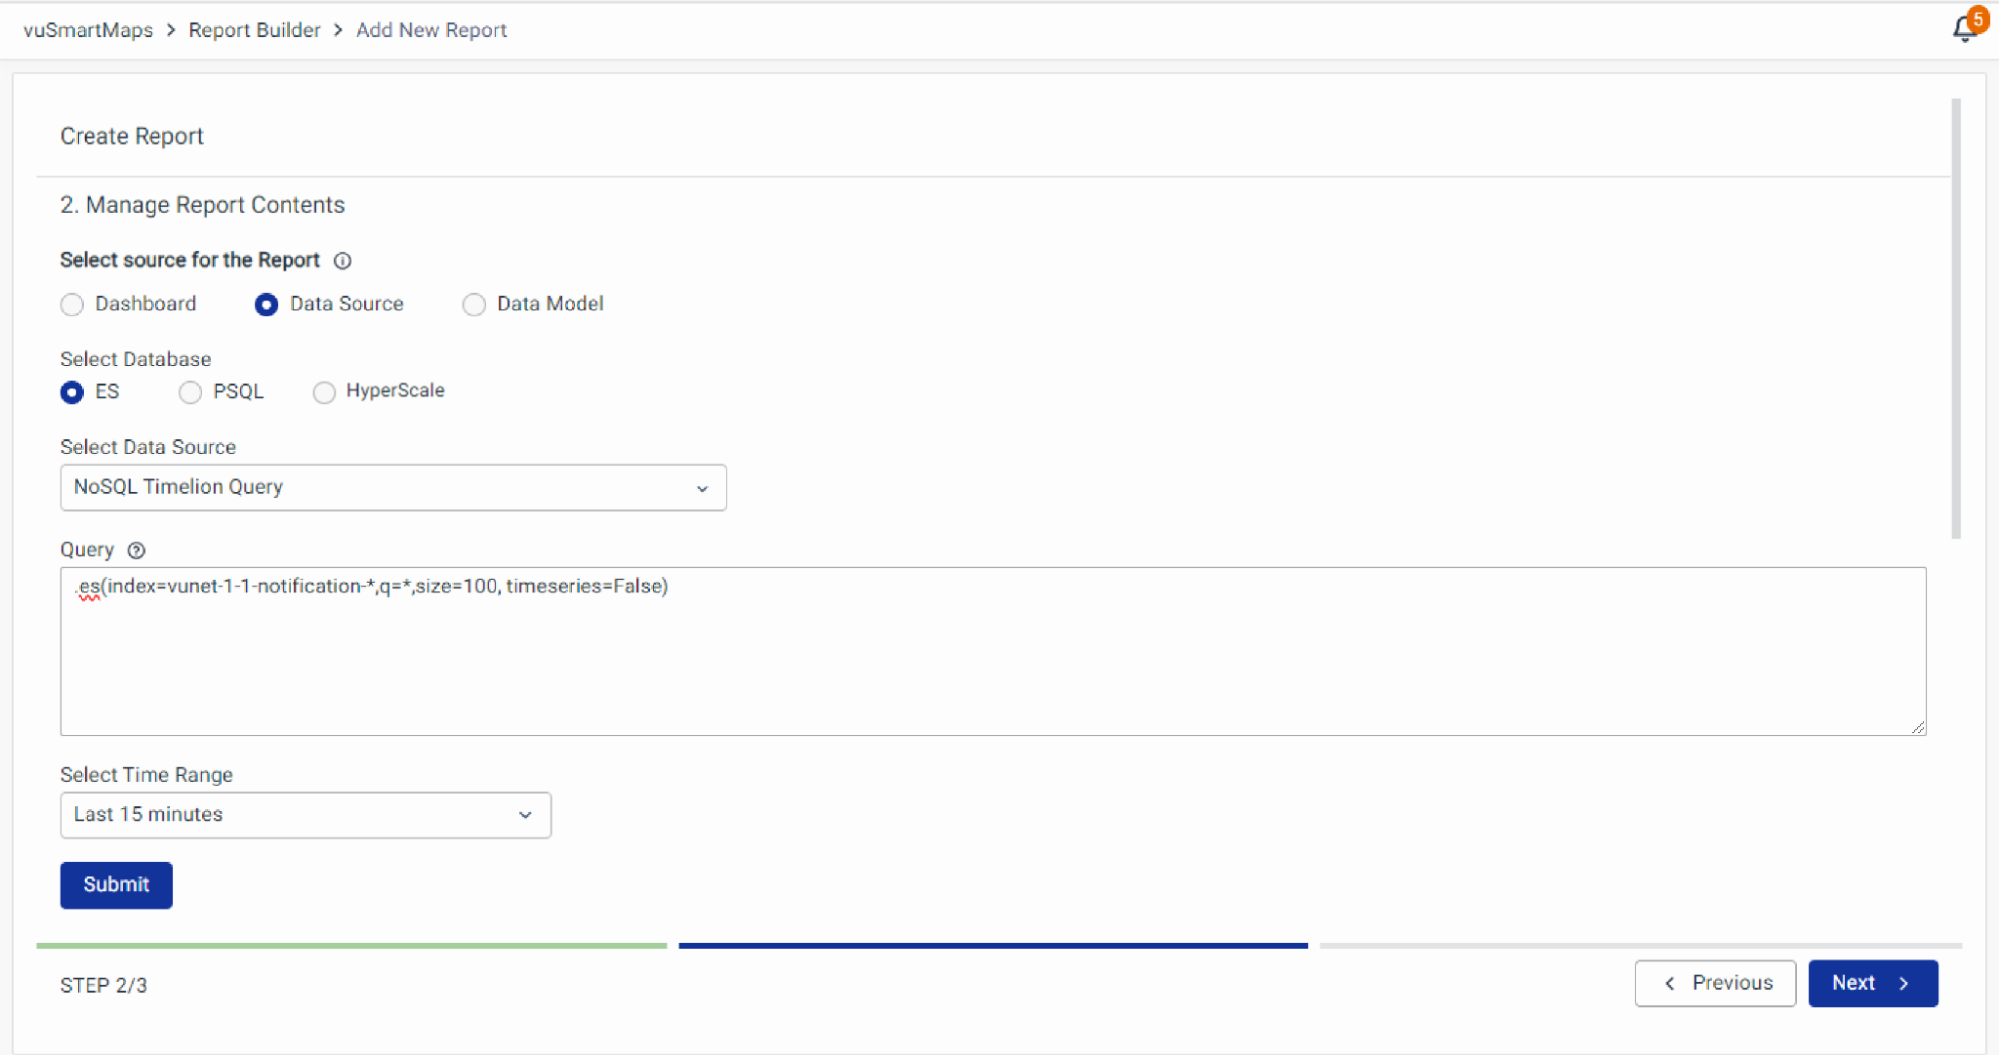
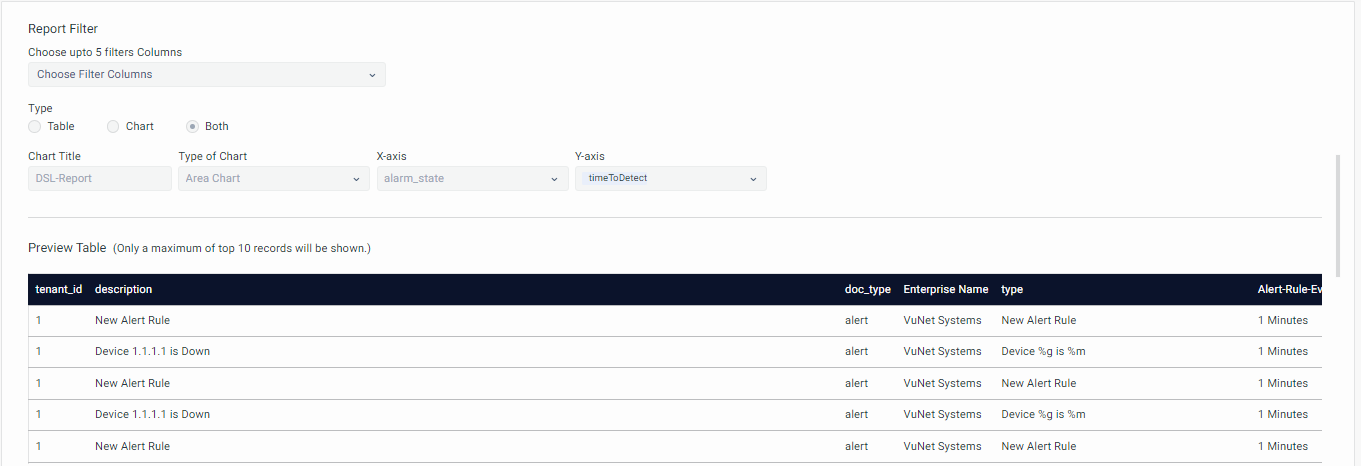
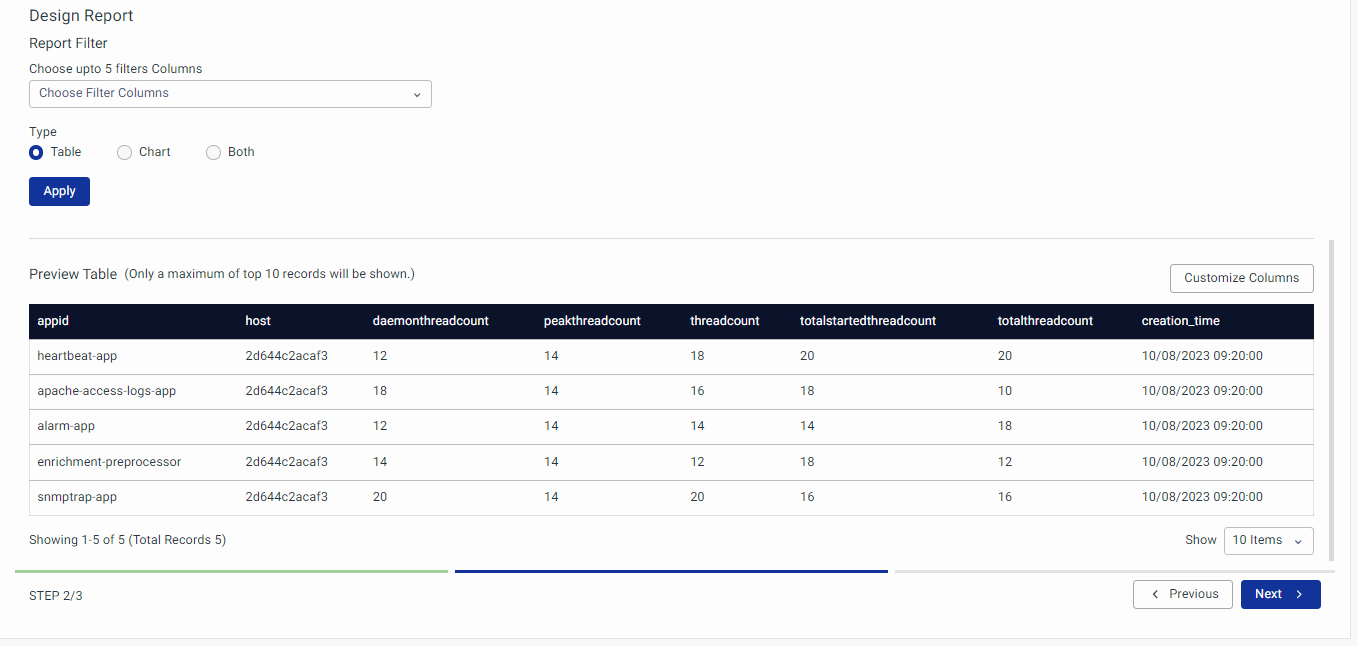
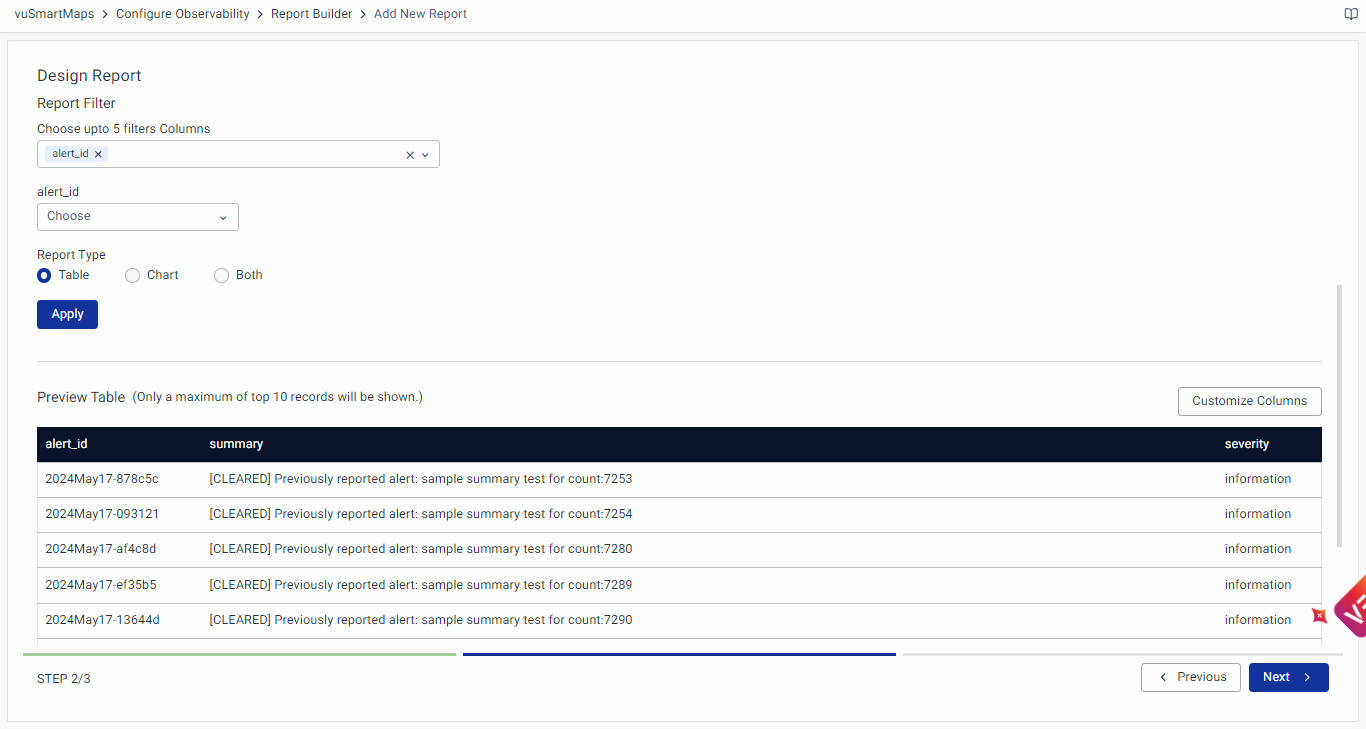
Design the Report by choosing a column filter, this is used to select the column you would like to display on the generated report, corresponding change will be shown in the table. You can choose up to five filters. 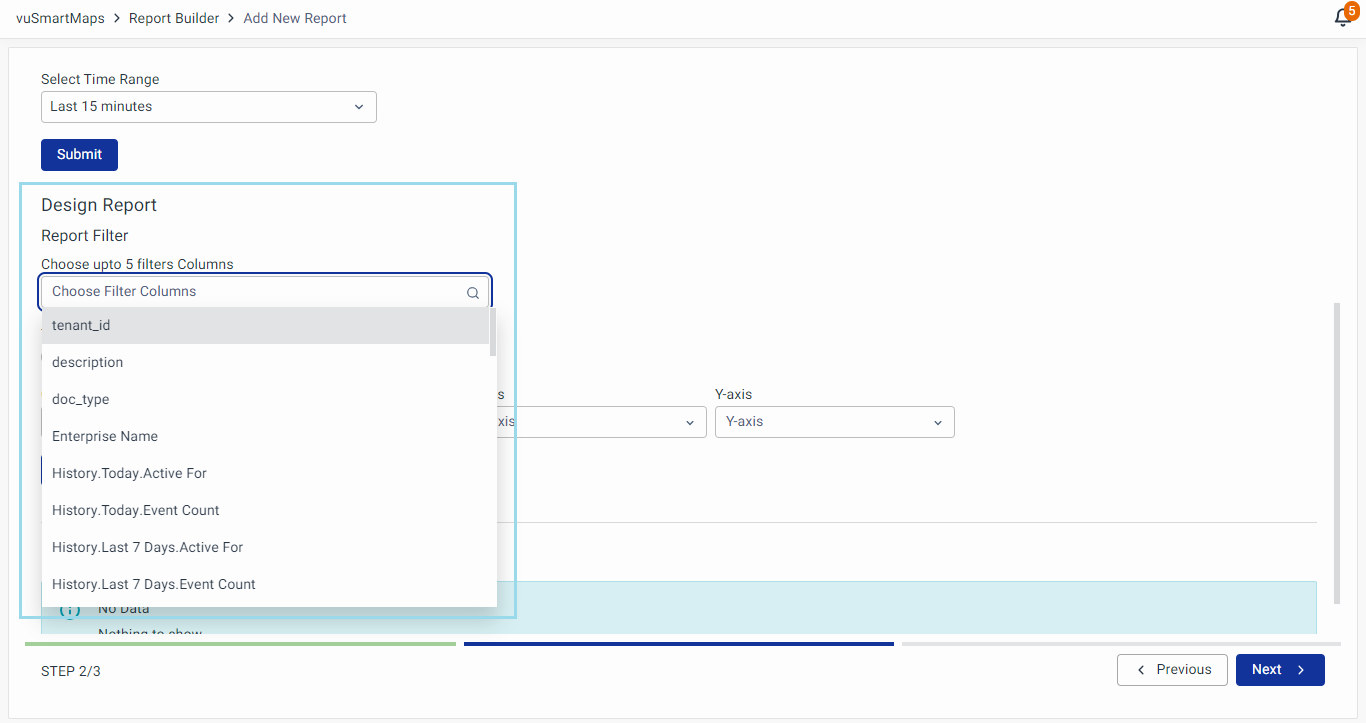
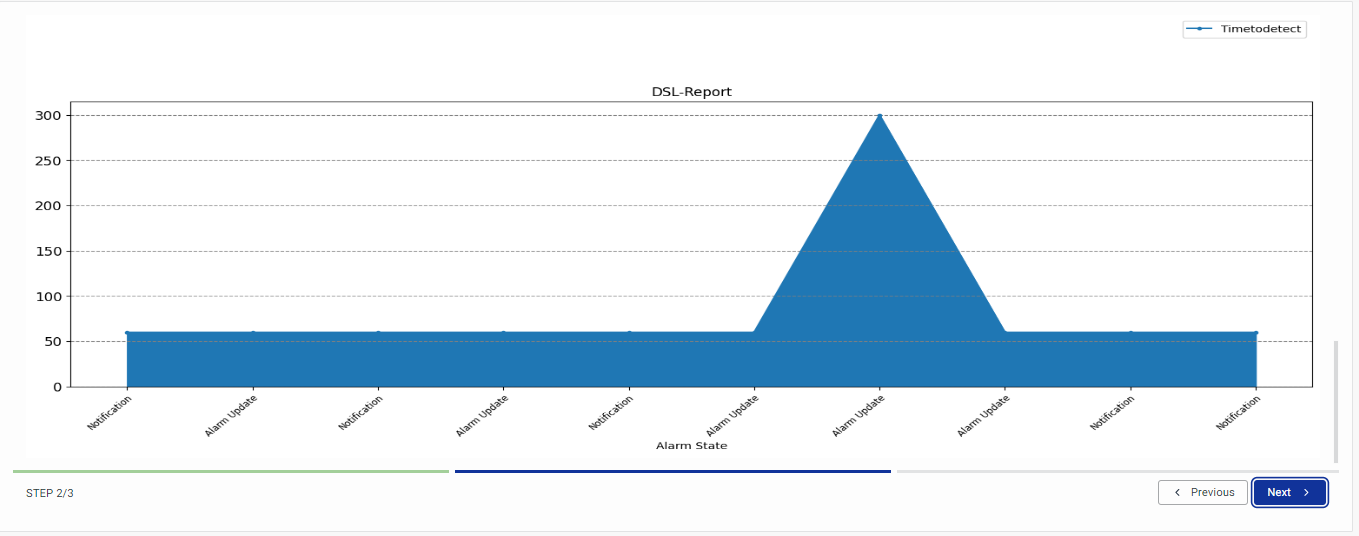
Select the type of report as Table, Chart, or Both. In the case of a Chart, choose the chart type from Line Chart, Vertical Bar Chart, and Area Chart, along with specifying the field you want to represent on the X and Y axes, respectively.
Only numerical values are available under the Y-axis.
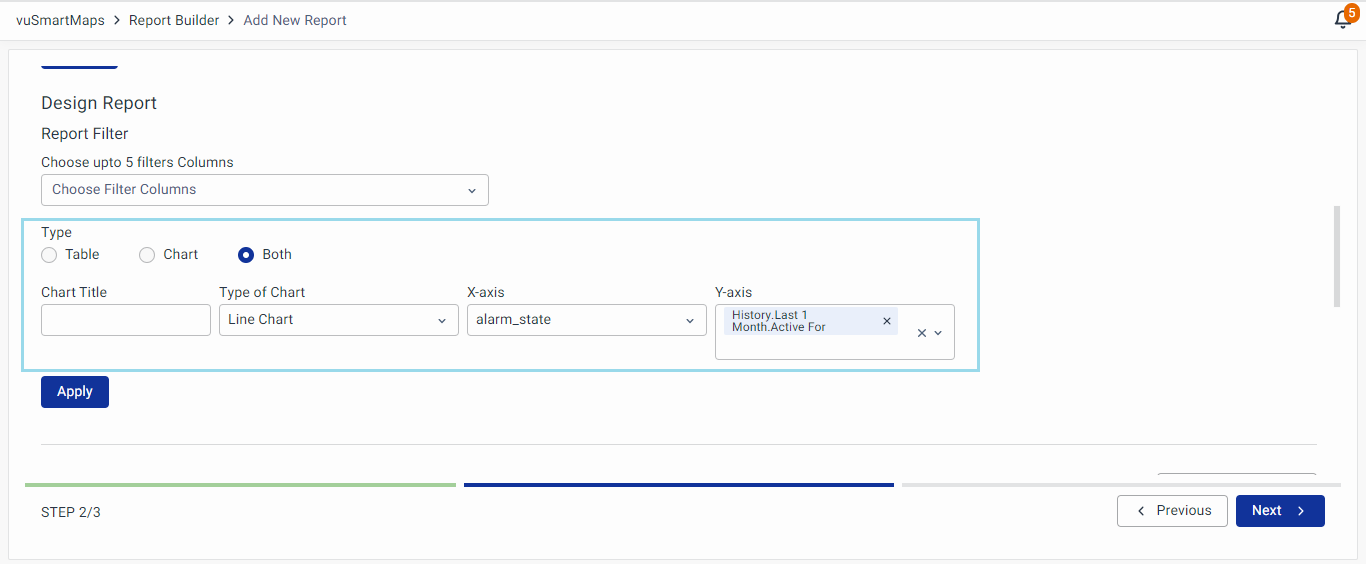
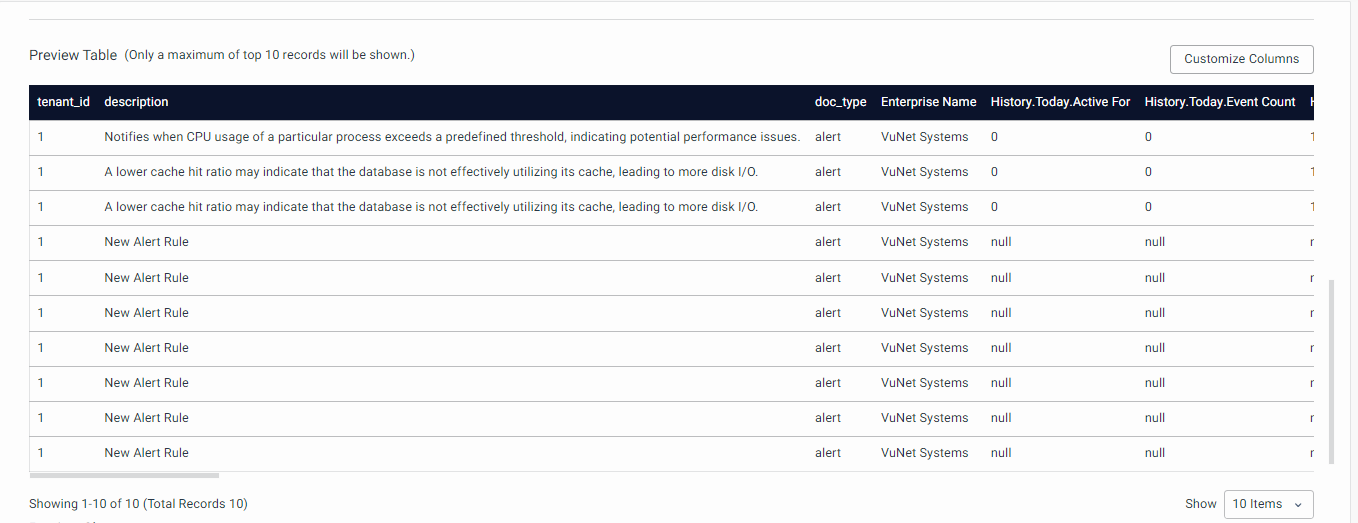
On clicking Apply, a report preview will be displayed. This helps to get a view of the report before even scheduling the report.

- NoSQL DSL Query
Similarly, you should provide the NoSQL Query along with the respective index for that query. Configure the report by choosing the column filter. Select the type of report as Table, Chart, or Both. In the case of a Chart, choose the chart type from Line Chart, Vertical Bar Chart, and Area Chart, along with specifying the field you want to represent on the X and Y axes, respectively. Click on Apply, and the report preview will be displayed.
You can refer to the annexure, for a sample Elasticsearch Queries
PSQL Database
- Long-Term Storage SQL Query:
For the Long-Term Storage SQL Query, the user can provide the Long-term data store query. Configure the report by choosing the column filter. Select the type of report as Table, Chart, or Both. In the case of a Chart, choose the chart type from Line Chart, Vertical Bar Chart, and Area Chart, along with specifying the field you want to represent on the X and Y axes, respectively. Click on Apply, and the report preview will be displayed.
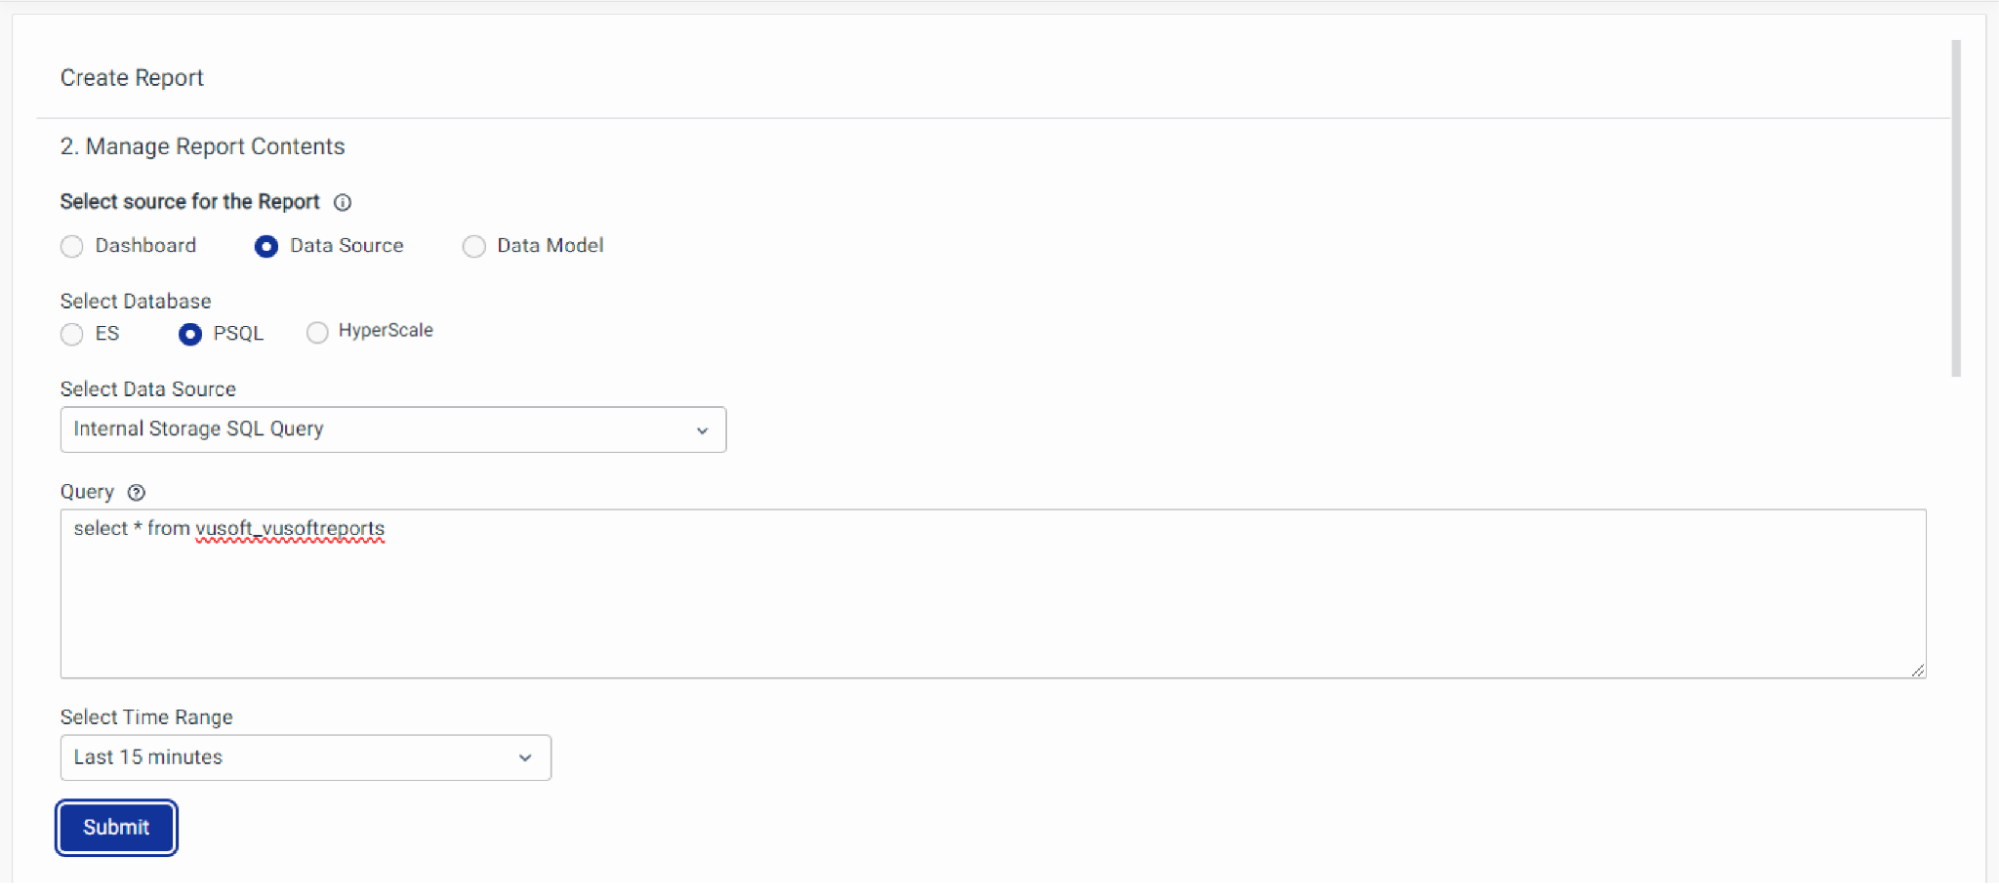
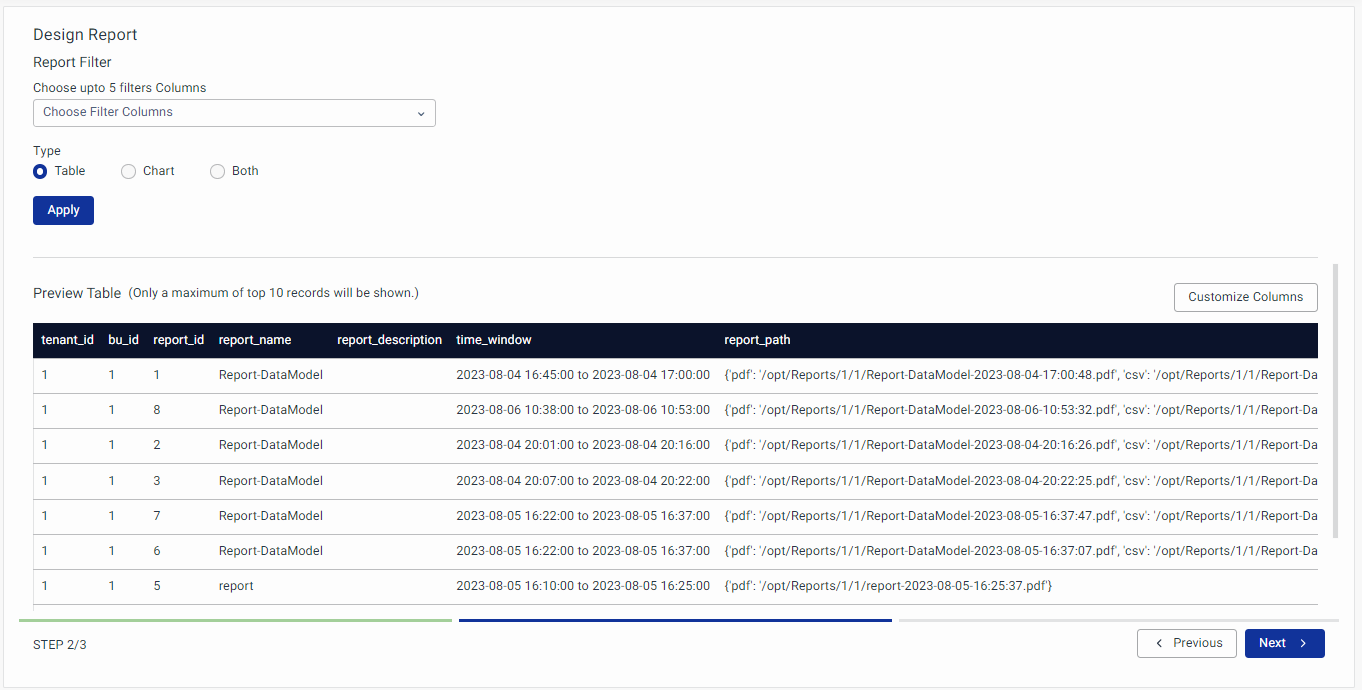
- Internal Storage SQL Query:
For the Internal Storage SQL Query, the user can provide the MySQL query. Configure the report by choosing the column filter. Select the type of report as Table, Chart, or Both. In the case of a Chart, choose the chart type from Line Chart, Vertical Bar Chart, and Area Chart, along with specifying the field you want to represent on the X and Y axes, respectively. Click on Apply, and the report preview will be displayed.

You can refer to the annexure, for a sample of Long-term storage Queries
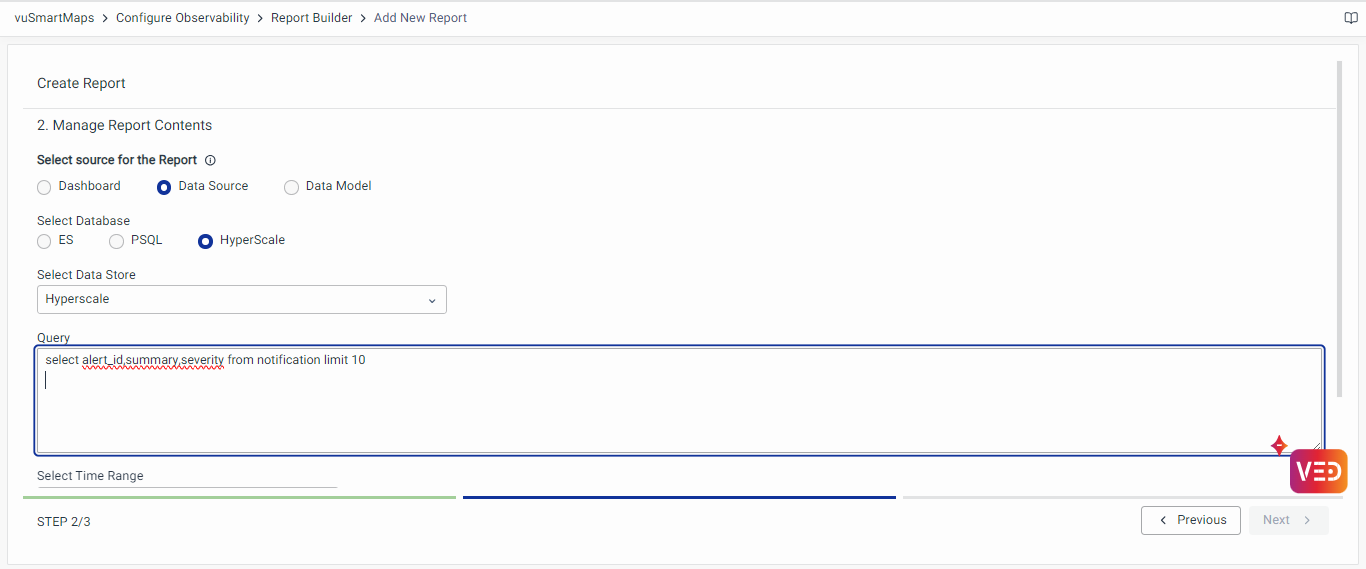
HyperScale Database
Hyperscale database provide the provision of creating reports using data model query. For the HyperScale database select the data store as hyperscale, user can provide the SQL query. Configure the report by choosing the column filter. Select the type of report as Table, Chart, or Both. In the case of a Chart, choose the chart type from Line Chart, Vertical Bar Chart, and Area Chart, along with specifying the field you want to represent on the X and Y axes, respectively. Click on Apply, and the report preview will be displayed.
Data Summarization for Long-term data storage:
The user can generate a report based on the raw data, daily data, hourly data, and weekly data.
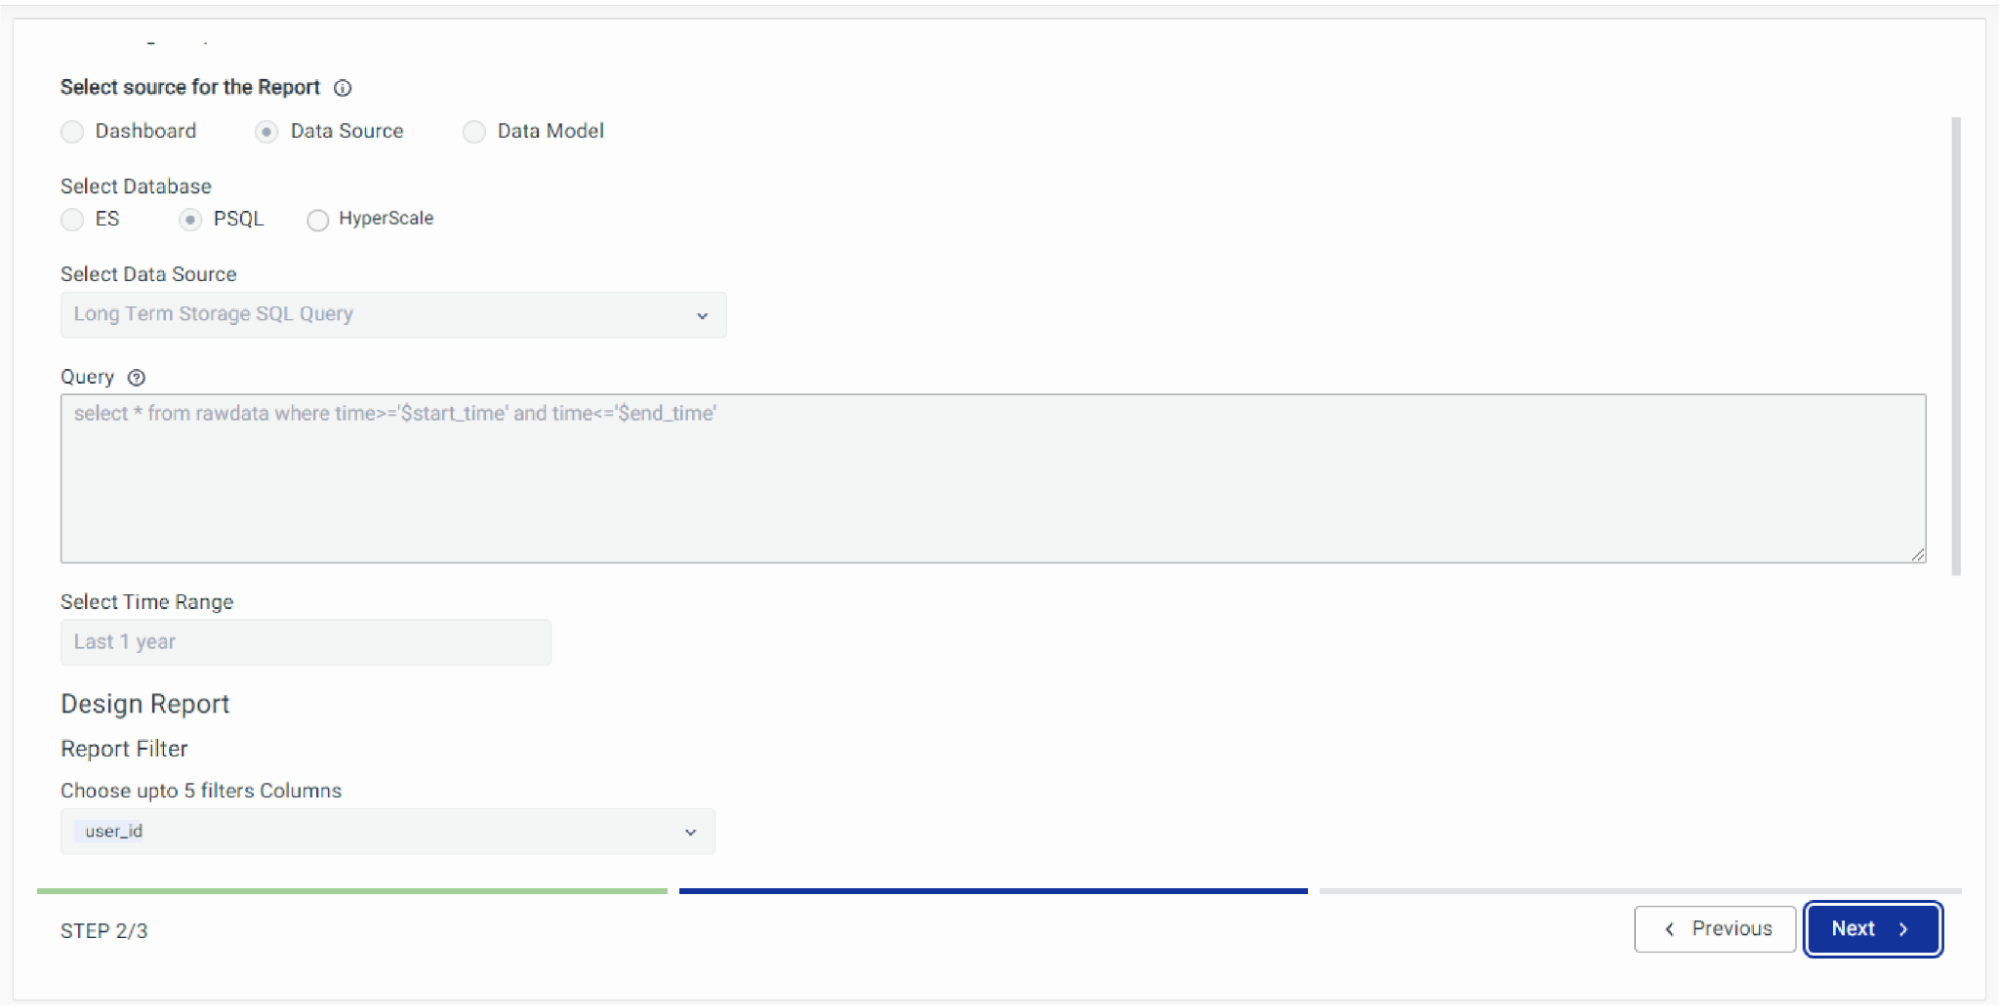
Users need to write queries with the raw table name irrespective of the time period. If the query has a time filter, the system will identify the table from which the data has to be fetched as per the time period.
- Sample query:
select * from rawdata where time>='$start_time' and time<='$end_time'
Therefore, this is all about creating reports using a Data source. Now, let's move on to creating Reports using the Data Model.
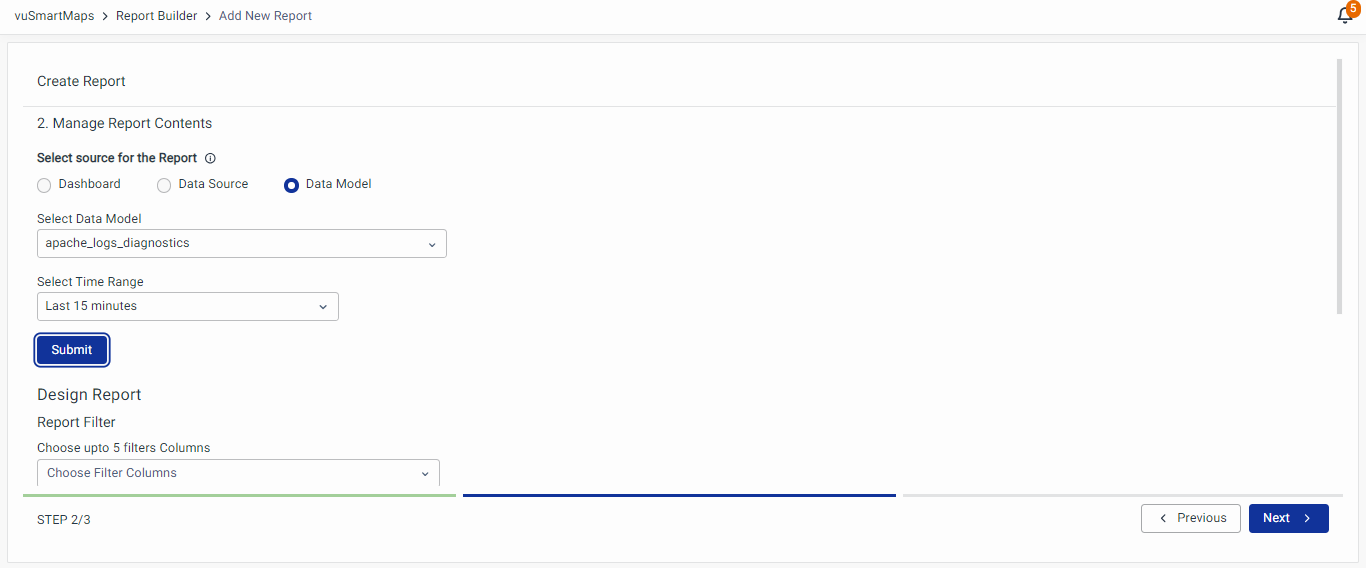
Data Model
Select the required Data Model and Metric.
Click on Submit to preview the data.
Step 3: Schedule to Generate and Distribute
The step consists of 3 collapsible sections as follows:
Manage Schedule
This section is used for the scheduling frequency of the report.
Click on the Radio button to toggle Schedule Reports.
- Schedule At: For one-time scheduling, select "Schedule At" time.
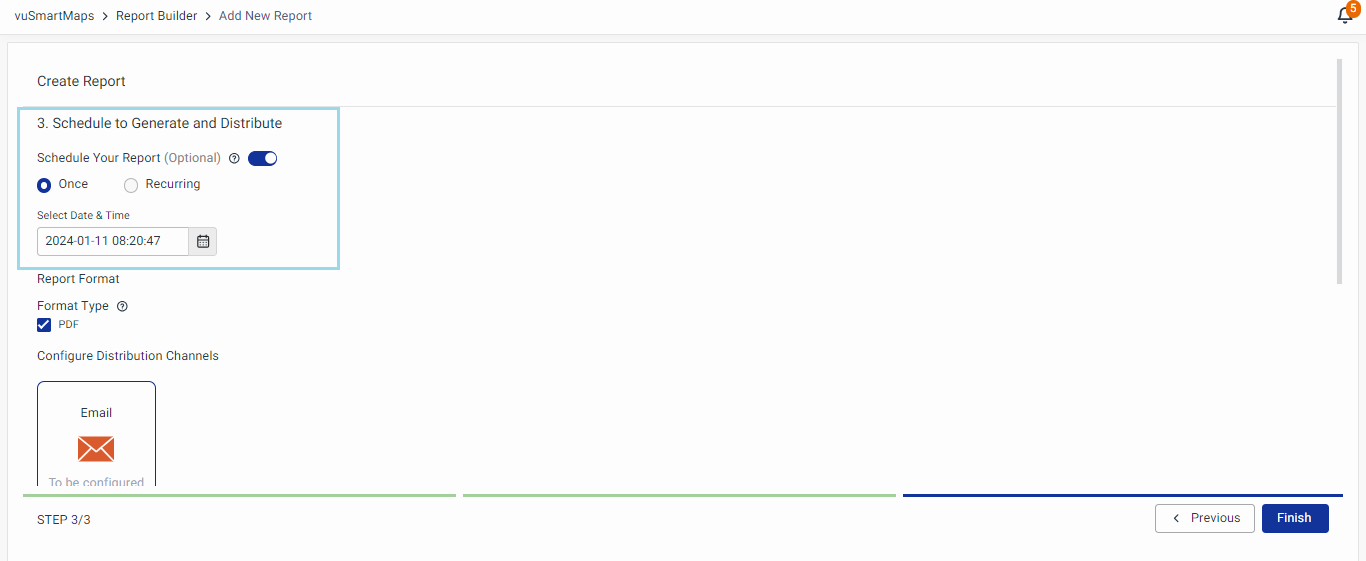
- Periodic schedule: For regular reports, choose the Recurring Schedule Option.
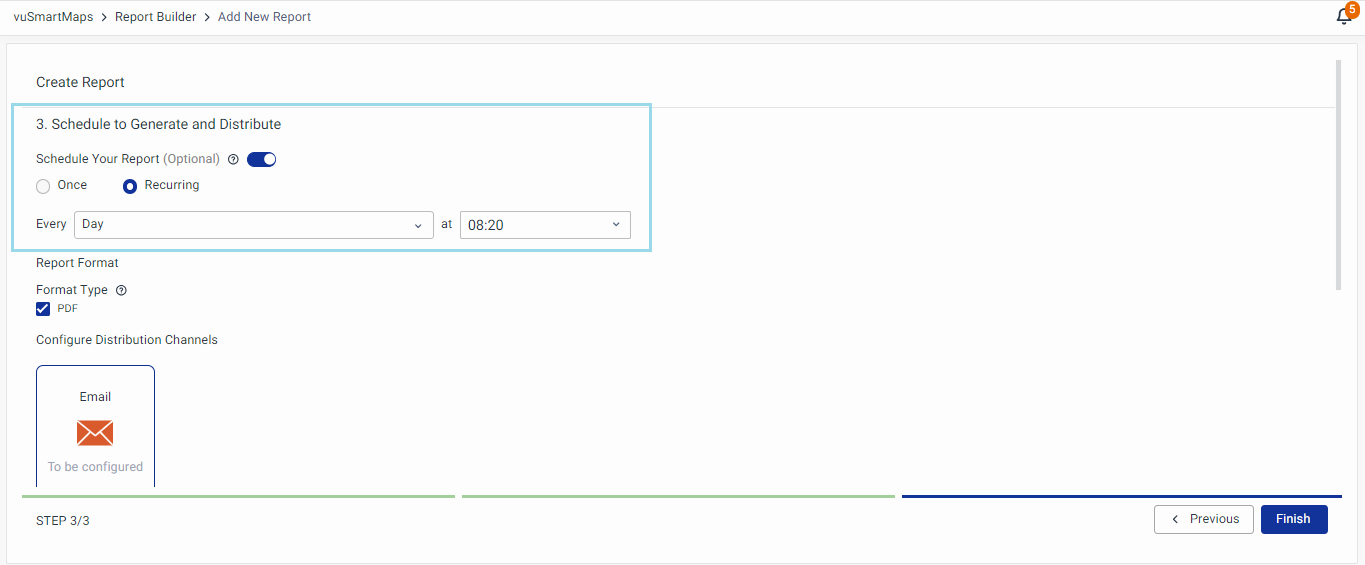
Report Format
- Pick the format: PDF and/or CSV. (The user can generate the same report in both formats simultaneously)
The CSV format can not be used to generate Reports for
- Dashboard as a report
- Long-term data storage report using chart
Configure Distribution Channels
If Configure Distribution Channels is selected, then the user needs to provide a mandatory email ID
- Email ID
- Email Groups (Optional)
- Email Subject (Optional)
- Email Description (Optional)
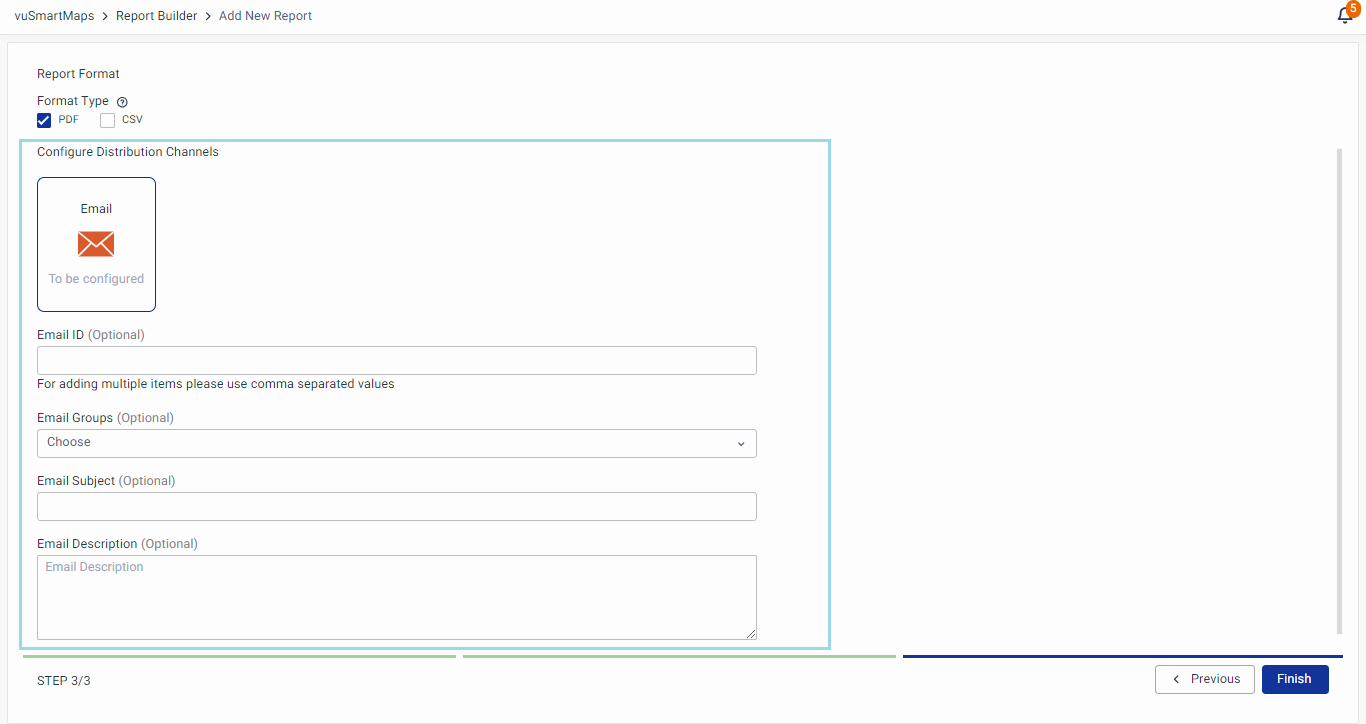
After setting everything, click Finish to create the Report. You'll see the new Report on the Report Builder page.
Annexure
The Annexure will provide you with some of the sample queries when creating the Report Template using different data sources.
Sample Query
All possible combinations are supported, including Joins, Aggregations, Renaming column names, Mathematical Operations, and Operators.
1. PSQL Queries
-
Long-term storage query:
select * from availabilitydata; -
Internal storage query:
select * from vusoft_vusoftreports;
2. Elasticsearch Queries:
- Sample NOSQL DSL Query:
Here, the user needs to provide an index along with the query, multiple buckets like Date Histogram, Terms, Significant Terms, Data range, filters, etc., and multiple metrics like sum, count, average count, min, max, etc. aggregations are supported.
Query - {'_source': ['alert_id', 'Alert-Rule-Name', 'alarm_state'], 'size': 100}
Index - vunet-1-1-notification-*
- Sample NOSQL Timelion Query:
Here, the user needs to provide an elastic search query including the index and with a time field. Also, multiple buckets like Date Histogram, Terms, Significant Terms, Data range, filters, etc., and multiple metrics like sum, count, average count, min, max, etc. aggregations are supported.
.es(index=vunet-1-1-notification-*, q=*,size=10, timeseries=False)
