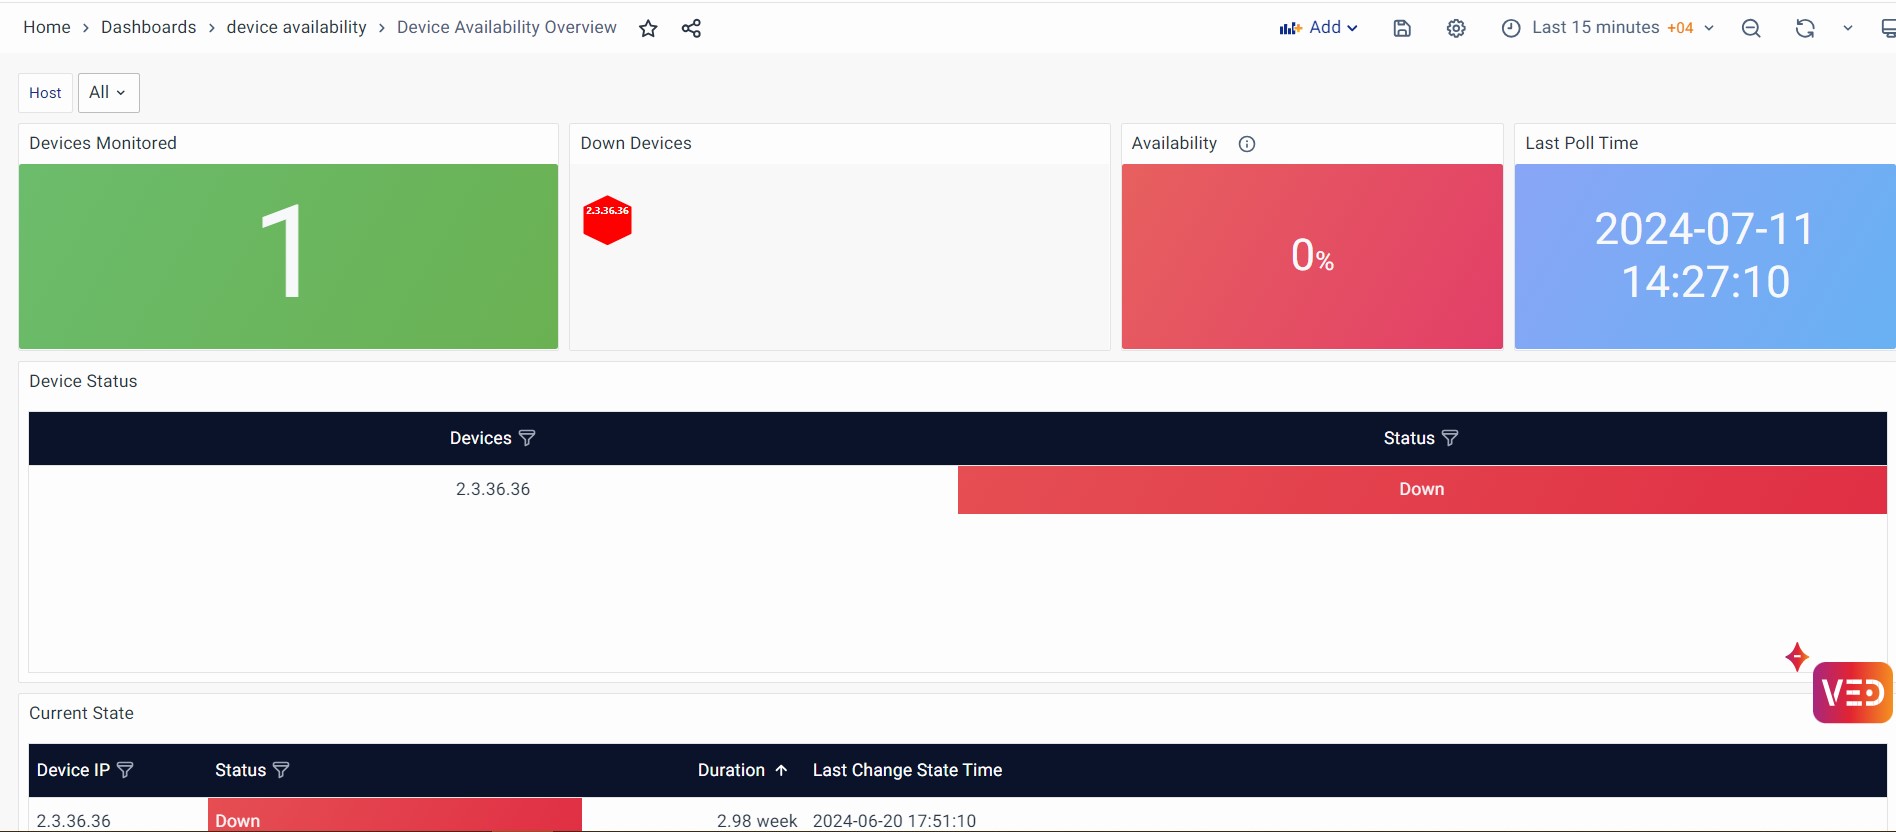
Alert Details
For additional details about a specific Alert, simply click on the Alert ID. It takes you into the detailed sections of an Alert as shown below.
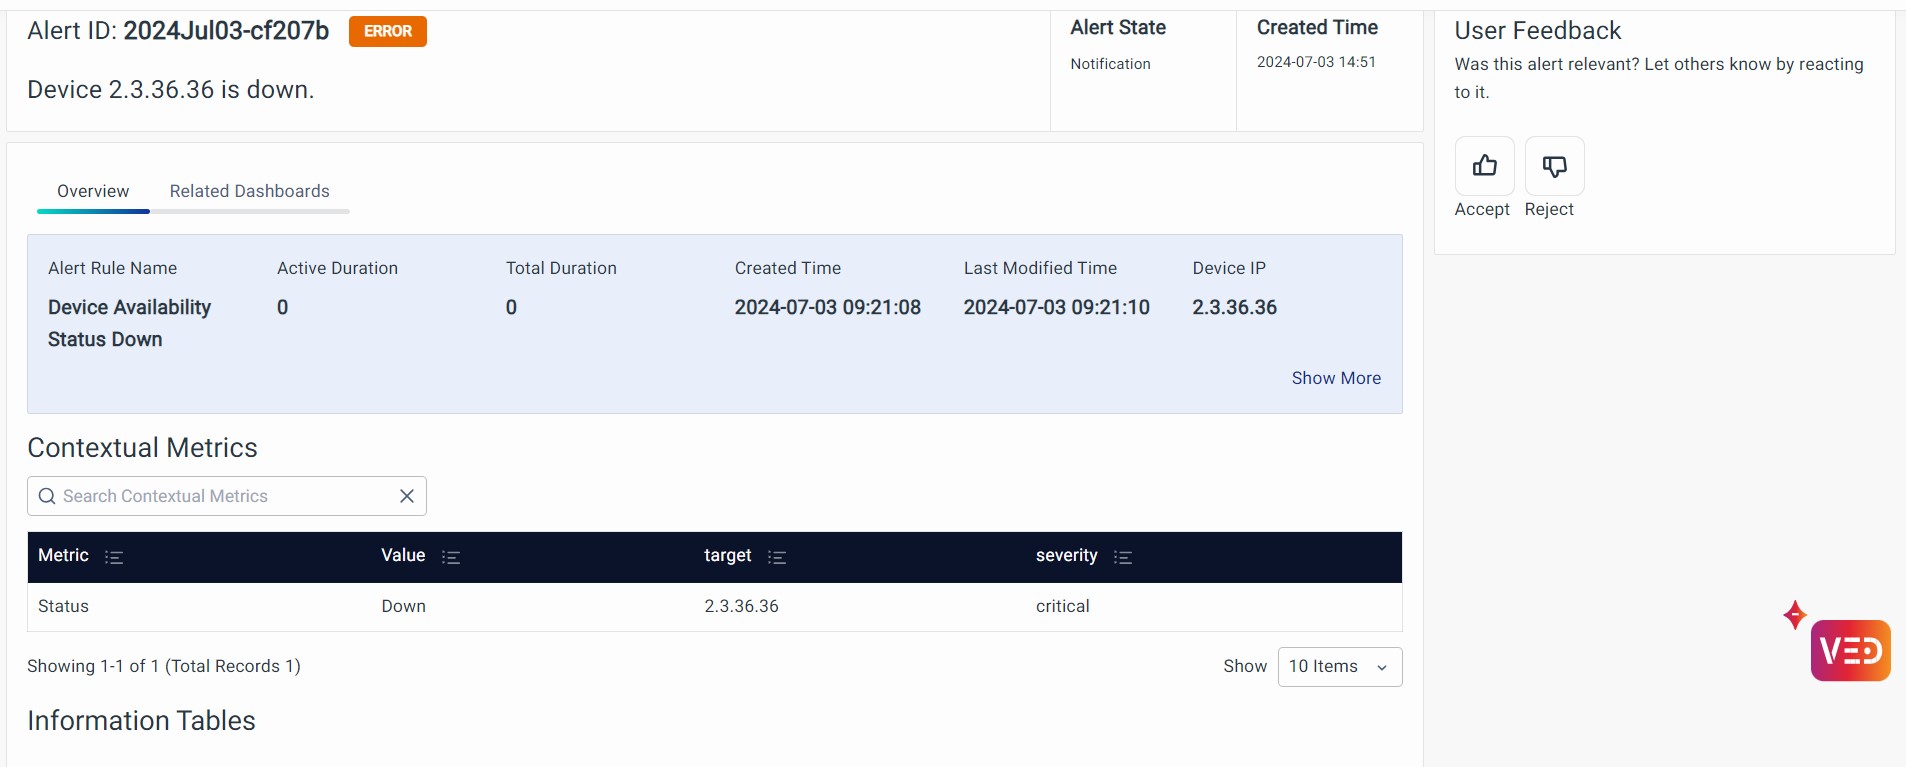
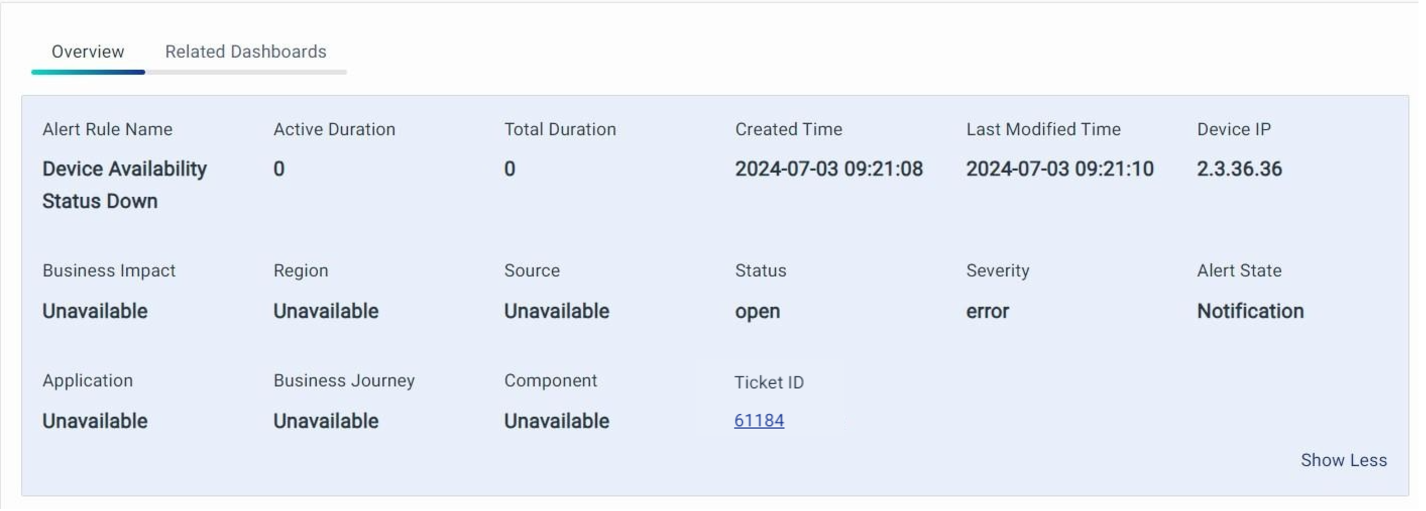
Overview
These details provide comprehensive insights into the alert. It includes Device IP, Severity, Created Time, Total Duration, and Status, among others.
-
Device IP: The IP address of the device where the alert originated.
-
Alert Source: The source of where the alert was generated.
-
Active Duration: How long the alert has been active.
-
Total Duration: The combined duration of the alert being active and inactive.
-
Business Impact: Information on the business impact of the alert.
-
Region: The region or location where the alert was generated.
-
Created Time: The timestamp of when the alert was created.
-
Last Modified Time: When the alert was last edited.
-
Status: The current status of the alert, with possible values – Unassigned, In Progress, or Cleared.
-
Assignee: The user to whom the alert is assigned.
-
Severity: The severity level of the alert.
-
Alarm State: The current state of the alert, with possible values – Notification, Alarm New, Alarm Update, or Alarm Clear.
-
Predictive Insights: This will be available in the future release.
-
Summary Analysis: This will be available in a future release.
-
AppName: The application that is affected by the alert, providing context on which part of the system is experiencing issues. Example: CBS Main
-
Component: The specific component or part of the system that triggered the alert, such as a server, database, or application module. Example: CBS Component.
-
Ticket ID: The ID of the ticket created in the incident management system for this alert.
note- The Ticket ID on the Alert details page will appear as a clickable link, opening the ticket in the configured ITSM tool in a new tab.
- Ensure the ITSM tool is configured correctly to view the ticket.
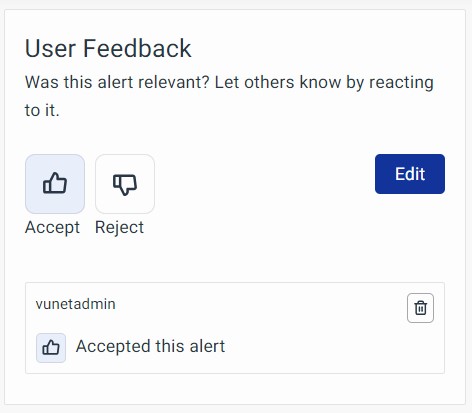
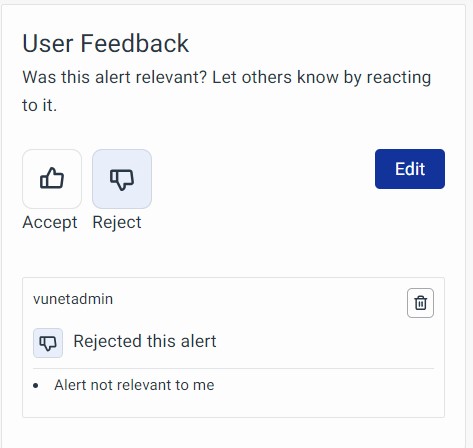
User Feedback
This section allows the alert creator to gather feedback, helping them improve future alerts or decide whether to retain existing ones.
A snapshot of what the user feedback section looks like is shown below:
Contextual Metrics
This table provides you with the metrics of an alert.
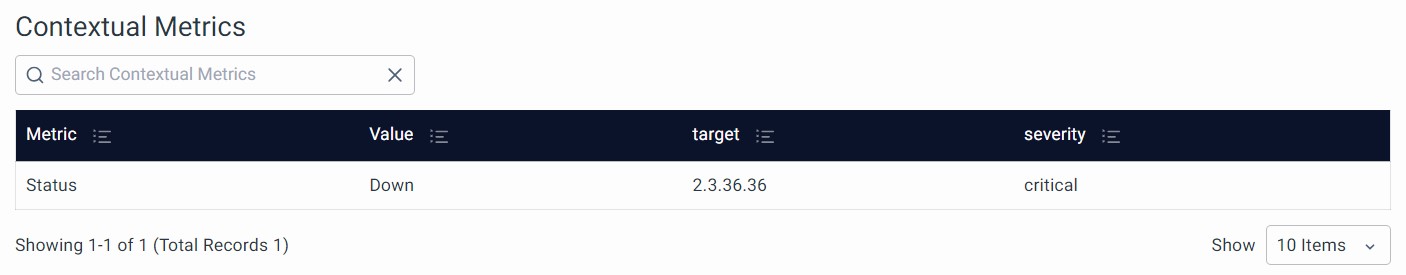
- Metric: Provides you with the metric that is being alerted. Example: Status.
- Value: Provides the status of the given metric, say, up or down.
- Target: Provides you with the IP address of the affected application.
- Severity: Describes the severity of the Alert. Example: Critical.
Information Table
This table gets populated for the Alert Rules where the “Information Only” box is checked during Alert Rules Configuration.
Related Dashboards
These are configured during the Alert Rules set up under Evaluation Script or Advanced Configuration.
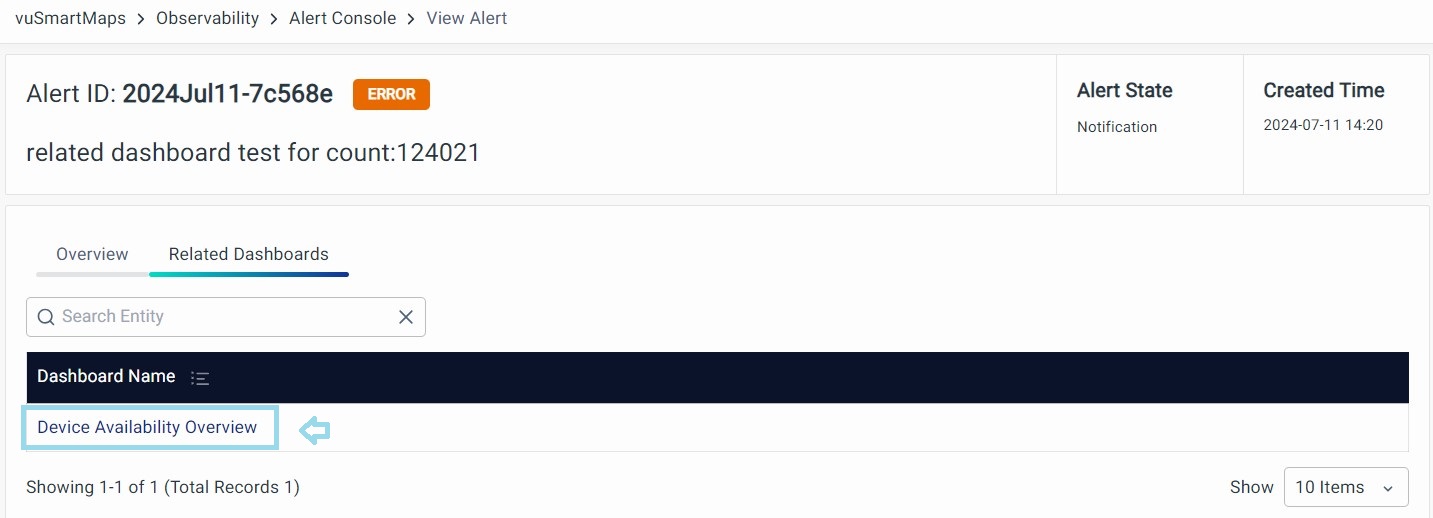
Click on the name of the dashboard highlighted and the respective dashboard will be displayed.