Debugging ContextStreams
I/O Streams Debugging
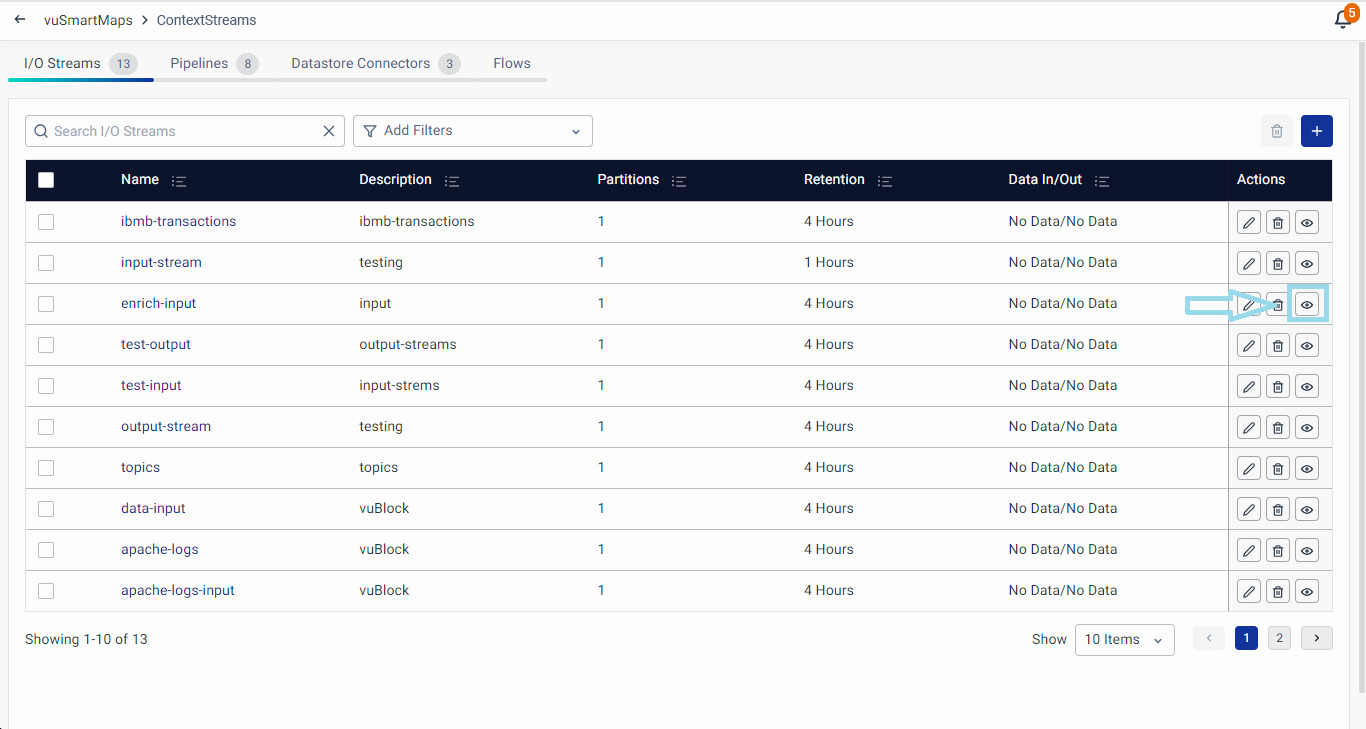
In vuSmartMaps, the Preview Data option for I/O Streams offers a debugging of the selected stream, by showing the data preview.
The Preview option serves as a quick debugging tool for I/O Streams, enabling users to verify if the data is being streamed as expected.
Click on the Preview Data button (available under the Actions column on the I/O Streams page) to preview the data in the particular I/O stream.
The Preview Data option allows users for the following options:
- Capture: This option allows users to preview the data within an I/O stream. Users can customize the preview by selecting specific data points, setting a timeout, and choosing the data type. Additionally, the user can download the previewed data as a JSON file using the "Download Preview Data" button.
- Upload: Users can utilize the "Upload" option to insert specific data into an I/O stream for preview purposes. This option is handy for testing and ensuring that the data is getting streamed properly. Uploading the test data in the I/O stream can also be used to test the whole ContextStream end-to-end i.e., I/O stream → Data Pipeline → DataStore Connector → Data Store.
These options capacitate users to interact with, analyze, and debug data within their selected I/O streams effectively. The preview features enable users to ensure that data is correctly streaming, providing valuable insights for debugging purposes.
These debugging methods empower users to perform end-to-end checks of the data flow within the vuSmartMaps platform. Starting from the I/O stream, users can follow the entire data journey through the Data Pipeline to the DataStore Connector and verify whether data is being correctly written into the database. This robust feature serves as a powerful tool for end-users, facilitating comprehensive debugging of the entire ContextStream configuration.
Capture
Within the 'Capture’ tab, users can configure preview settings using the left pane:
-
Type: Select the point in the stream from where to start reading.
- Realtime Data: Capture new records as they are added to the data store.
- Duration of Capture: Specify the time (in seconds) for which data should be captured. The range is 1–300 seconds.
- Existing Records: Fetch records that already exist in the data store.
- Realtime Data: Capture new records as they are added to the data store.
-
Max Number of Records: Define the maximum number of records to capture, ranging from 1–1000 records.
-
Filter (Optional): Define patterns to filter and display records based on specific criteria. Filters can be applied using string, regex, and key-value patterns to match the desired records. Below are the supported filtering options:
-
String Filter: Matches records containing an exact string.
- Example:
error
- Example:
-
Regex Filter: Matches records based on a regular expression.
- Example:
UPI[0-9]+[a-z]
- Example:
-
String Filter with Escaped Comma: Matches records that contain the exact appearance of a string, including escaped commas. This ensures the search string is treated as a single literal string.
- Example:
message\, errorwill match records with the exact text"message, error".
- Example:
-
String Filter with Comma-Separated Values: Matches records that contain any one of the comma-separated values. The filter acts as an OR condition.
- Example:
message, errorwill match records containing either"message"or"error".
- Example:
-
String and Regex Filter: Matches records that satisfy either a string or a regex condition, separated by commas. The comma acts as an OR operator.
- Example:
message, Er[a-zA-Z]will match records containing"message"or any text matching the regexEr[a-zA-Z].
- Example:
-
Key-Value Pair Filter: Matches records where a specific key has a specific value.
- Example:
code:01will match records where the keycodehas the value01.
- Example:
-
Regex Filter in Key-Value Pair: Matches key-value pairs where the value matches a regular expression.
- Example:
message:[Ee]rrorwill match records where the keymessagehas a value that matches the regex[Ee]rror.
- Example:
-
Regex Filter with Comma-Separated Values: Matches records based on multiple regular expressions separated by commas. The filter acts as an OR condition.
- Example:
UPI[0-9]+[a-z], Er[a-zA-Z]will match records containing text that satisfies eitherUPI[0-9]+[a-z]orEr[a-zA-Z].
- Example:
-

Upon clicking the Capture button, the Data Preview appears on the right side of the screen. With this, the user can debug if data in the I/O streams is getting streamed as expected or not. Users have the option to download this data using the Download Preview Data button.
Upload
In the 'Upload' tab, users can upload data via a JSON file. After clicking the Upload button, the data preview appears on the right side of the screen. As with the Capture tab, users can download this data using the Download Preview Data button.
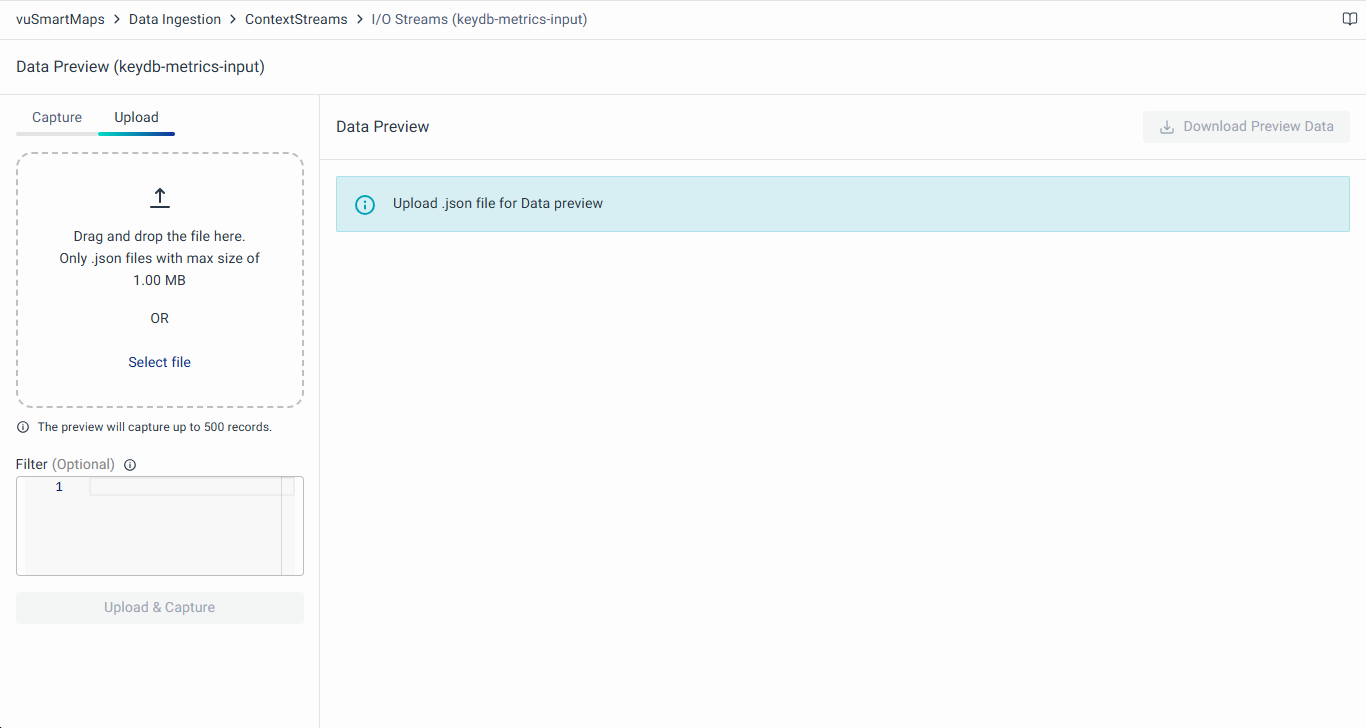
With this option, users can analyze the data, if it is getting streamed as expected.
Only valid minified JSON separated by newlines is accepted via a file. You can use the minify option of JSON Beautifier or similar tools. An example below:
{"services":[{"name":"longhorn","count":"1","cpu_core":"0.01","memory":"2GB","disk":"3GB"},{"name":"minio-operator","count":"1","cpu_core":"0.01","memory":"2GB","disk":"1GB"}]}
{"services":[{"name":"longhorn","count":"1","cpu_core":"0.01","memory":"2GB","disk":"3GB"},{"name":"minio-operator","count":"1","cpu_core":"0.01","memory":"2GB","disk":"1GB"}]}
{"services":[{"name":"longhorn","count":"1","cpu_core":"0.01","memory":"2GB","disk":"3GB"},{"name":"minio-operator","count":"1","cpu_core":"0.01","memory":"2GB","disk":"1GB"}]}
Data Pipeline Debugging
In the vuSmartMaps UI, the Debug option plays a pivotal role in analyzing and diagnosing the functionality of the data pipelines. There are three distinct debugging options available, each serving a unique purpose:
- Draft Block Debug:
- This option is used when you want to localize the issue to a specific block within the draft version of the pipeline.
- On the block editor page, initiate debugging for the particular block you want to inspect. This provides detailed insights into the processing of that specific block, facilitating fine-tuning and optimization during the development phase.
- Learn more about Draft Block Debug here, where detailed information on its application and usage is provided.
- Draft Pipeline Debug:
- Employ this option during the pipeline development phase when you want to identify and resolve issues before publishing.
- Head to the pipeline editor page to initiate debugging for the draft version of the pipeline. This allows you to analyze intermediate states, metrics, and data flow specific to the draft version. It aids in identifying and addressing potential problems early in the development process.
- Learn more about Draft Pipeline Debug here, where detailed information on its application and usage is provided.
- Published Pipeline Debug:
- This option allows the debugging of the pipeline in a live, production environment.
- Navigate to the Pipelines listing page, where you can debug the published version of the data pipeline. This provides insights into the real-time data flow, metrics, and logs, enabling you to identify and address issues affecting the live production environment.
- Learn more about Production Debug here, where detailed information on its application and usage is provided.
In summary, these three debugging options offer comprehensive diagnostic capabilities throughout the data pipeline lifecycle.
Debugging a Block
To debug an individual block within a pipeline using the Block Editor, follow these steps:
- Click on the Debug button located at the top of the Block Editor page.
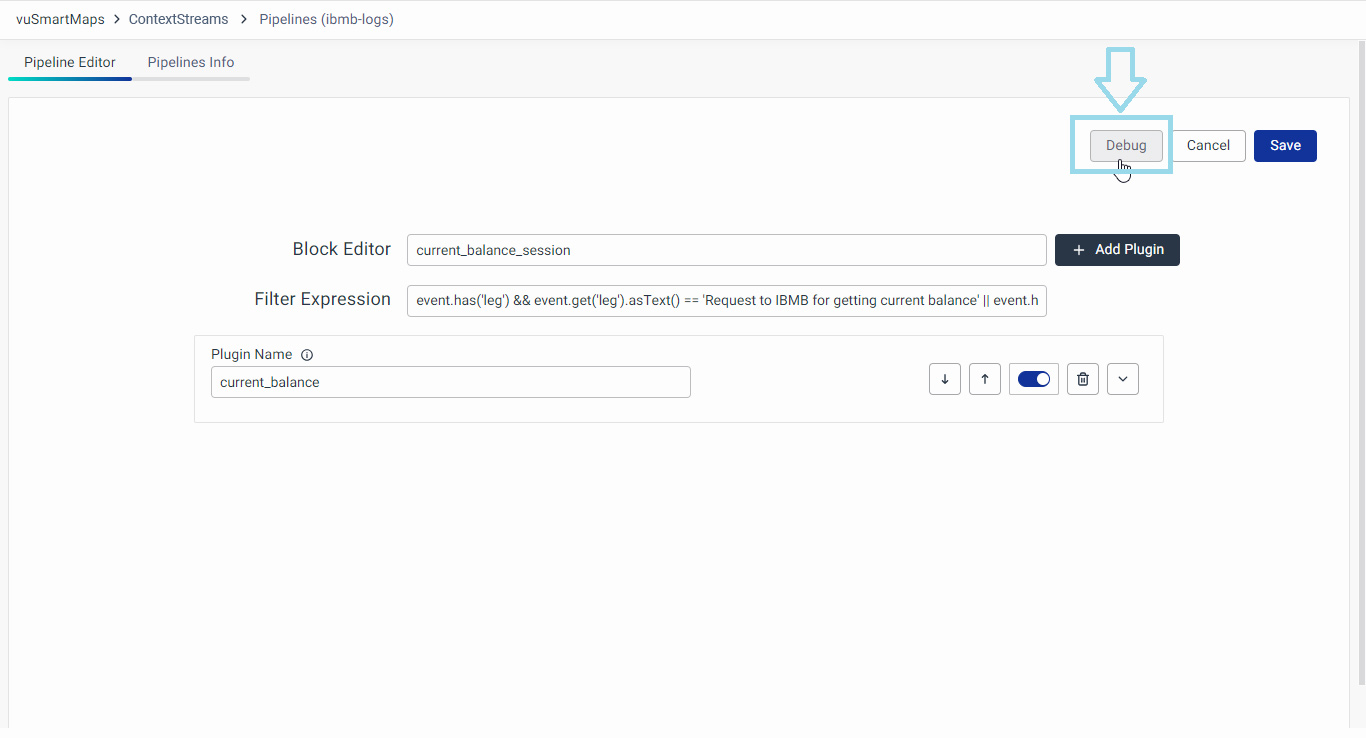
- This action will open a modal specifically designed for debugging the selected block.
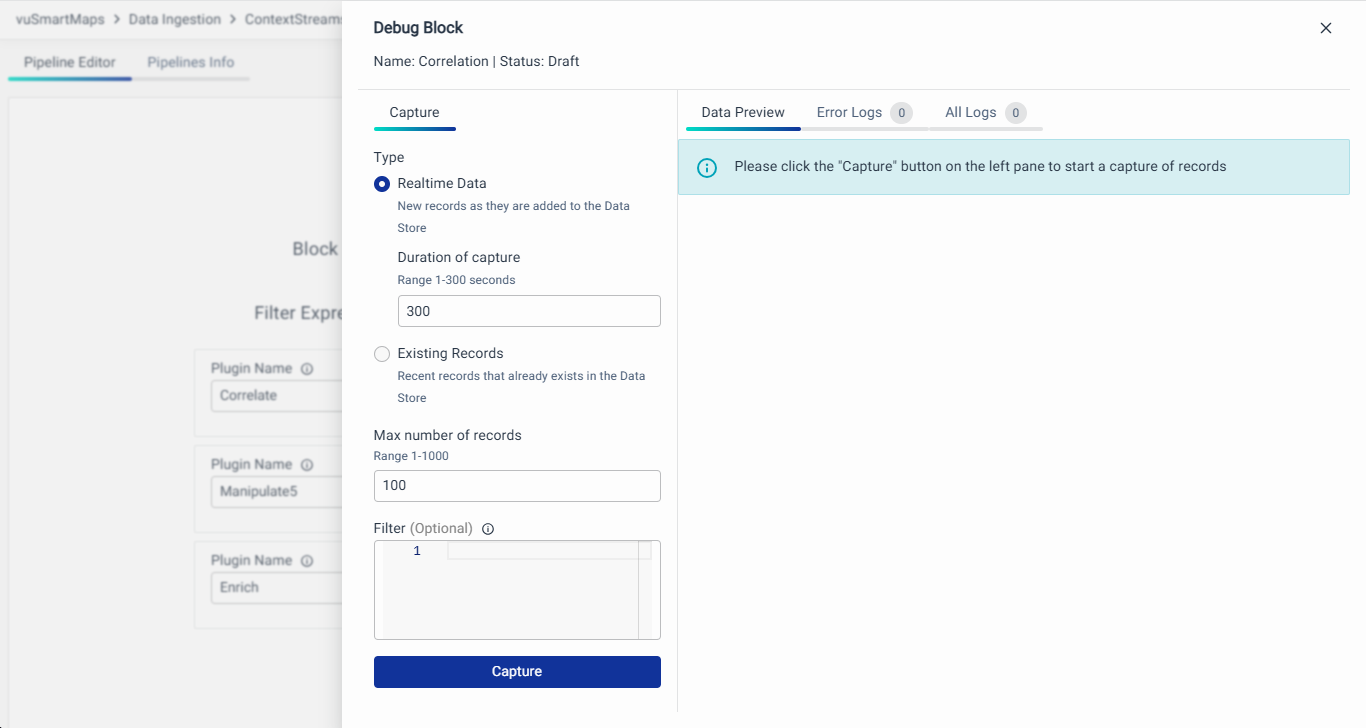
- On the left side of the modal, provide the following details:
-
Type: Select the point in the stream from where to start reading.
- Realtime Data: Capture new records as they are added to the data store.
- Duration of Capture: Specify the time (in seconds) for which data should be captured. The range is 1–300 seconds.
- Existing Records: Fetch records that already exist in the data store.
- Realtime Data: Capture new records as they are added to the data store.
-
Max Number of Records: Define the maximum number of records to capture, ranging from 1–1000 records.
-
Filter (Optional): Define patterns to filter and display records based on specific criteria. Filters can be applied using string, regex, and key-value patterns to match the desired records. Below are the supported filtering options:
-
String Filter: Matches records containing an exact string.
- Example:
error
- Example:
-
Regex Filter: Matches records based on a regular expression.
- Example:
UPI[0-9]+[a-z]
- Example:
-
String Filter with Escaped Comma: Matches records that contain the exact appearance of a string, including escaped commas. This ensures the search string is treated as a single literal string.
- Example:
message\, errorwill match records with the exact text"message, error".
- Example:
-
String Filter with Comma-Separated Values: Matches records that contain any one of the comma-separated values. The filter acts as an OR condition.
- Example:
message, errorwill match records containing either"message"or"error".
- Example:
-
String and Regex Filter: Matches records that satisfy either a string or a regex condition, separated by commas. The comma acts as an OR operator.
- Example:
message, Er[a-zA-Z]will match records containing"message"or any text matching the regexEr[a-zA-Z].
- Example:
-
Key-Value Pair Filter: Matches records where a specific key has a specific value.
- Example:
code:01will match records where the keycodehas the value01.
- Example:
-
Regex Filter in Key-Value Pair: Matches key-value pairs where the value matches a regular expression.
- Example:
message:[Ee]rrorwill match records where the keymessagehas a value that matches the regex[Ee]rror.
- Example:
-
Regex Filter with Comma-Separated Values: Matches records based on multiple regular expressions separated by commas. The filter acts as an OR condition.
- Example:
UPI[0-9]+[a-z], Er[a-zA-Z]will match records containing text that satisfies eitherUPI[0-9]+[a-z]orEr[a-zA-Z].
- Example:
-
-
- After providing the necessary details, click on the "Capture" button. During debugging, the system uses actual data arriving at the input of the corresponding block, depending on the configured options on the left side of the Debug page. The data employed in debugging is filtered and processed based on the specified parameters, allowing users to assess how real data would be handled in the block. This approach provides an authentic simulation of real-world scenarios without impacting live ContextStreams.
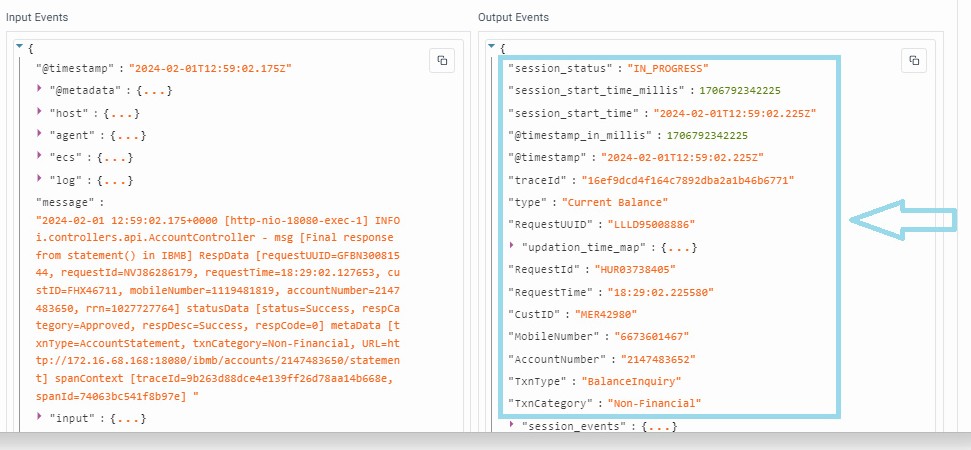
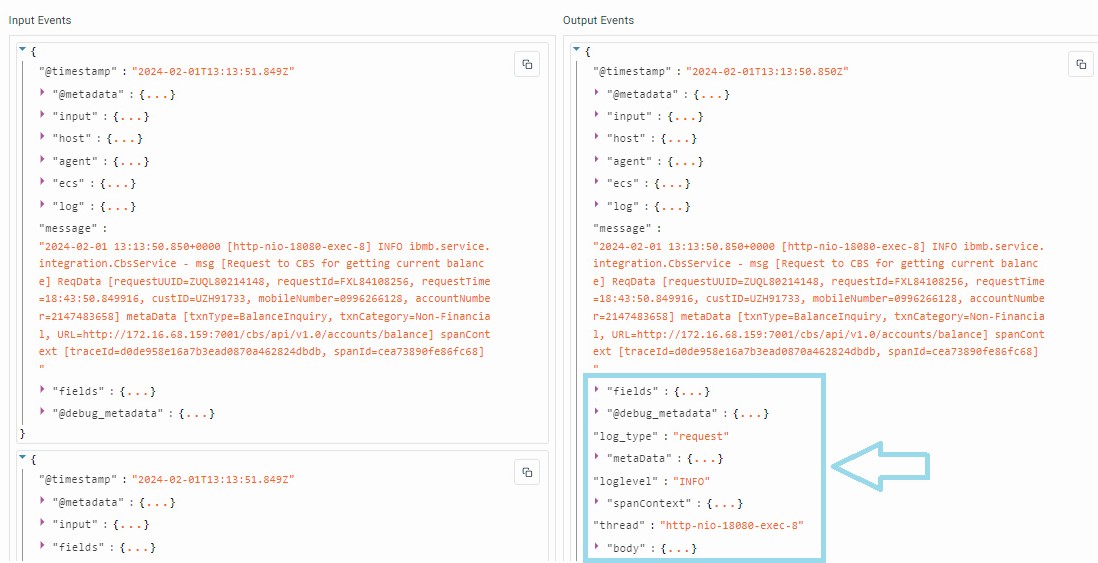
- The Data Preview tab on the right side of the modal will display Input and Output Events. Analyze these fields to ensure that data processing within the block is occurring as expected. If not, make necessary adjustments in the pipeline to ensure proper data contextualization. If there are issues in the output events, you can disable a particular plugin and run the debugs again. Use the radio button to enable/disable the particular plugin.
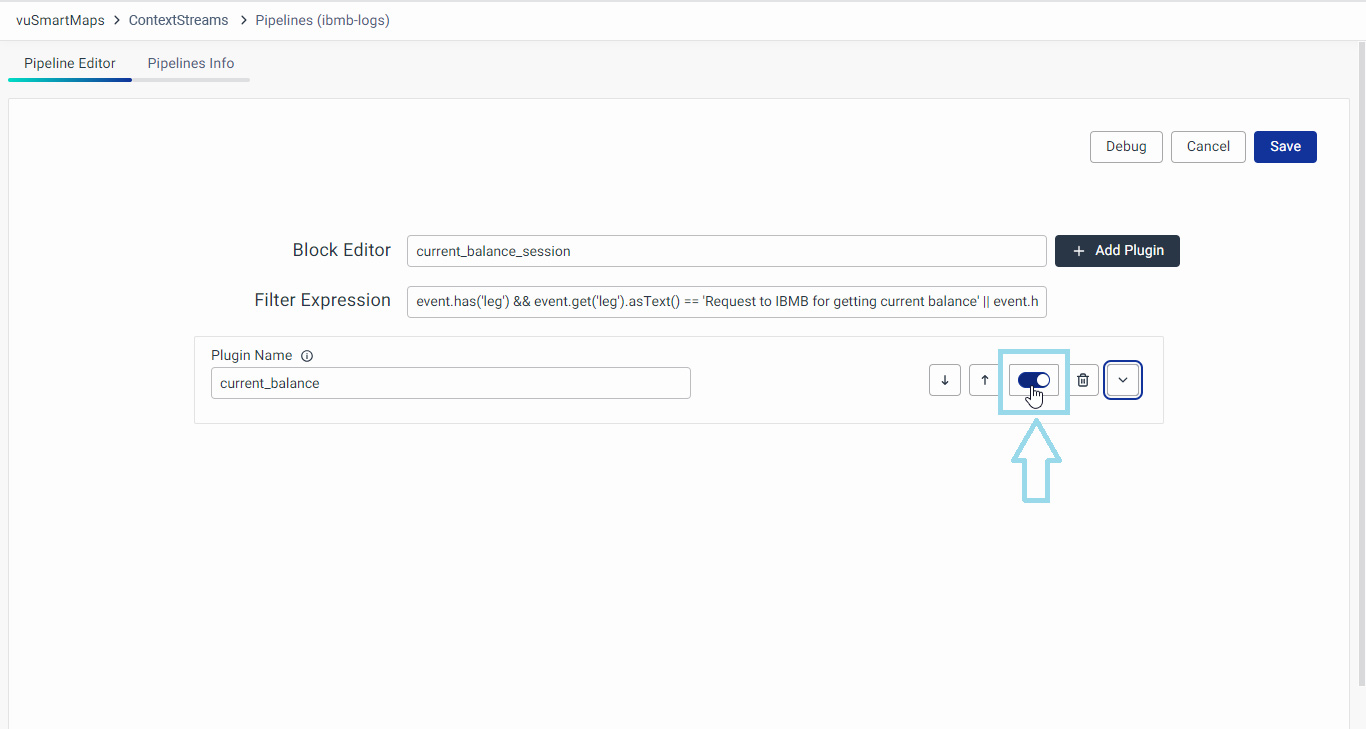
- For instance, observe the contextualized fields added in the output stream post-processing with the block, as illustrated above.
- Additionally, check the “Error Logs” and "All Logs" tabs to analyze detailed logs and debug the behavior of the block effectively.
This debugging feature within the Block Editor provides users with insights into the behavior of individual blocks, allowing for precise adjustments and optimization in the data contextualization process.
Debugging a Draft Pipeline
To debug a pipeline in Draft mode directly from the Pipeline Editor, follow these steps:
- Click on the Debug button located at the top of the Pipeline Editor page.

- This action will open a modal dedicated to debugging the draft pipeline.

- On the left side of the modal, provide the following details:
-
Type: Select the point in the stream from where to start reading.
- Realtime Data: Capture new records as they are added to the data store.
- Duration of Capture: Specify the time (in seconds) for which data should be captured. The range is 1–300 seconds.
- Existing Records: Fetch records that already exist in the data store.
- Realtime Data: Capture new records as they are added to the data store.
-
Max Number of Records: Define the maximum number of records to capture, ranging from 1–1000 records.
-
Filter (Optional): Define patterns to filter and display records based on specific criteria. Filters can be applied using string, regex, and key-value patterns to match the desired records. Below are the supported filtering options:
-
String Filter: Matches records containing an exact string.
- Example:
error
- Example:
-
Regex Filter: Matches records based on a regular expression.
- Example:
UPI[0-9]+[a-z]
- Example:
-
String Filter with Escaped Comma: Matches records that contain the exact appearance of a string, including escaped commas. This ensures the search string is treated as a single literal string.
- Example:
message\, errorwill match records with the exact text"message, error".
- Example:
-
String Filter with Comma-Separated Values: Matches records that contain any one of the comma-separated values. The filter acts as an OR condition.
- Example:
message, errorwill match records containing either"message"or"error".
- Example:
-
String and Regex Filter: Matches records that satisfy either a string or a regex condition, separated by commas. The comma acts as an OR operator.
- Example:
message, Er[a-zA-Z]will match records containing"message"or any text matching the regexEr[a-zA-Z].
- Example:
-
Key-Value Pair Filter: Matches records where a specific key has a specific value.
- Example:
code:01will match records where the keycodehas the value01.
- Example:
-
Regex Filter in Key-Value Pair: Matches key-value pairs where the value matches a regular expression.
- Example:
message:[Ee]rrorwill match records where the keymessagehas a value that matches the regex[Ee]rror.
- Example:
-
Regex Filter with Comma-Separated Values: Matches records based on multiple regular expressions separated by commas. The filter acts as an OR condition.
- Example:
UPI[0-9]+[a-z], Er[a-zA-Z]will match records containing text that satisfies eitherUPI[0-9]+[a-z]orEr[a-zA-Z].
- Example:
-
-
- After providing the necessary details, click on the "Capture" button. During debugging, the system uses actual data arriving at the input of the corresponding pipeline, depending on the configured options on the left side of the Debug page. The data employed in debugging is filtered and processed based on the specified parameters, allowing users to assess how real data would be handled in the pipeline. This approach provides an authentic simulation of real-world scenarios without impacting live ContextStreams.
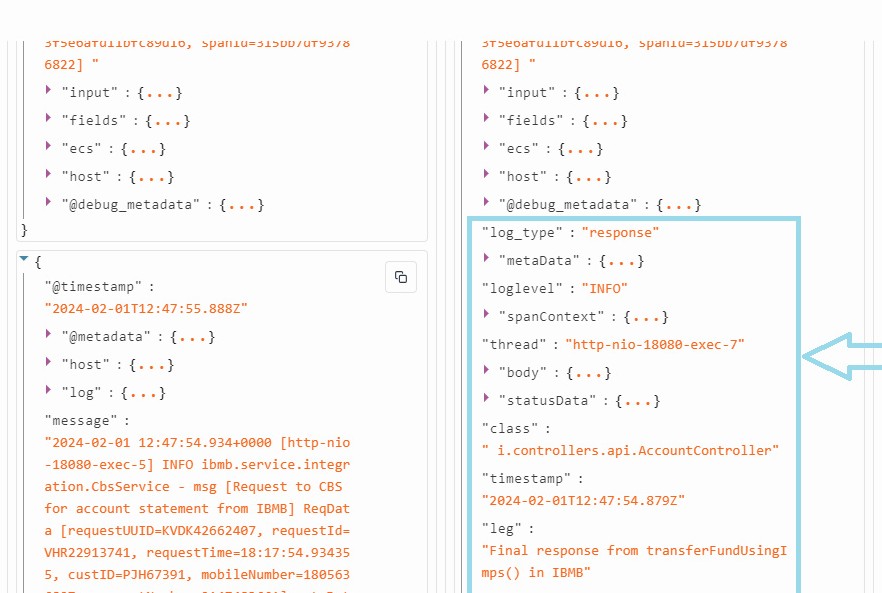
- The Data Preview tab on the right side of the modal will display Input and Output Events. Analyze these fields to ensure that data processing is occurring as expected. If not, make necessary adjustments to the pipeline for proper data contextualization.
- For instance, observe the additional fields added in the output stream post-contextualization with the data pipeline, as illustrated above.
- Additionally, check the “Error Logs” and "All Logs" tab to analyze detailed logs and debug the behavior of the data pipeline effectively.
This debugging feature within the Pipeline Editor allows users to iteratively test and refine their draft pipelines, ensuring accurate and efficient data contextualization.
Debugging a Published Pipeline
To debug a pipeline in Published mode directly from the Data Pipeline page, follow these steps:
- Click on the Debug Pipeline button located under the "Actions" column corresponding to the pipeline you want to debug.

- This action will redirect you to a new page dedicated to debugging the selected pipeline.
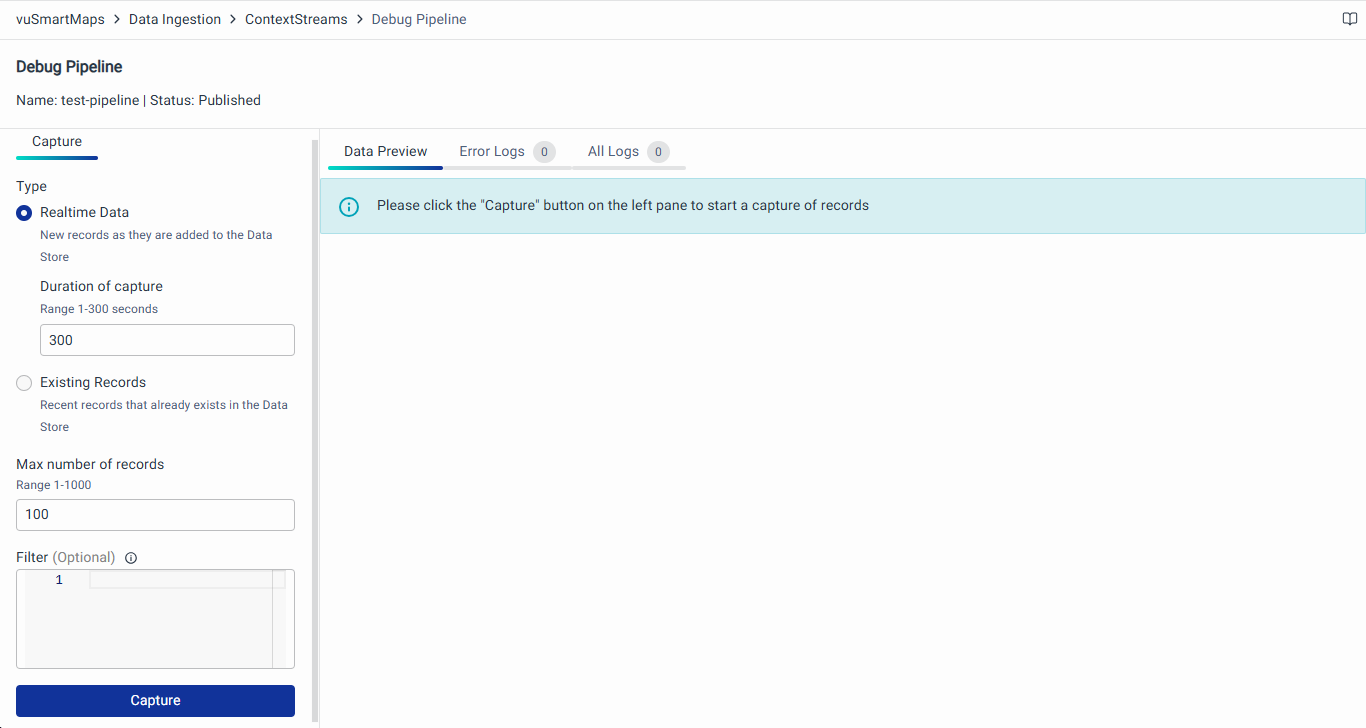
- On the left side of the page, provide the following details:
-
Type: Select the point in the stream from where to start reading.
- Realtime Data: Capture new records as they are added to the data store.
- Duration of Capture: Specify the time (in seconds) for which data should be captured. The range is 1–300 seconds.
- Existing Records: Fetch records that already exist in the data store.
- Realtime Data: Capture new records as they are added to the data store.
-
Max Number of Records: Define the maximum number of records to capture, ranging from 1–1000 records.
-
Filter (Optional): Define patterns to filter and display records based on specific criteria. Filters can be applied using string, regex, and key-value patterns to match the desired records. Below are the supported filtering options:
-
String Filter: Matches records containing an exact string.
- Example:
error
- Example:
-
Regex Filter: Matches records based on a regular expression.
- Example:
UPI[0-9]+[a-z]
- Example:
-
String Filter with Escaped Comma: Matches records that contain the exact appearance of a string, including escaped commas. This ensures the search string is treated as a single literal string.
- Example:
message\, errorwill match records with the exact text"message, error".
- Example:
-
String Filter with Comma-Separated Values: Matches records that contain any one of the comma-separated values. The filter acts as an OR condition.
- Example:
message, errorwill match records containing either"message"or"error".
- Example:
-
String and Regex Filter: Matches records that satisfy either a string or a regex condition, separated by commas. The comma acts as an OR operator.
- Example:
message, Er[a-zA-Z]will match records containing"message"or any text matching the regexEr[a-zA-Z].
- Example:
-
Key-Value Pair Filter: Matches records where a specific key has a specific value.
- Example:
code:01will match records where the keycodehas the value01.
- Example:
-
Regex Filter in Key-Value Pair: Matches key-value pairs where the value matches a regular expression.
- Example:
message:[Ee]rrorwill match records where the keymessagehas a value that matches the regex[Ee]rror.
- Example:
-
Regex Filter with Comma-Separated Values: Matches records based on multiple regular expressions separated by commas. The filter acts as an OR condition.
- Example:
UPI[0-9]+[a-z], Er[a-zA-Z]will match records containing text that satisfies eitherUPI[0-9]+[a-z]orEr[a-zA-Z].
- Example:
-
-
- After providing the necessary details, click on the Capture button. During debugging, the system uses actual data arriving at the input of the corresponding pipeline, depending on the configured options on the left side of the Debug page. The data employed in debugging is filtered and processed based on the specified parameters, allowing users to assess how real data would be handled in the pipeline. This approach provides an authentic simulation of real-world scenarios without impacting live ContextStreams.
- The Data Preview tab on the right side of the page will display Input and Output Events. Analyze these fields to ensure that data processing is occurring as expected. If not, make necessary adjustments to the pipeline for proper data contextualization.
- For instance, observe the additional fields added in the output stream post-contextualization with the data pipeline, as illustrated above.
- Additionally, check the “Error Logs” and "All Logs" tab to analyze detailed logs and debug the behavior of the data pipeline effectively.
This debugging feature provides insights into the processing steps and allows users to identify and rectify any issues, ensuring smooth and accurate data contextualization within the pipeline.
