Alerts Dashboard
In addition to the Alert Console page, multiple alert Storyboards are present in the system to give deeper visibility into alert notifications generated by the system. In addition, users can create new Alert storyboards to suit specific requirements.
Accessing Alert Dashboards
To access the Alert Dashboard Monitoring Dashboard:
- Navigate to the left navigation menu and click on Dashboards.
- Run a search for the Alert-KPI Folder.
- Click on the respective Alert Dashboards to access it.
Alert KPI
This dashboard is pre-built and readily available for you. It highlights the following.
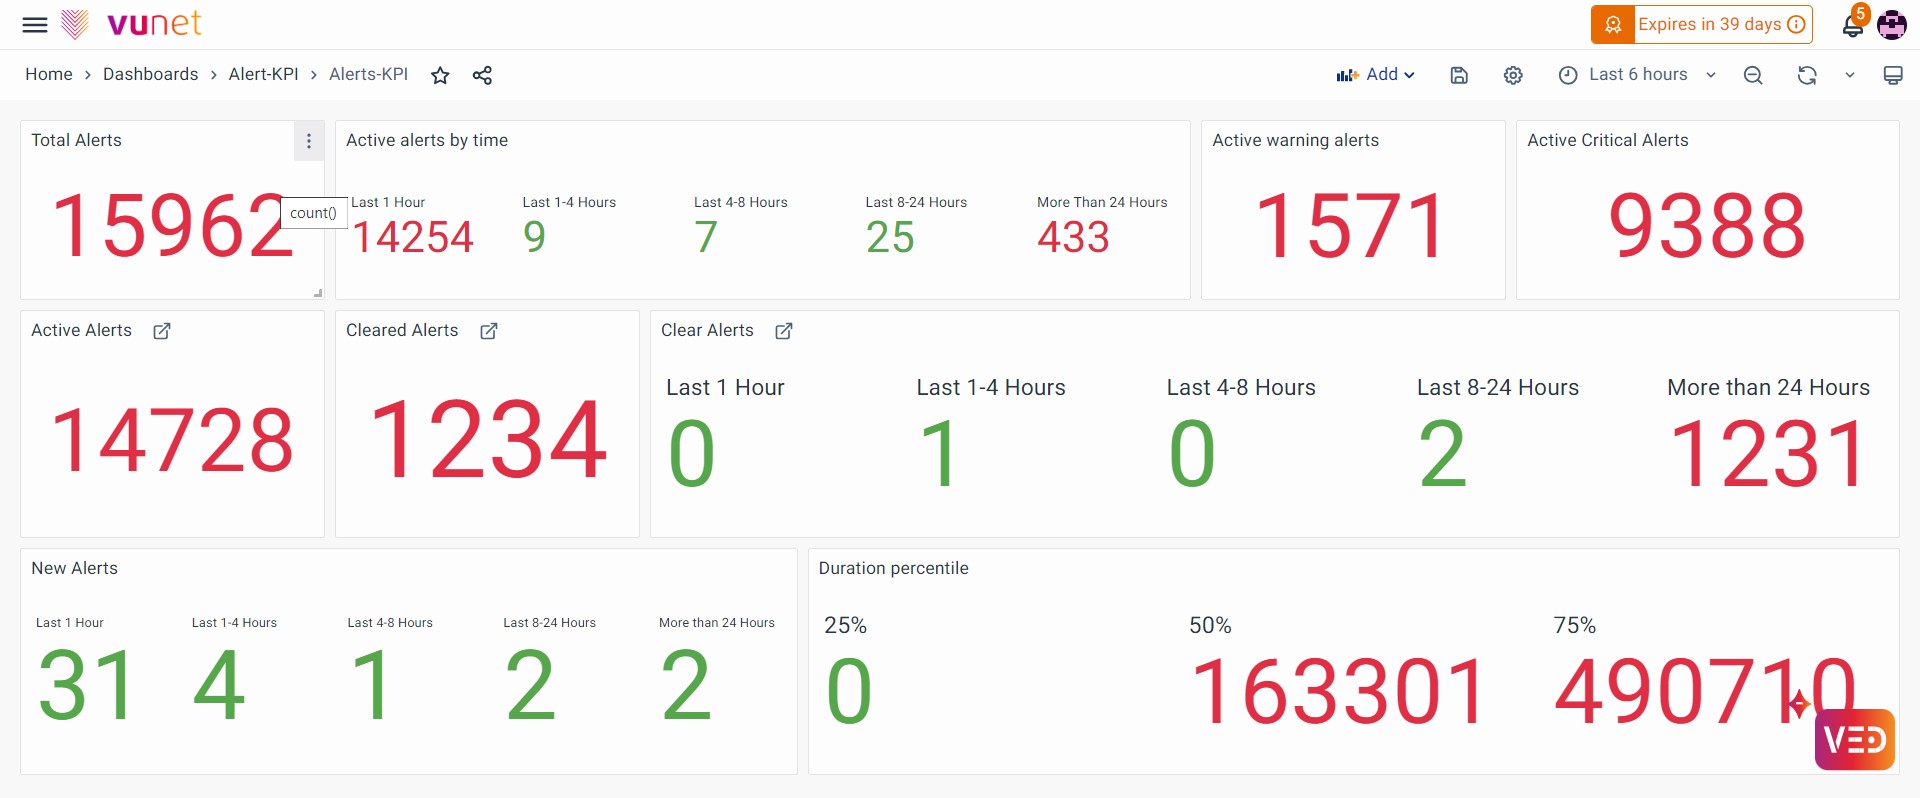
- Total Alerts: This refers to the overall number of alerts generated within a specified period of time, indicating the total count of events that trigger notifications or actions based on predefined conditions or thresholds.
- Total Active Alerts: The current count of alerts that are currently active or unresolved.
- Total Active Alerts by Time: Breakdown of active alerts based on the time elapsed since their activation, such as within the last 1 hour, 1-4 hours ago, 4-8 hours ago, 8-24 hours ago, and more than 24 hours ago.
- Total Active Warning Alerts: The count of active alerts is categorized as warnings, indicating potential issues that require attention.
- Active Critical Alerts: The count of active alerts categorized as critical, highlighting severe issues that demand immediate action.
- Cleared Alerts: The total count of alerts that have been resolved or cleared.
- Cleared Alerts by Time: Breakdown of cleared alerts based on the time elapsed since their resolution, such as within the last 1 hour, 1-4 hours ago, 4-8 hours ago, 8-24 hours ago, and more than 24 hours ago.
- New Alerts by Time: Breakdown of newly generated alerts based on the time they were triggered, such as within the last 1 hour, 1-4 hours ago, 4-8 hours ago, 8-24 hours ago, and more than 24 hours ago.
- Duration Percentile: Statistical measure indicating the percentage of alerts resolved within a specific duration, providing insight into the efficiency of the alert resolution process.
Alert Details
This dashboard is pre-built and readily available for you. It highlights 4 important areas in detail.
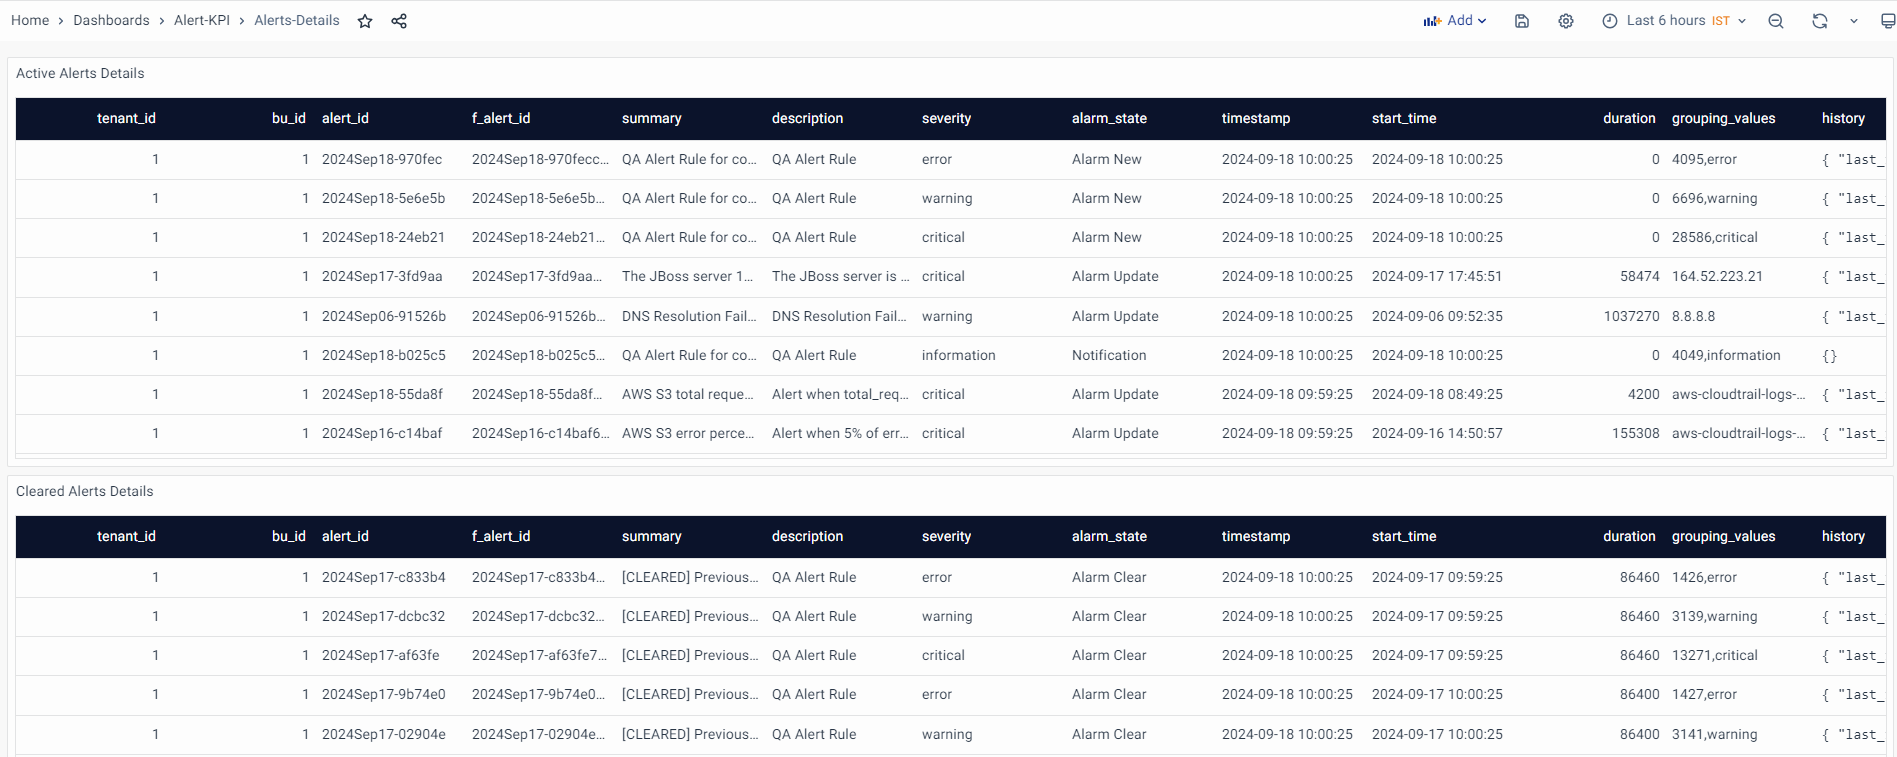

Active Alert Details: Information about currently active alerts, including their unique identifier, summary, description, severity, current state, and timestamps indicating when they were triggered or last updated.
Cleared Alert Details: Details regarding alerts that have been cleared or resolved, containing their unique identifier, summary, description, severity, state after resolution, and timestamps indicating when they were cleared.
Alert Rule-Name-based Percentile: A statistical view presenting percentiles (e.g., 25th, 50th, 75th) of alert occurrences based on specific alert rule names. It helps in understanding the distribution of alerts triggered by different rules.
Summary-based Percentile View: A statistical view providing percentiles (e.g., 25th, 50th, 75th) of alert occurrences based on alert summaries or descriptions. It offers insights into the distribution of alerts based on their content or nature.
