System Metrics Dashboard
Gathering detailed system metrics is crucial to enhance your real-time monitoring and analysis. These metrics offer valuable insights into your system's performance and overall health. By exploring a wide range of metrics, you'll better understand how efficient and reliable your system is.
Use pre-configured dashboards to gain valuable insights into platform operations. The system metrics feature transforms operational data into actionable intelligence, offering a simple yet comprehensive view of various metrics, from development activities to observability data.
Accessing the System Metrics
- To access the system metric navigate to the left navigation menu > Dashboards
- On clicking the Dashboards run the search for the System Metrics.
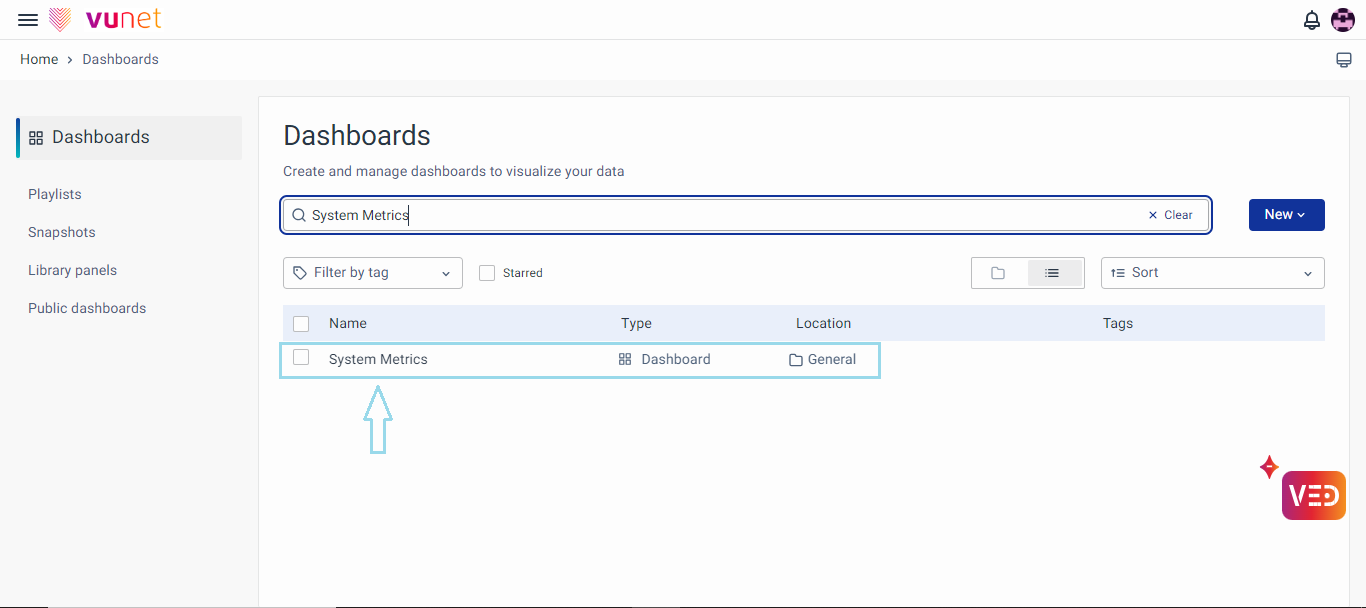
- On clicking the System Metrics, you will be redirected to the System Metrics Dashboard.
In the dashboard, the metrics are organized into distinct categories, each representing a crucial aspect of your system's performance and operations. This categorization not only makes it easier to navigate and understand the data but also allows for targeted analysis and monitoring. Each category encompasses a set of specific metrics, finely tuned to provide detailed insights into various functionalities and performance indicators of your system.
This category is instrumental in assessing active engagement with various observability tools and the effectiveness of these tools in providing actionable insights. It covers a wide range of metrics related to the generation, utilization, and impact of the observability features, offering a comprehensive view of system monitoring and response behaviors.
Data Volume
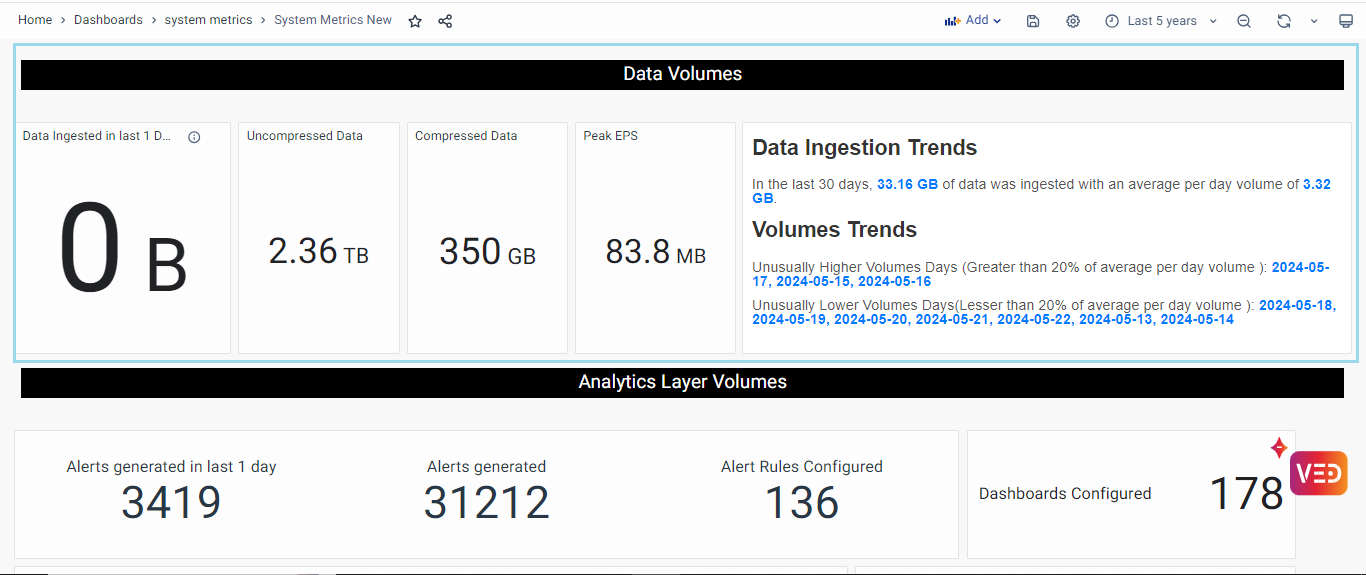
Data Volumes encompasses the following Metrics panels showcasing the details for the selected time range:
- Data Ingested in last 1 Day: This panel represents the total amount of data ingested in last one day.
- Uncompressed Data: It represents the total size of Uncompressed click house data that is stored on disk
- Compressed Data: It represents the total size of compressed click house data that is stored on disk
- Peak EPS: This panel provides the value of Peak EPS data in the selected time range.
- Data Ingested Trends: This panel represents the total amount of data ingested for the selected time range.
Analytics Layers Volumes
Analytics Layer Volumes offers a preconfigured panel showcasing the activity and configuration within the analytics layer, including user settings, roles, alert rules, dashboards, reports, and templates.
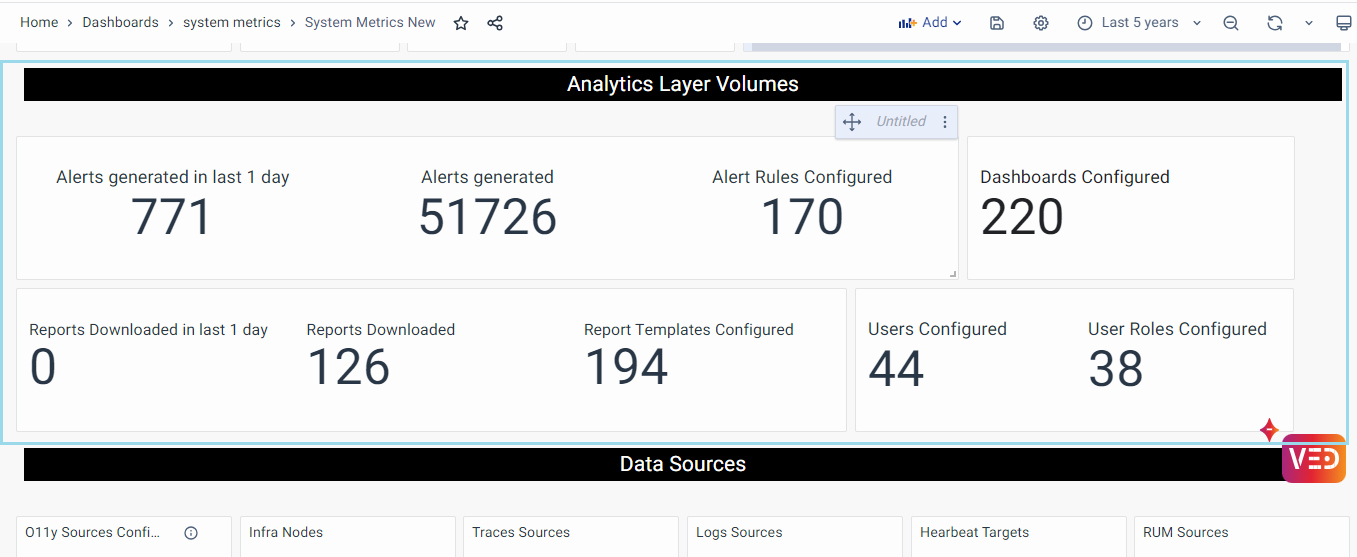
Analytics Layers Volumes encompasses the following Metrics panels showcasing the details for the selected time range:
- Alert Generated in last 1 day: The panel showcases the total number of Alert Generated in last 1 day.
- Alert Generated: The panel showcases the total number of Alert Generated in selected time range.
- Alert Rule Configured: This panel shows the count of Alert Rules in the system.
- Dashboards Configured: This panel counts the total number of configured dashboards in the selected time range.
- Report Downloaded in last 1 day: The panel showcases the total number of Reports downloaded in last 1 day.
- Reports Downloaded:The panel showcases the total number of Reports downloaded in the selected time range.
- Reports Template Configured: It showcases the total number of Reports templates configured
- User Configured: This panel showcases the total number of users added to the system.
- User Role Configured: This represents the count of user roles added to the system.
Data Source
This section centers around metrics that shed light on the diversity and extent of data sources integrated into our system. These metrics are pivotal in understanding the breadth of data inputs and the variety of sources contributing to the system's observability landscape. By tracking the types and quantities of data sources, this category provides insights into the system's capability to gather comprehensive data from multiple points, which is essential for a robust observability strategy.
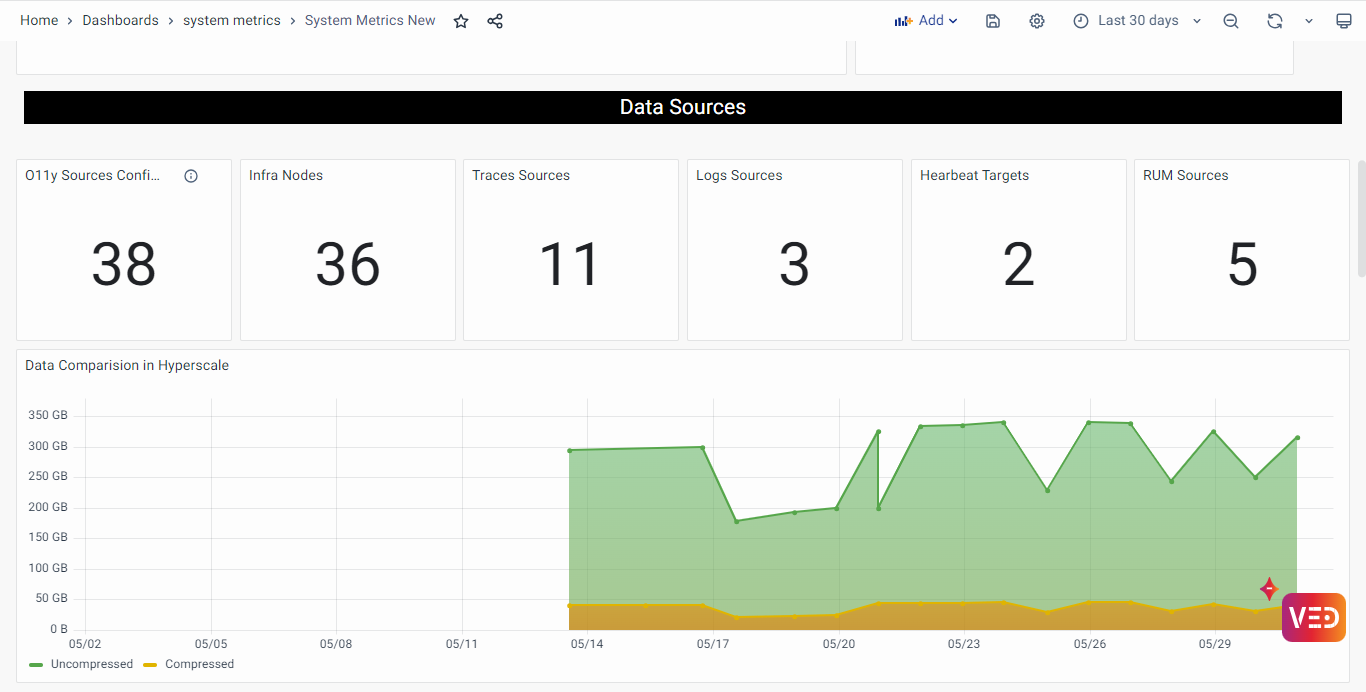
Data Sources encompasses the following Metrics panels showcasing the details for the selected time range:
- O11ySources Configured: This metric quantifies the total count of data sources across all observability sources (O11ySources), indicating integration capacity and data diversity.
- Infra Node: This panel represents the total number of infrastructure nodes within the system.
- Traces Source: This panel represents the count of sources from which distributed tracing data is collected within the system.
- Logs Source: This panel displays the various sources from which logs are generated and collected within the system.
- Netflow Sources: This metric tracks the count of data sources categorized as 'vunetflow' within all O11ySources, crucial for network traffic analysis, reflecting the system's focus on network monitoring and depth of data analysis.
- Heartbeat Target: The count of data sources labeled as 'vuheartbeat' in all O11ySources is captured by this metric. It is essential for continuous monitoring and verification of operational status across various components or services.
- RUM Source: The numeric value displayed in this panel represents the count or total number of Real User Monitoring (RUM) sources actively providing data within the system.
- Data Comparision in hyperscale: This panel showcase the comparison between uncompressed and compressed data.
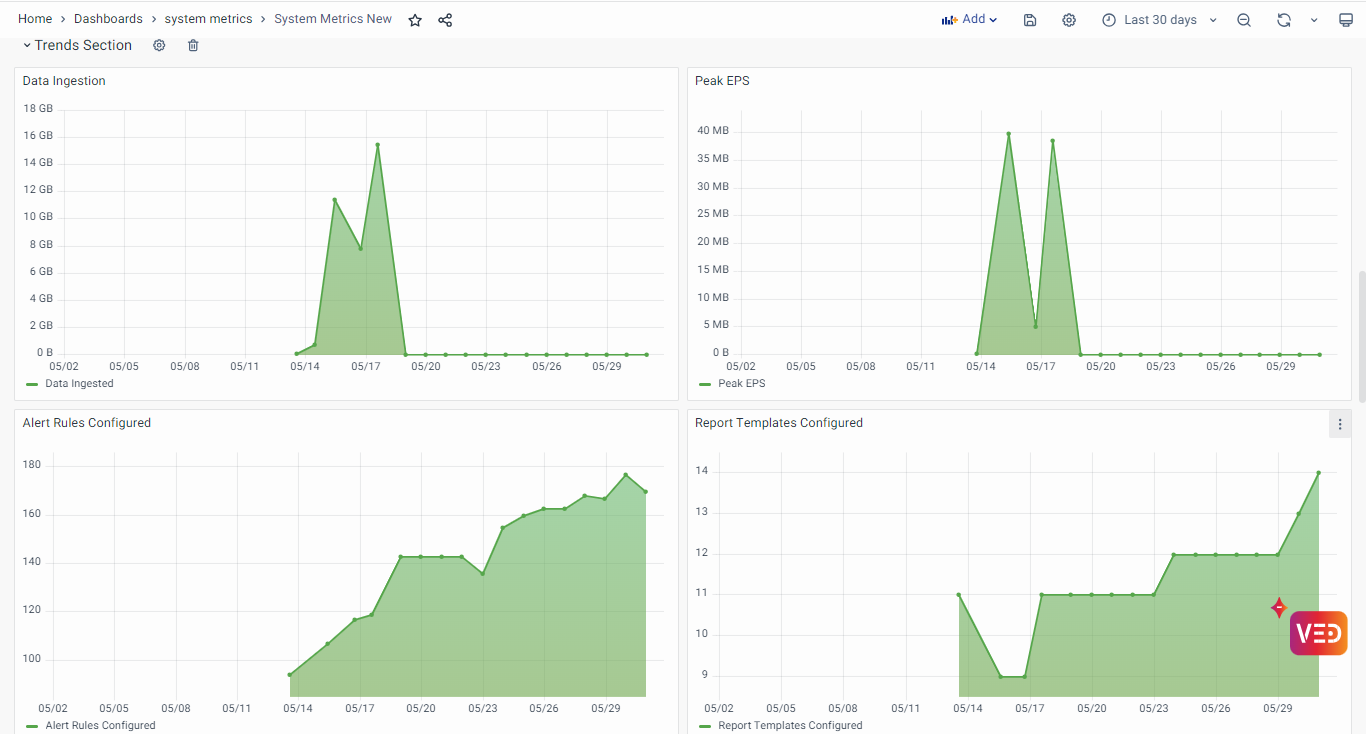
Trend Selection
Trend selection panel section consist of fourteen panels, each showcases the graphical panel display the trends of system metric data in the selected time range.
The displayed panels include:
- Data Ingestion
- Peak EPS
- Alert Rules Configured
- Report Templates Configured
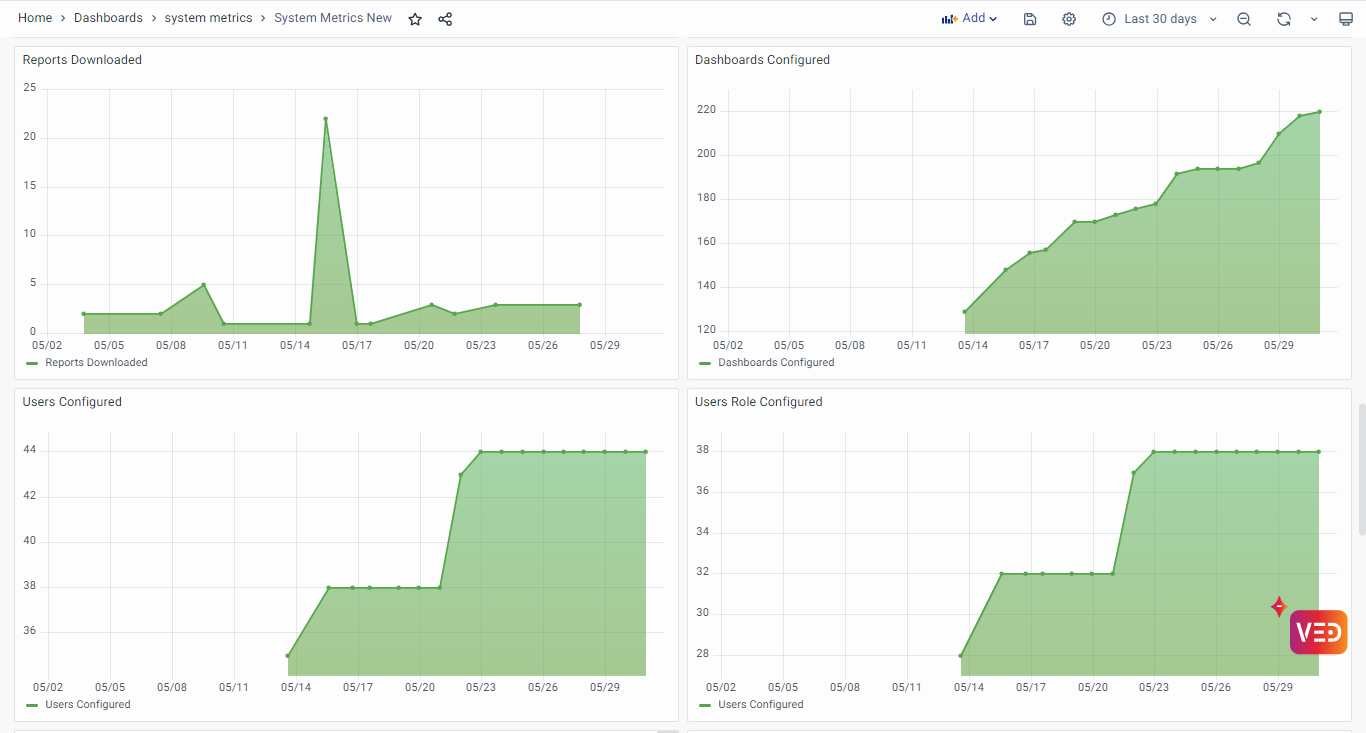
- Reports Downloaded
- Dashboards Configured
- User Configured
- User Role Configured
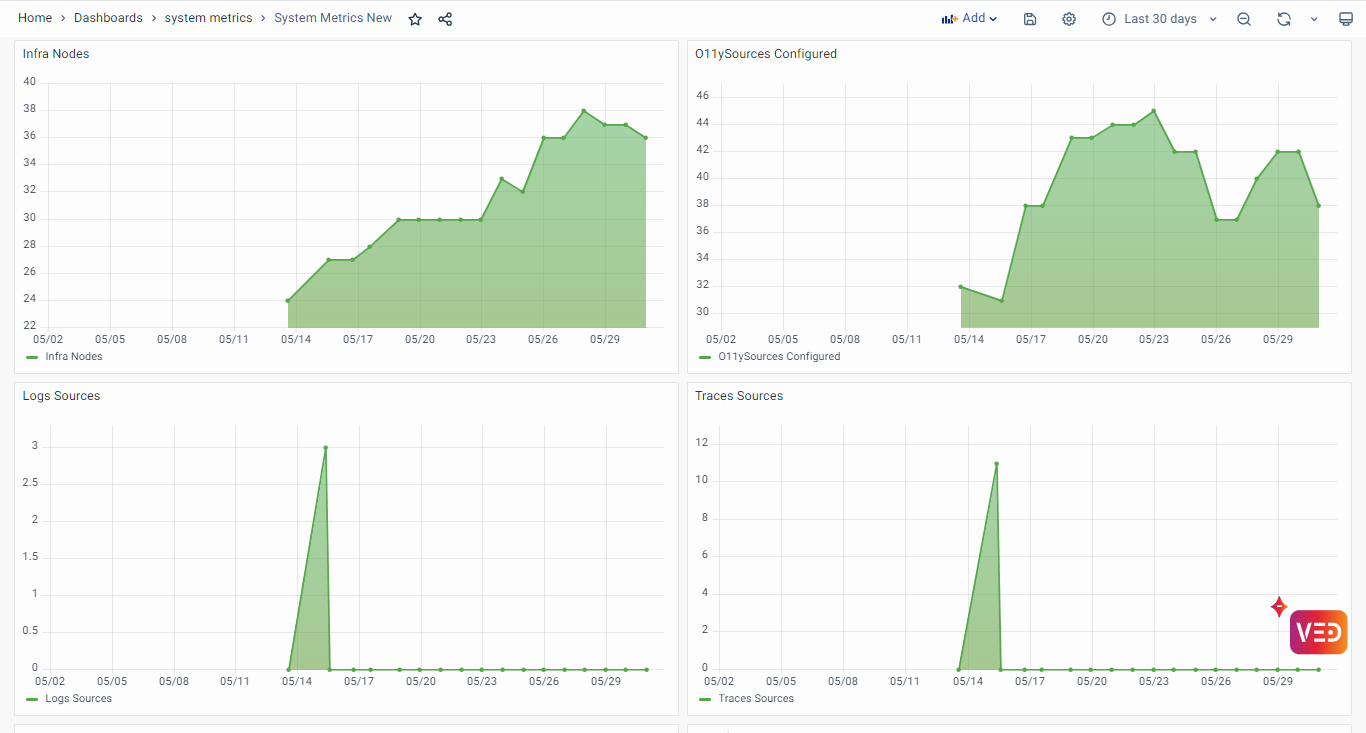
- Infra Nodes
- O11ySources Configured
- Logs Sources
- Traces Sources
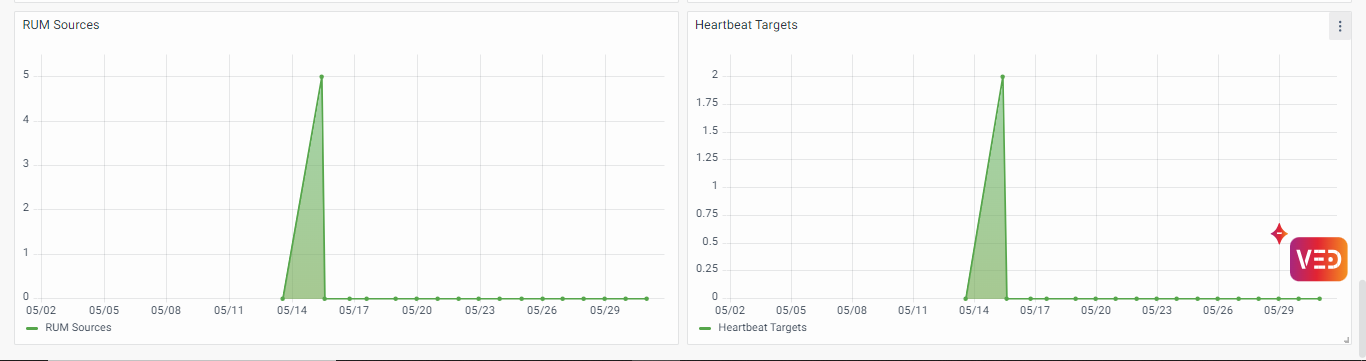
- RUM Sources
- Heartbeat Targets
Conclusion
Efficient real-time monitoring and analysis rely on the comprehensive collection and interpretation of system metrics. This user guide has provided insights into accessing and interpreting these metrics through our dashboard interface. By leveraging pre-configured dashboards and organized metric categories, users can gain valuable insights into their platform operations and make informed decisions to optimize system performance effectively.
