Template Breakdown
HTML Template Breakdown
The configuration for the HTML template consists of
- A Python script interface that makes use of the Data Models added above to generate the value.
- An HTML template / visual editor to display the above value.
The Python script interface for the HTML template comes with predefined variables:
- VALUE - A dict used to store multiple variables and their values as keys and values.
- LINK - A variable that can link Insights to Dashboards or Events.
The Python script has access to the contents of the Data Models selected in the configuration. For example, the formatted data value inside a Data Model can be accessed in the script using the following syntax.
DM[‘<DM_Label_name>’][‘<list_index>’][‘<metric_label>’]
The link variable will redirect you to a dashboard or an event. The link can be configured with the Python script interface.
For example, if you want to drill down to the dashboard/event already configured in the Data Model we can use
LINK = DM['DM_NAME']['METRIC_NAME']['view_more']
Or you can directly assign the dashboard name to the LINK variable.
LINK = ‘Dashboard Name’
Template Scripting for HTML Templates:
For Templates, we are using mustache syntax for HTML. The important part is accessing data in the VALUE dictionary from the HTML Script. To do that all we have to do is put two curly braces around the key whose value we want to access.
For example in Python, you will assign values like this
# Assign the determined color and state values to the VALUE dictionary
VALUE['color'] = ‘Red’
VALUE['state'] = ‘Bad’
This Mustache template is a simple HTML structure designed to dynamically incorporate values from your program, particularly from the VALUE dictionary, into the HTML output. Let's break it down:
<div class="insight_card" style="background-color:{{color}}">:
This div represents the outer container of your insight card.
class="insight_card" is a class attribute for styling purposes, providing a common style to elements with this class. style="background-color:{{color}}" sets the background color dynamically based on the value stored in the color variable from your Python code.
<div class="insight_value">{{{state}}}</div>:
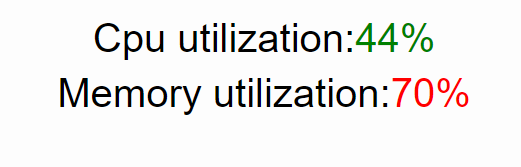
Changing the Color and Font of a Text
Here is an example of how to change colors and fonts using HTML.
VALUE['cpu_title'] = 'Cpu utilization'
VALUE['cpu_pct'] = '44%'
VALUE['cpu_pct_color'] = 'Green'

VALUE['mem_title'] = 'Memory utilization'
VALUE['mem_pct'] = '70%'
VALUE['mem_pct_color'] = 'Red'
<div class="insight_card">
    <div class="insight_value">
        {{cpu_title}}:
        <span style="color: {{cpu_pct_color}}">{{cpu_pct}}</span>
    </div>
    <div class="insight_value">
        {{mem_title}}:
        <span style="color: {{mem_pct_color}}">{{mem_pct}}</span>
    </div>
</div>
Output:
Creating a Bar Graph in the Insight
Here’s an example of How to create Bar Graph Insights for Top 5 Severity Distribution.
Now, we can use labels and attribute them to Data Models and Variables. In the future, new Data Models and Variables can be used without having to amend the entire code.
Data Model Configuration: It is recommended to include 1 categorical column and 1 metric count column in the Data Model.
Example:
Data Model Label: dm1
Variable Label: category_column and count_column
In the Variables section:
-
category_column: Refers to the name of the categorical column in the Data Model. -
count_column: Represents the name of the count column in the Data Model
Script:
error = False
error_msg = ""


if len(DM) > 0:
    is_data = True
    if "dm1" in DM:
        data = DM['dm1']
        category_column = VAR.get('category_column', None)
        count_column = VAR.get('count_column', None)
        if category_column is None and count_column is None:
            error = True
  error_msg = "Variables category_column and count_column is to be added."
        elif category_column is None:
            error = True
            error_msg = "Variables category_column is to be added."
        elif count_column is None:
            error = True
            error_msg = "Variables count_column is to be added."
        else:
            if category_column == count_column:
                error = True
                error_msg = "Variables category_column and count_column are the same."
            else:
                dm_columns = []
                if len(data) > 0:
                    dm_columns = list(data[0].keys())
                    if category_column not in dm_columns and count_column not in dm_columns:
                        error = True
                        error_msg = "Columns " + category_column +  " and " + count_column + " is not in the data model; Available Columns are " + ", ".join(dm_columns)
                    elif category_column not in dm_columns:
                        error = True
                        error_msg = "Column " + category_column + " is not in the data model; Available Columns are " + ", ".join(dm_columns)
                    elif count_column not in dm_columns:
                        error = True
                        error_msg = "Column " + count_column + " is not in the data model; Available Columns are " + ", ".join(dm_columns)
                    else:
                        dm0 = data[0]
                        if not isinstance(dm0[category_column], str) and isinstance(dm0[count_column], str):
                            error = True
                            error_msg = "Column " + category_column + " is not a string, expected to be a string column; Column " + count_column + " is a string, expected to be a numeric."
                        elif not isinstance(dm0[category_column], str):
                            error = True
                            error_msg = "Column " + category_column + " is not a string, expected to be a string column."
                        elif isinstance(dm0[count_column], str):
                            error = True
                            error_msg = "Column " + count_column + " is a string, expected to be a numeric."
                        else:
                            no_of_bars = VAR.get('no_of_category_to_show', None)
                            bar_data = []
                            total = 0
                            for i in range(len(data)):
                                bar_data.append([data[i][category_column], data[i][count_column]])
                                total += data[i][count_column]

                            bar_data.sort(key=lambda x: x[1], reverse = True)


                            if no_of_bars is None:
                                no_of_bars = len(bar_data)
                                title = category_column.title() + " distribution"
                            else:
                                title = "Top " + str(no_of_bars) + " " + category_column.title() + " distribution"


                            out_data = []
                            for i in range(len(bar_data)):
                                if i < no_of_bars:
                                    out_data.append({
                                        "category": bar_data[i][0].title(),
                                        "pct": str(round((bar_data[i][1]/total)*100, 2)) + "%"
                                    })
                                else:
                                    break
                            VALUE['out_data'] = out_data
                            VALUE['title'] = title
    else:
        error = True
        error_msg = "Data model is expected to have 'dm1' key"
else:
    is_data = False

VALUE['is_data'] = is_data
VALUE['error'] = error
VALUE['error_msg'] = error_msg
HTML Template:
<style>
.bar-card{
position:absolute;
top: 0;
left: 0;
padding-top: 10px;
padding-left: 15px;
inset: 0;
font-family: 'Inter-Medium', sans-serif;
}
.decline_heading {
font-size: 15px;
}
.bar_table{
padding-top: 6px;
width:100%;
align-items: left;
text-align: left;
border-collapse: separate;
border-spacing: 10px
}
.bar_table_head, .bar_distribution_data{
padding-top: 2px;
}
.bar_distribution{
text-align: right;
padding-right: 5px;
width: 10%;
white-space: nowrap;
overflow: hidden;
text-overflow: ellipsis;
}
.uei_cat_bar{
border-radius: 20px;
text-align: right;
padding-right: 5px;
}
.error_div {
color: #ba3939;
background: #ffe0e0;
border: 1px solid #a33a3a;
padding: 5px;
}
.no_data_div {
color: #204a8e;
background: #c9ddff;
border: 1px solid #4c699b;
padding: 5px;
text-align: center;
}
.bar_title {
font-size: 16px;
font-weight: bold;
}
</style>
{{^error}}
<div class="bar-card">
<div class="bar_title">
{{title}}
</div>
<table class="bar_table">
{{#out_data}}
<tr class="bar_distribution_data">
<td class="bar_distribution">{{category}}</td>
<td style="width: 80%; background-color: #c9ddff; border-radius: 10px;">
<div style="display: flex;">
<div class="uei_cat_bar" style="background-color:#4075C5 ; width:{{pct}};">
</div>
<!-- <div style="float: left; padding-left: 5px; font-weight: bold;">
{{pct}}
</div> -->
</div>
</td>
<td>
<div style="float: left; padding-left: 5px; font-weight: bold;">
{{pct}}
</div>
</td>
</tr>
{{/out_data}}
</table>
</div>
{{^is_data}}
<div class="no_data_div">
<span style="font-weight: bold;">No Data</span><br>
</div>
{{/is_data}}
{{/error}}
{{#error}}
<div class="error_div">
<span style="font-weight: bold;">Error:</span><br>
{{error_msg}}
</div>
{{/error}}
Output: 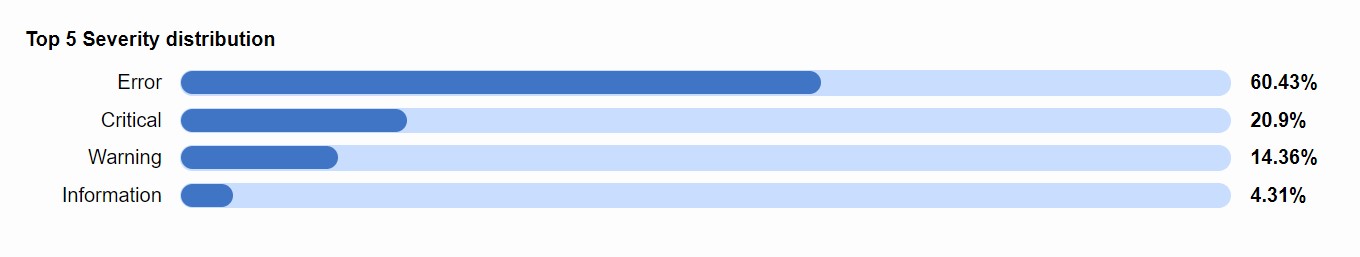
Creating an Insight Chart.js
Insights allow you to use a charting library Chart.js to create charts and tables. Here’s an example of How to create tables in insight visualization.
Script:
data = DM['Chart_ex1']

day_arr = ["Sunday", "Monday", "Tuesday", "Wednesday", "Thursday", "Friday", "Saturday"]
val_arr = [0] * 7
for item in data:
    val_arr[day_arr.index(item.get("day"))] = item.get("count")

VALUE['chart_label'] = day_arr
VALUE['chart_value'] = val_arr
Template:
<script type="text/javascript" src="/assets/Chart.js"></script>
<canvas id="myChart" width="400" height="400"></canvas>
<script>
var ctx = document.getElementById('myChart').getContext('2d');
var myChart = new Chart(ctx, {
    type: 'bar',
    data: {
        labels: ['Red', 'Blue', 'Yellow', 'Green', 'Purple', 'Orange'],
        datasets: [{
            label: '# of Votes',
            data: [12, 19, 3, 5, 2, 3],
            backgroundColor: [
                'rgba(255, 99, 132, 0.2)',
                'rgba(54, 162, 235, 0.2)',
                'rgba(255, 206, 86, 0.2)',
                'rgba(75, 192, 192, 0.2)',
                'rgba(153, 102, 255, 0.2)',
                'rgba(255, 159, 64, 0.2)'
            ],
            borderColor: [
                'rgba(255, 99, 132, 1)',
                'rgba(54, 162, 235, 1)',
                'rgba(255, 206, 86, 1)',
                'rgba(75, 192, 192, 1)',
                'rgba(153, 102, 255, 1)',
                'rgba(255, 159, 64, 1)'
            ],
            borderWidth: 1
        }]
    },
    options: {
        scales: {
            yAxes: [{
                ticks: {
                    beginAtZero: true
                }
            }]
        }
    }
});
</script>
Output: 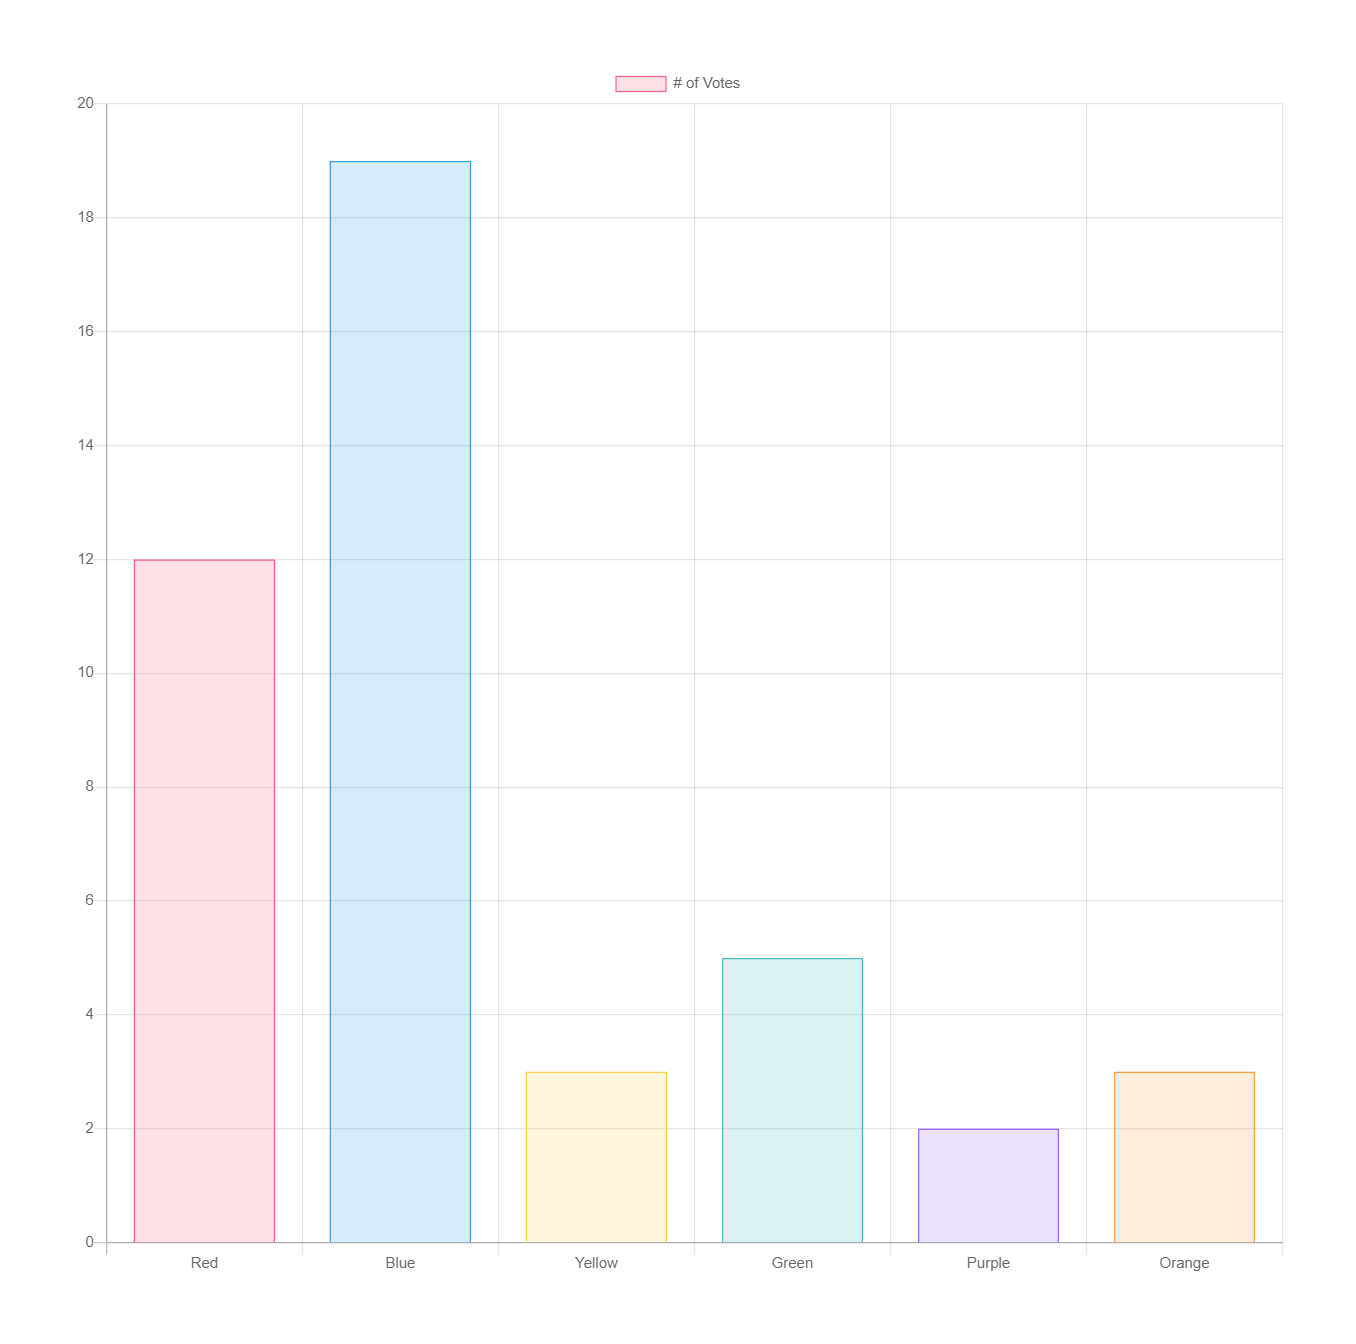
Creating Tables and Lists in the Insight
Here’s an example of how to create tables in insight visualization-
Data Model Configuration
DM Label: Alert Count Table
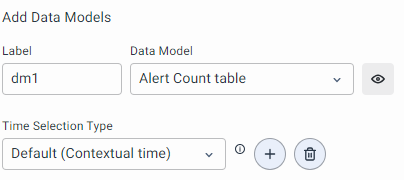
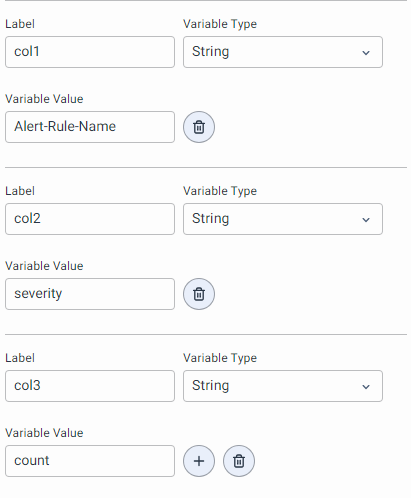
Variable Configuration
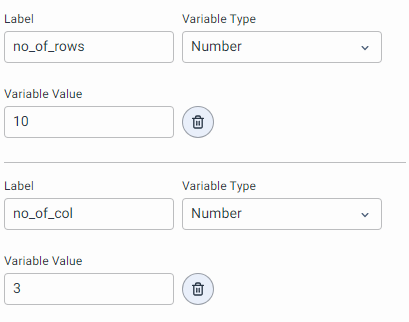
Script:
dm = DM['dm1']
no_of_rows = VAR.get('no_of_rows', 5)
no_of_col = VAR.get('no_of_col', None)


error = False
error_msg = ""
table_data = []
if no_of_col is None:
    error = True
    error_msg = "Varaiable 'no_of_col' nor found"
else:
    column_names = [VAR['col'+str(i)] for i in range(1, no_of_col+1)]
    if len(dm) > 0:
        dm_keys_len = len(dm[0].keys())
        if dm_keys_len >= len(column_names):
            for i in range(len(dm)):
                if i < no_of_rows:
                    cell_data = []
                    for column in column_names:
                        cell_data.append({
                            "cell_value": dm[i][column]
                        })
                    table_data.append({
                        "row": cell_data
                    })
                else:
                    break


table_heading = [{"column_name": column} for column in column_names]


VALUE['table_heading'] = table_heading
VALUE['table_data'] = table_data
HTML Template:
<style>
  .table-container{
      width: 100%;
      overflow-x: auto;
      box-shadow: 0 0 10px rgba(0,0,0,0.25);
      border-radius: 10px;
      font-family: 'Inter-Medium', sans-serif;
  }


  .insight_table{
      width: 100%;
      border-collapse: collapse;
      table-layout: fixed;
  }


  .insight_table th, .insight_table td{
      text-align: left;
  }


  .insight_table td {
      text-align: left;
      border-bottom: 1px solid #f2f2f2;
      color: #000000;
      font-size: 15px;
      color: #666;
      line-height: 1rem;
      font-weight: unset!important;
      padding-top: 10px;
      padding-bottom: 10px;
      padding-left: 20px;
      border-bottom: 1px solid #f2f2f2;
      word-wrap: break-word;
  }


  .insight_table th {
      font-size: 18px;
      color: #fff;
      line-height: 0.5;
      font-weight: unset!important;
      padding-top: 19px;
      padding-bottom: 19px;
      padding-left: 20px;
      background-color: #6c7ae0;
      border-bottom: 3px solid #6c7ae0;
      border-top: 3px solid #6c7ae0;
      font-size: 1.2em;
      height: 5px;
  }


  .insight_table tbody tr:hover {
      background-color: #ECECFF;
  }
</style>
<div class="table-container">
  <table class="insight_table">
    <thead>
      <tr>
        {{#table_heading}}
          <th>{{column_name}}</th>
        {{/table_heading}}
      </tr>
    </thead>
    <tbody>
      {{#table_data}}
      <tr>
        {{#row}}
        <td>{{cell_value}}</td>
        {{/row}}
      </tr>
      {{/table_data}}
    </tbody>
  </table>
</div>
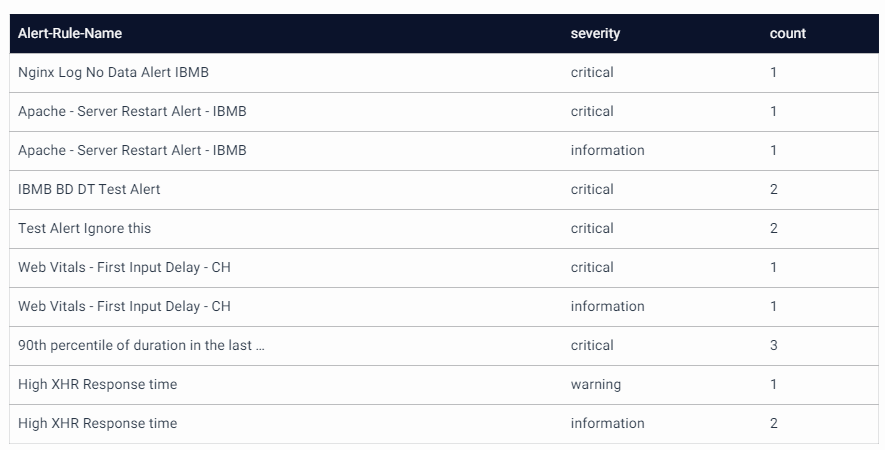
Output:
Markdown Template breakdown
Just like HTML, scripting in this template also has 2 parts. The first is Script and the second is the Template.
The idea is to use Script which would be a Python script to store values in the VALUE dictionary or list and later use Template which would be a markdown script to access and display those values in the insight visualization.
Template Scripting for Markdown Template
Just like in HTML Template, to access the values from the VALUE dictionary all we have to do is put two curly braces around the key to whose value we want to access. The rest is just Markdown syntax.
Example
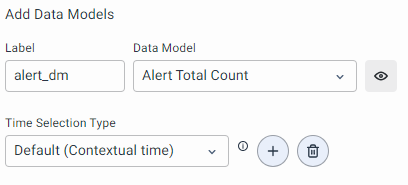
Data Model
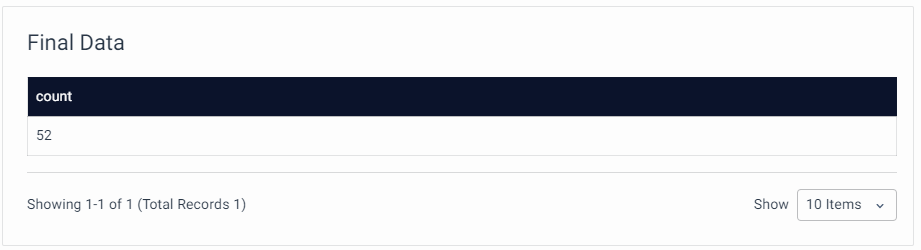
Name: Alert Total Count
Created a Datamodel which gives me a count of Alert in the selected period. The Final Data looks like this.
Insight
DM config
We configure it to the key alert_dm
Python code
# Retrieve the 'alert_dm' data from the DM
alert_dm = DM.get('alert_dm', [])

# Check if the 'alert_dm' list is not empty
if len(alert_dm) > 0:
    # If not empty, extract the 'count' value from the first element of 'alert_dm'
    alert_count = alert_dm[0]['count']
else:
    # If 'alert_dm' is empty, set 'alert_count' to 0
    alert_count = 0

# Assign the determined 'alert_count' value to the 'alert_count' key in the 'VALUE' dictionary
VALUE['alert_count'] = alert_count
Markdown template
# Total Alerts

## {{alert_count}}
This Markdown template is designed to display information about the total number of alerts. Here's an explanation:
-
# Total Alerts:This is a top-level heading, indicated by the # symbol. It serves as the main title for the section and suggests that the content following it will be related to total alerts. -
## {{alert_count}}:This is a second-level heading, indicated by ##. It's a subsection under the main heading, providing more specific information. The{{alert_count}}is a placeholder, suggesting that the actual value of the total alerts will be dynamically inserted when rendering the Markdown document. This dynamic insertion is commonly used in template systems where values are substituted at runtime.
When this Markdown template is processed, the {{alert_count}} placeholder will be replaced with the actual value of the total alerts.
For example, if alert_count is 133, the rendered output will be:

