Mobile Dashboard Configuration
Mobile Dashboard Configuration is a page used for creating and managing Mobile Dashboards and then adding Mobile Visualizations to the Dashboard. As web-based visualizations can’t be directly visualized on mobile.
The vuSmartMaps platform supports a Mobile Application for viewing certain visualizations like KPI, Table, Charts, and Insights. You can configure the dashboards and visualizations for Mobile Application using Mobile Dashboard Configuration.
To access Mobile Dashboard: Left Navigation menu > Configure Observability > Mobile Dashboard.
On clicking, you will be redirected to the Mobile dashboard landing page.
Accessing the Mobile Dashboard tab allows you to initiate the following configuration actions.
-
Mobile Dashboard Listing Page:
- View, edit, or delete existing Mobile Dashboards.
- Add new Mobile Dashboards.
-
Mobile Dashboard Configuration Page:
- Customize the Dashboard name and description.
- Enable or disable Dashboards.
- Add Visualizations, specifying type and data model.
-
- Ensure metrics are included for mobile app display.
- KPI needs numerical aggregation with no groupings.
- Charts require time-series data.
- Table visualizations require grouping fields without metric overlap.
-
Import/Export Mobile Dashboards:
- Easily manage Dashboards with 'Import' and 'Export' buttons.
- Prevent duplicates when importing Mobile Dashboards.
Configure Mobile Dashboards and Visualizations for a seamless mobile experience with vuSmartMaps Mobile Application.
The detailed steps for Mobile Dashboard configuration are as follows:
Mobile Dashboard Listing Page
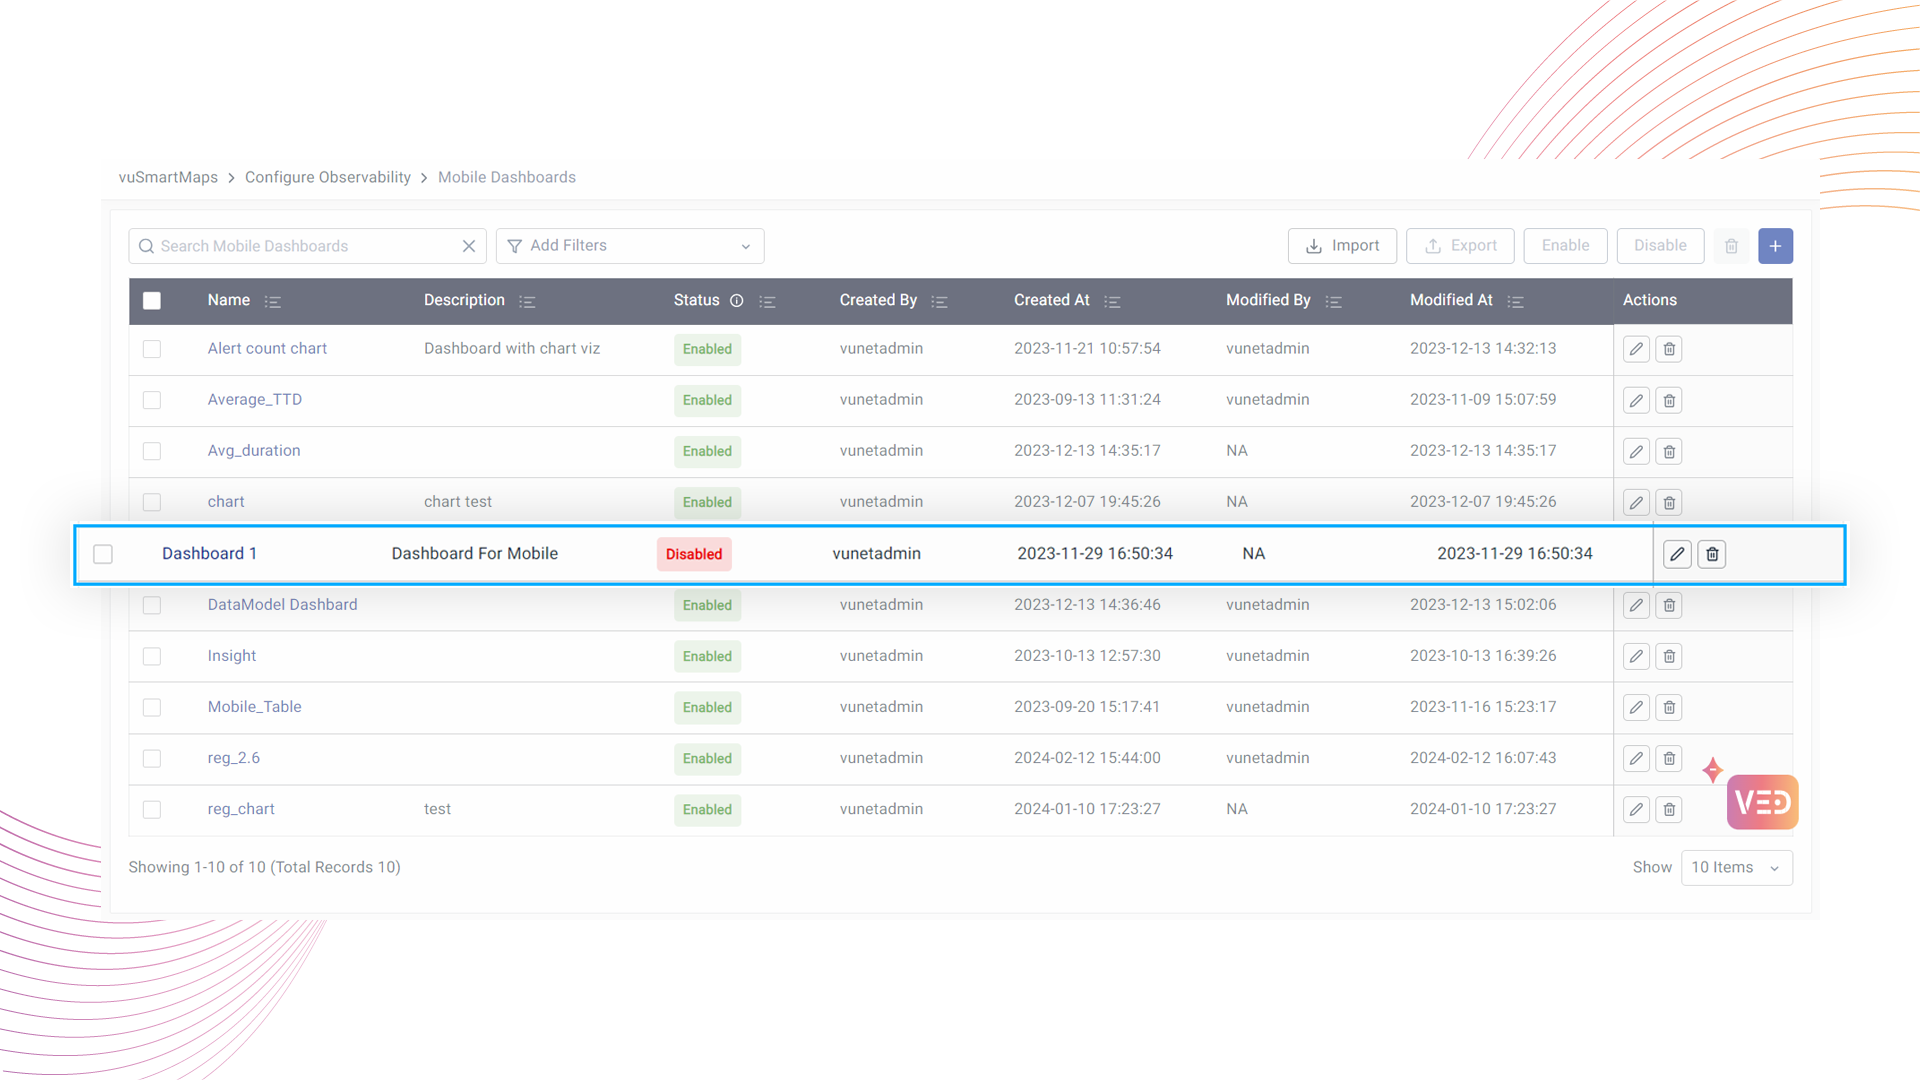
After selecting the Mobile Dashboard tab, you'll see a list of existing Mobile Dashboards.
This landing page has the following items:

- A table containing the list of Dashboards.
- Description: The description of the Dashboard.
- Status of the Dashboards (Enabled/Disabled): Only if a Dashboard is enabled then it will be shown in the Mobile Application, even though the dashboard has been assigned to the mobile user.
- Created By: The information on the user who originally created the Dashboard.
- Created At: The information on the date and time when the Dashboard was originally created.
- Modified By: The information on the user who modified the Dashboard recently.
- Modified At: The information on the date and time when the Report was modified.
- Actions: Edit and Delete option for the Dashboard.
- Click on the + icon to add a Mobile Dashboard. It will redirect to the Mobile Dashboard Configuration page.
- Enter the details of the mobile dashboard.
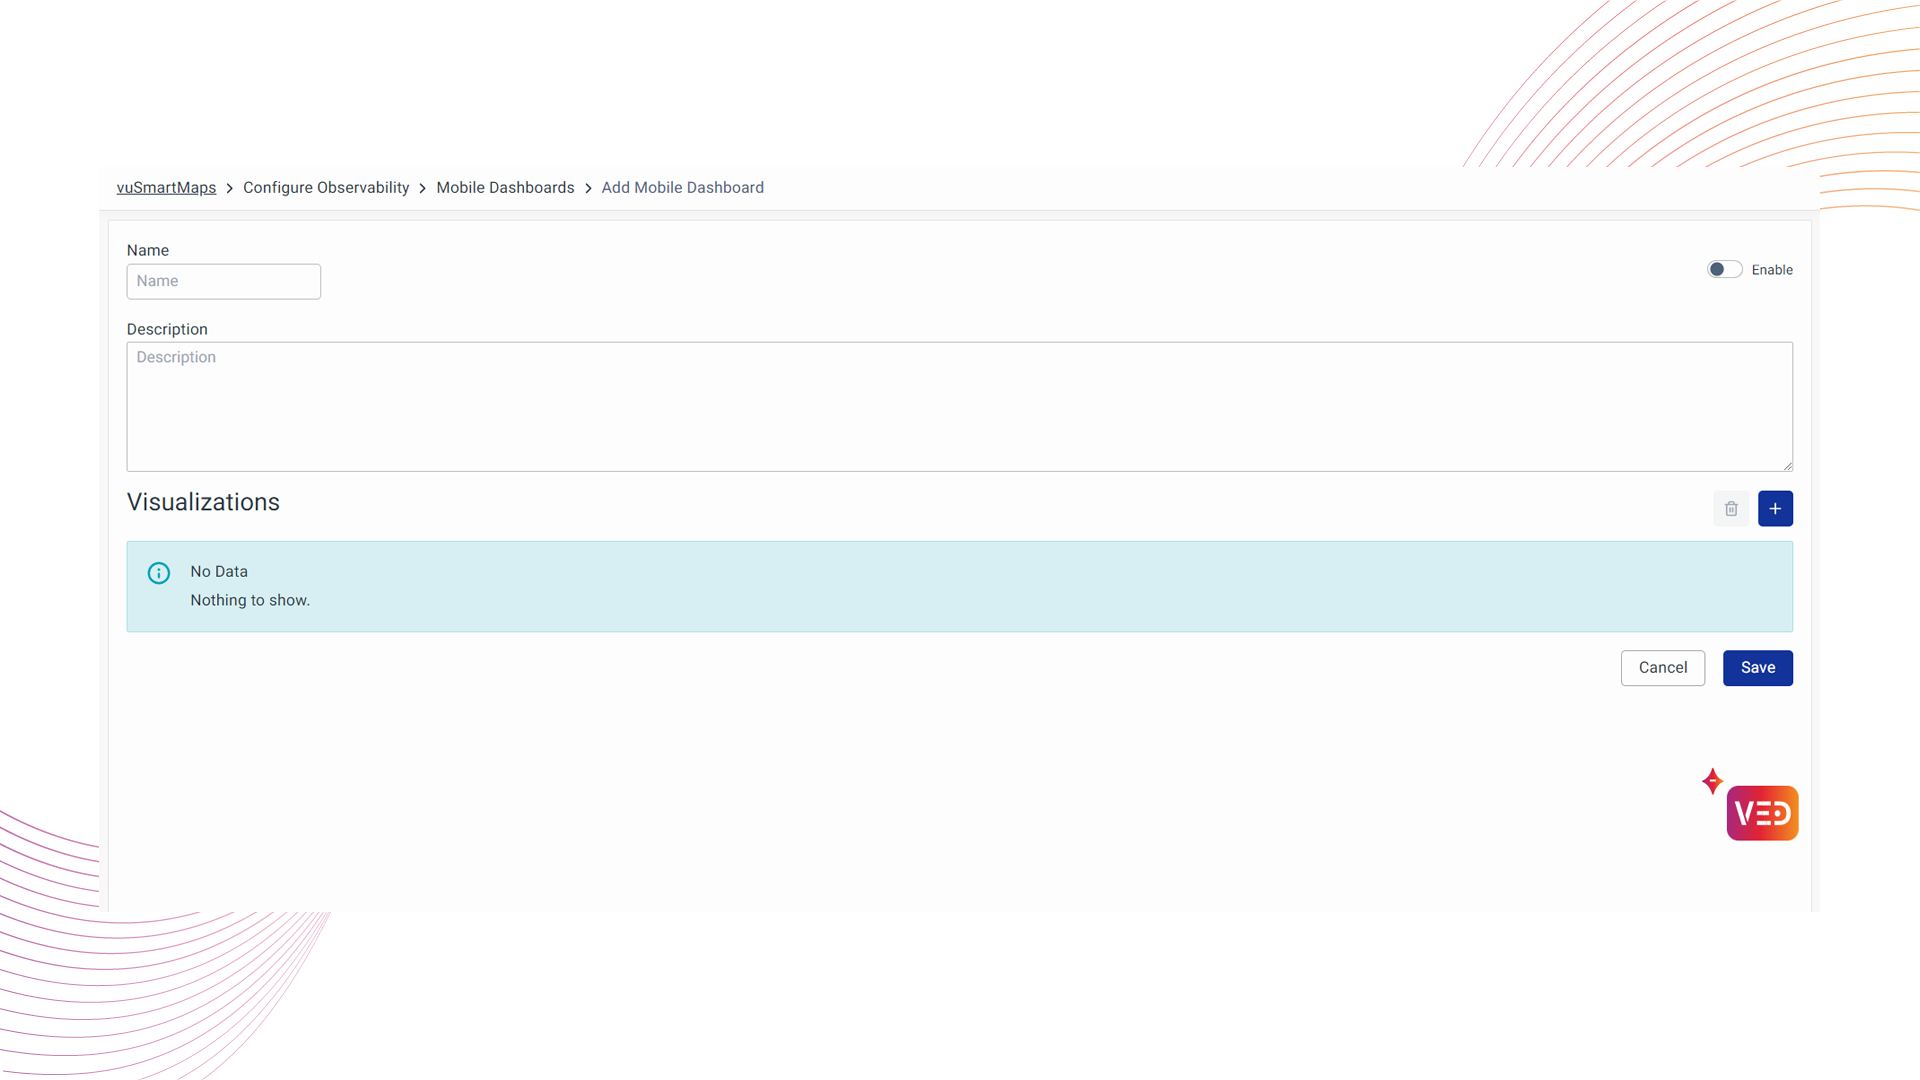
Mobile Dashboard Configuration Page
There are 4 items that can be configured here:
-
Name of the Dashboard
Provide a unique name (editable). For example: InsightsnoteUse unique names while creating Mobile Dashboards to prevent error messages.
-
Description of the Dashboard
This optional field lets you provide a description for the Dashboard, typically used for grouping related visualizations.
-
Enable or Disable the Dashboard
You can toggle the Dashboard on or off from this page or the Mobile Dashboard listing page. -
Adding Visualizations
To input values into the Visualizations Table, click the + icon in the Visualizations section and provide the necessary information for the Visualization. The required information includes:
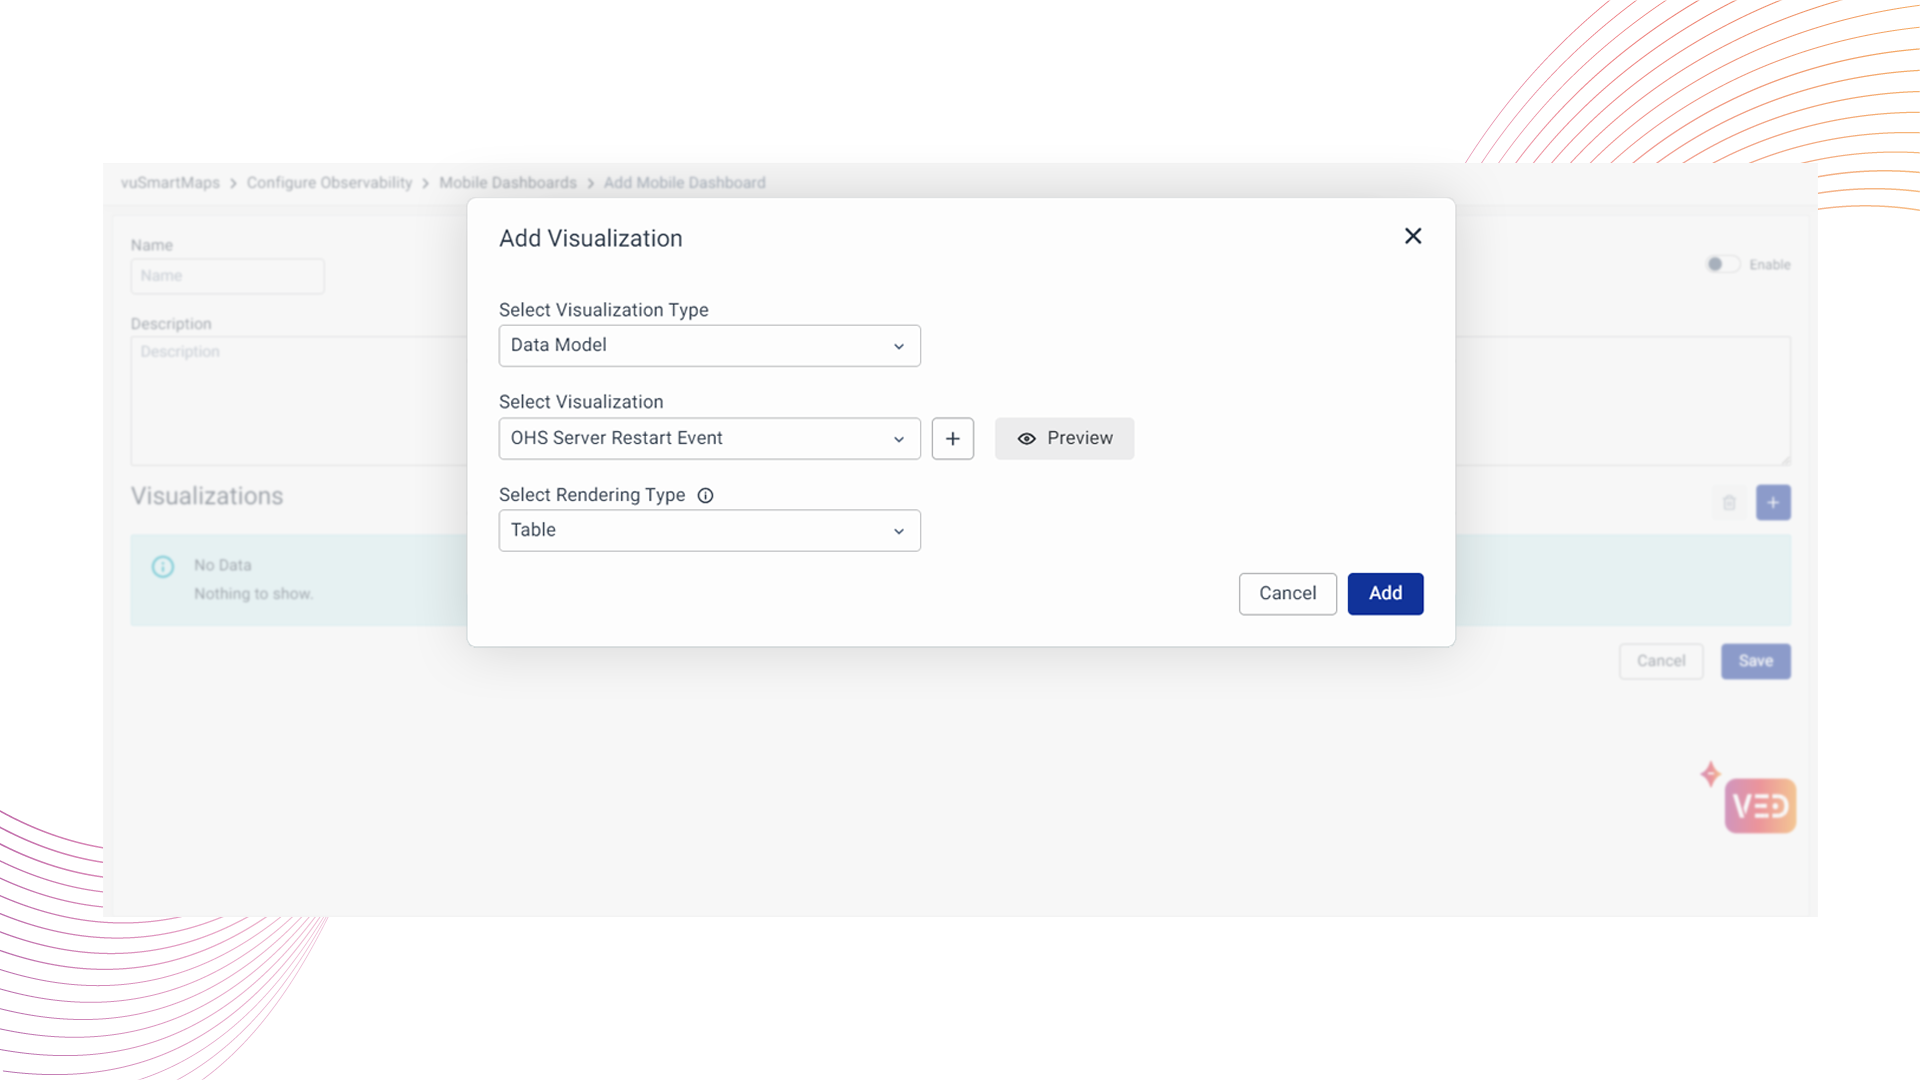
- Select Visualization Type: Type of Visualization.
- Data Model
- Insights
HTML insights with JS is not supported yet.
-
Select Visualization: Lists available Data Models or Insights based on the Select Visualization Type.
-
Select Rendering Type (Available only when Data Model is selected on Select Visualization Type): Type of Rendering required.
- KPI
- Table
- Trend Chart
If the specific Data Model for the particular type of visualization is not selected, the dashboards in the mobile app will not function properly.
Refer to Data Model Creation Details
Adding Visualization
- You can preview the selected Data Model by choosing it from the Select Visualization Type dropdown.

-
Clicking the + icon next to Select Visualization redirects to Data Model creation (if Data Model is selected) or Dashboard creation (if Insights is selected on the Select Visualization Type dropdown).
-
Upon clicking Add, a new entry appears at the top of the Visualizations Table. Rearrange the order using the Up and Down arrow icons under the Actions column. The order in this module determines the display sequence in the Mobile Application.
The visualization list may be edited with the Edit button available under the Actions column.
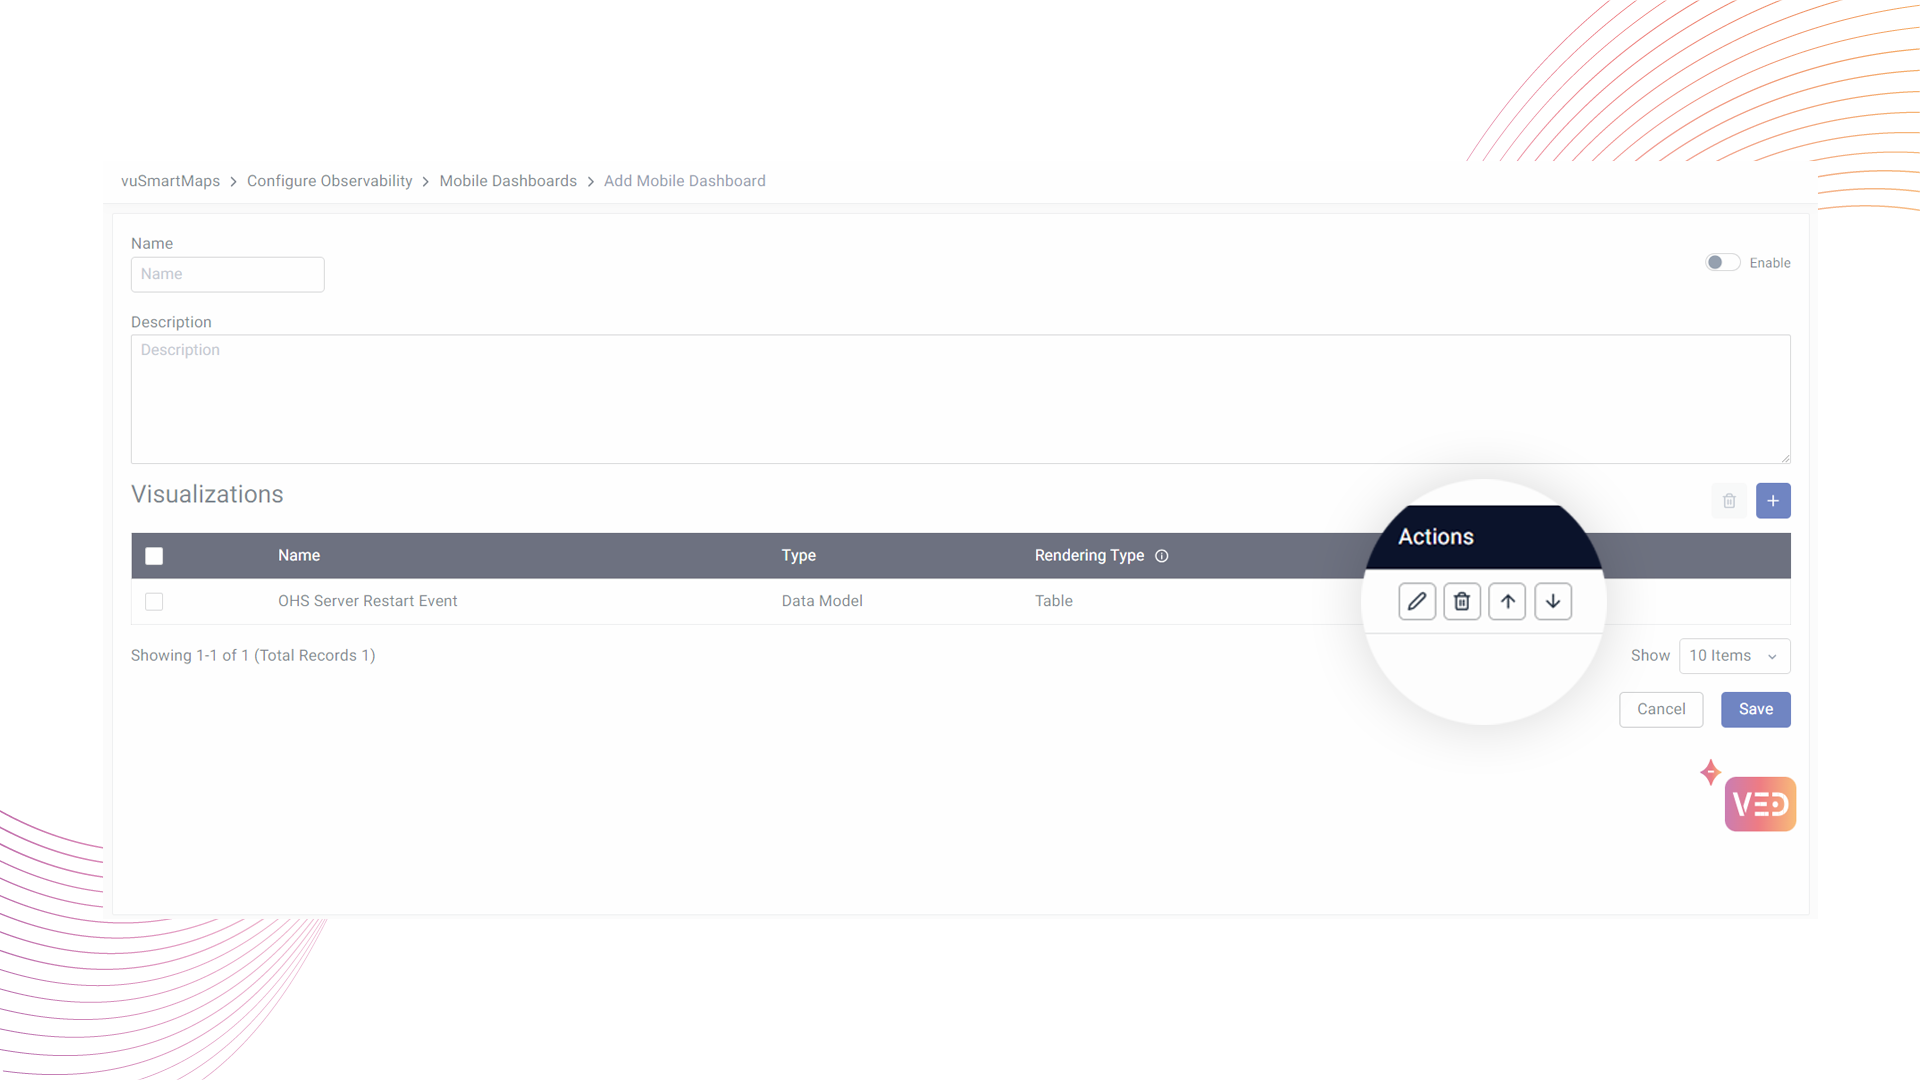
- After clicking Save, the mobile dashboard is created and listed in saved Mobile Dashboards.
Mobile dashboards can be edited using the Edit button under the Actions column.
Data Model Creation Details
For all the data models at least one metric should be selected at the last step of the data model creation page. And only those selected metrics will be used for rendering in the mobile application.
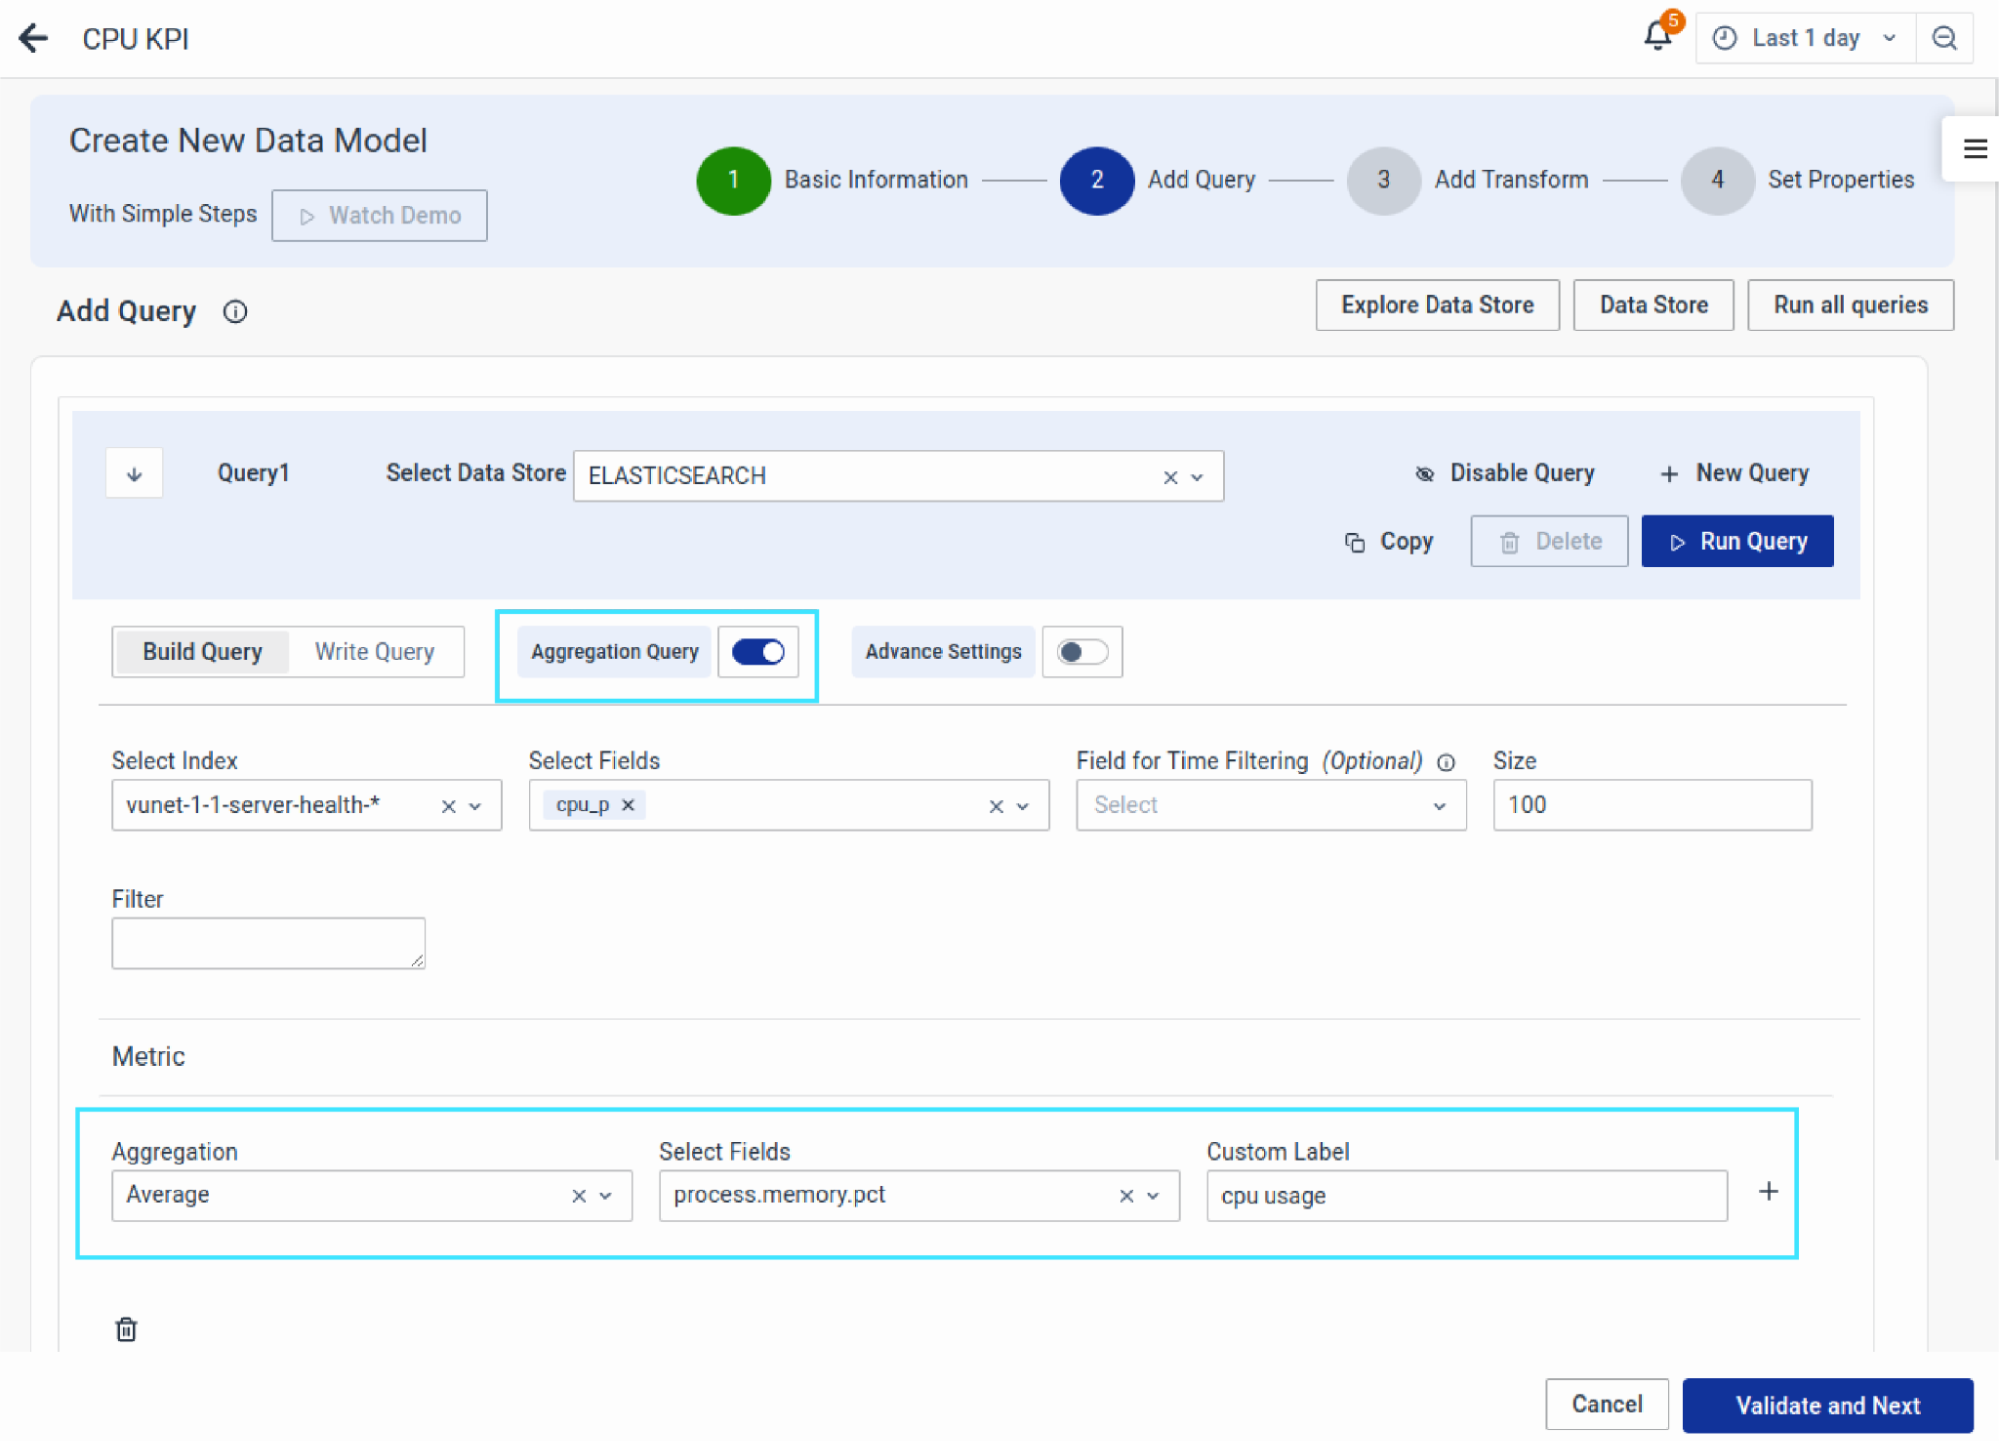
KPI Visualization
For KPI visualization, the Data model must be created with numerical aggregation. And No groupings(Define Unique Keys Section) must be selected in the last step of the data model creation page.
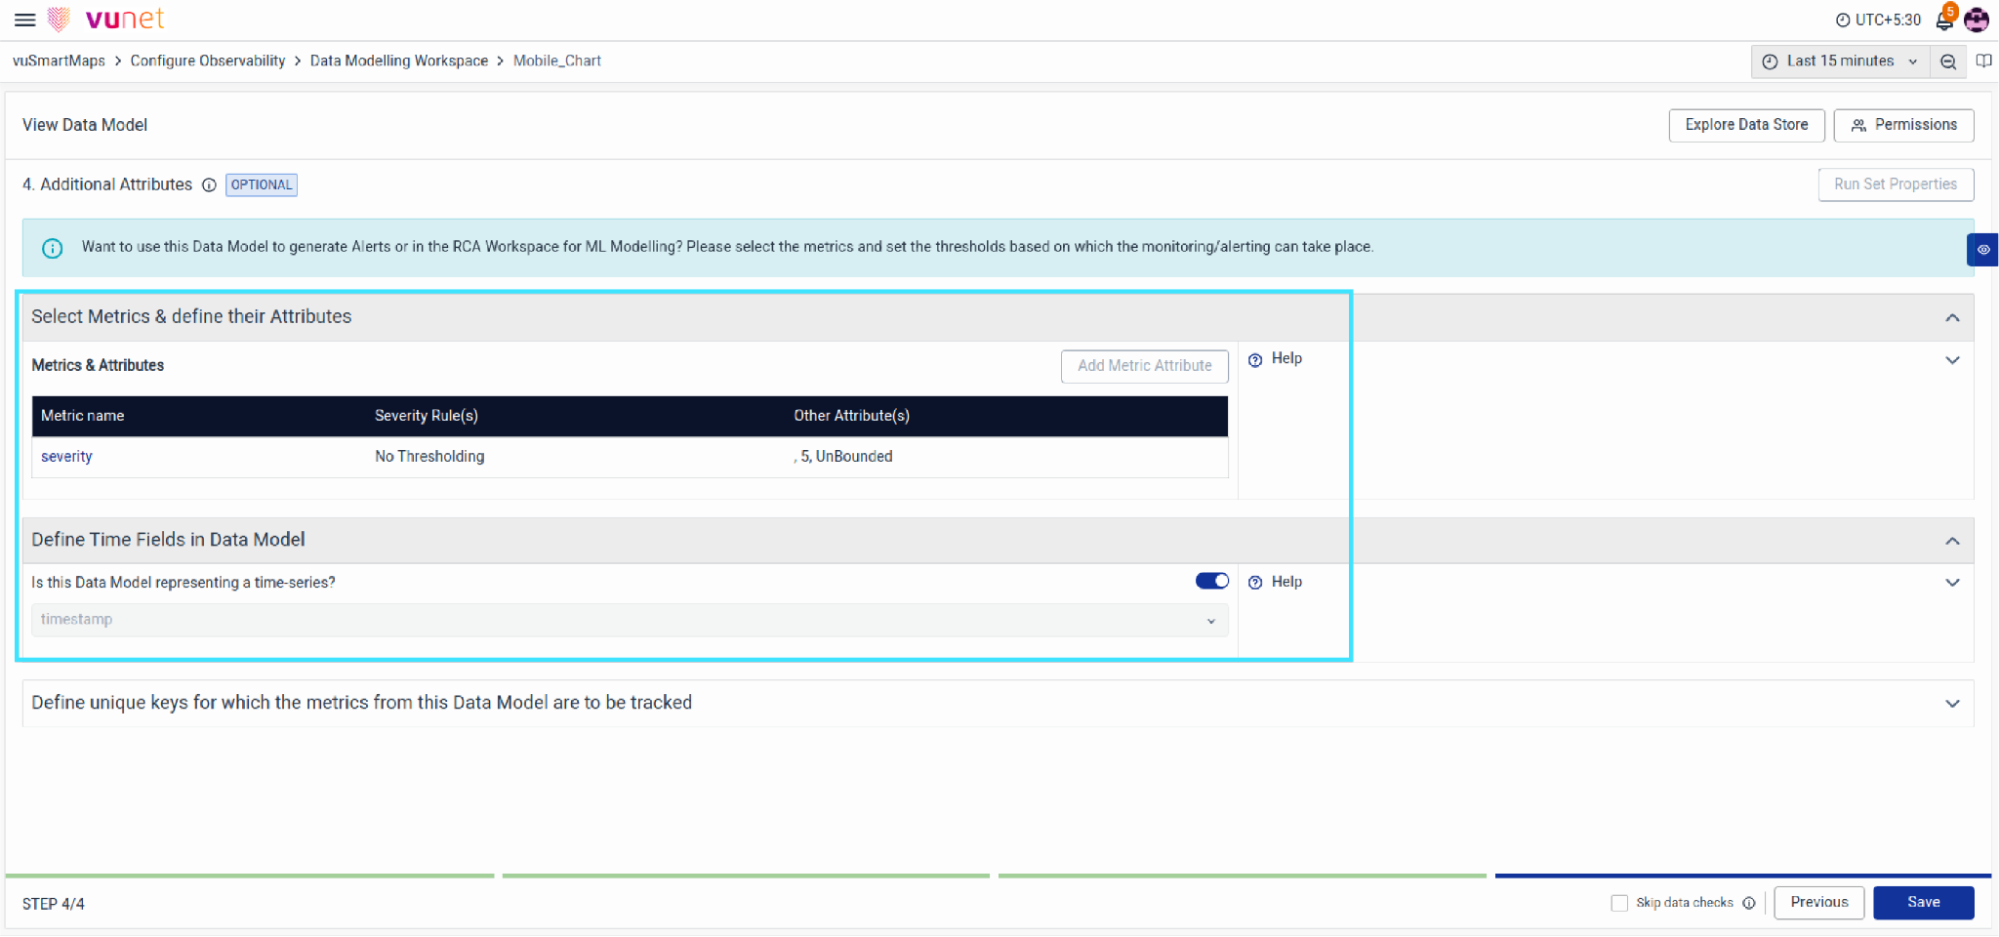
Charts Visualization
The Data Model must be set as time-series data, and one metric must be selected.
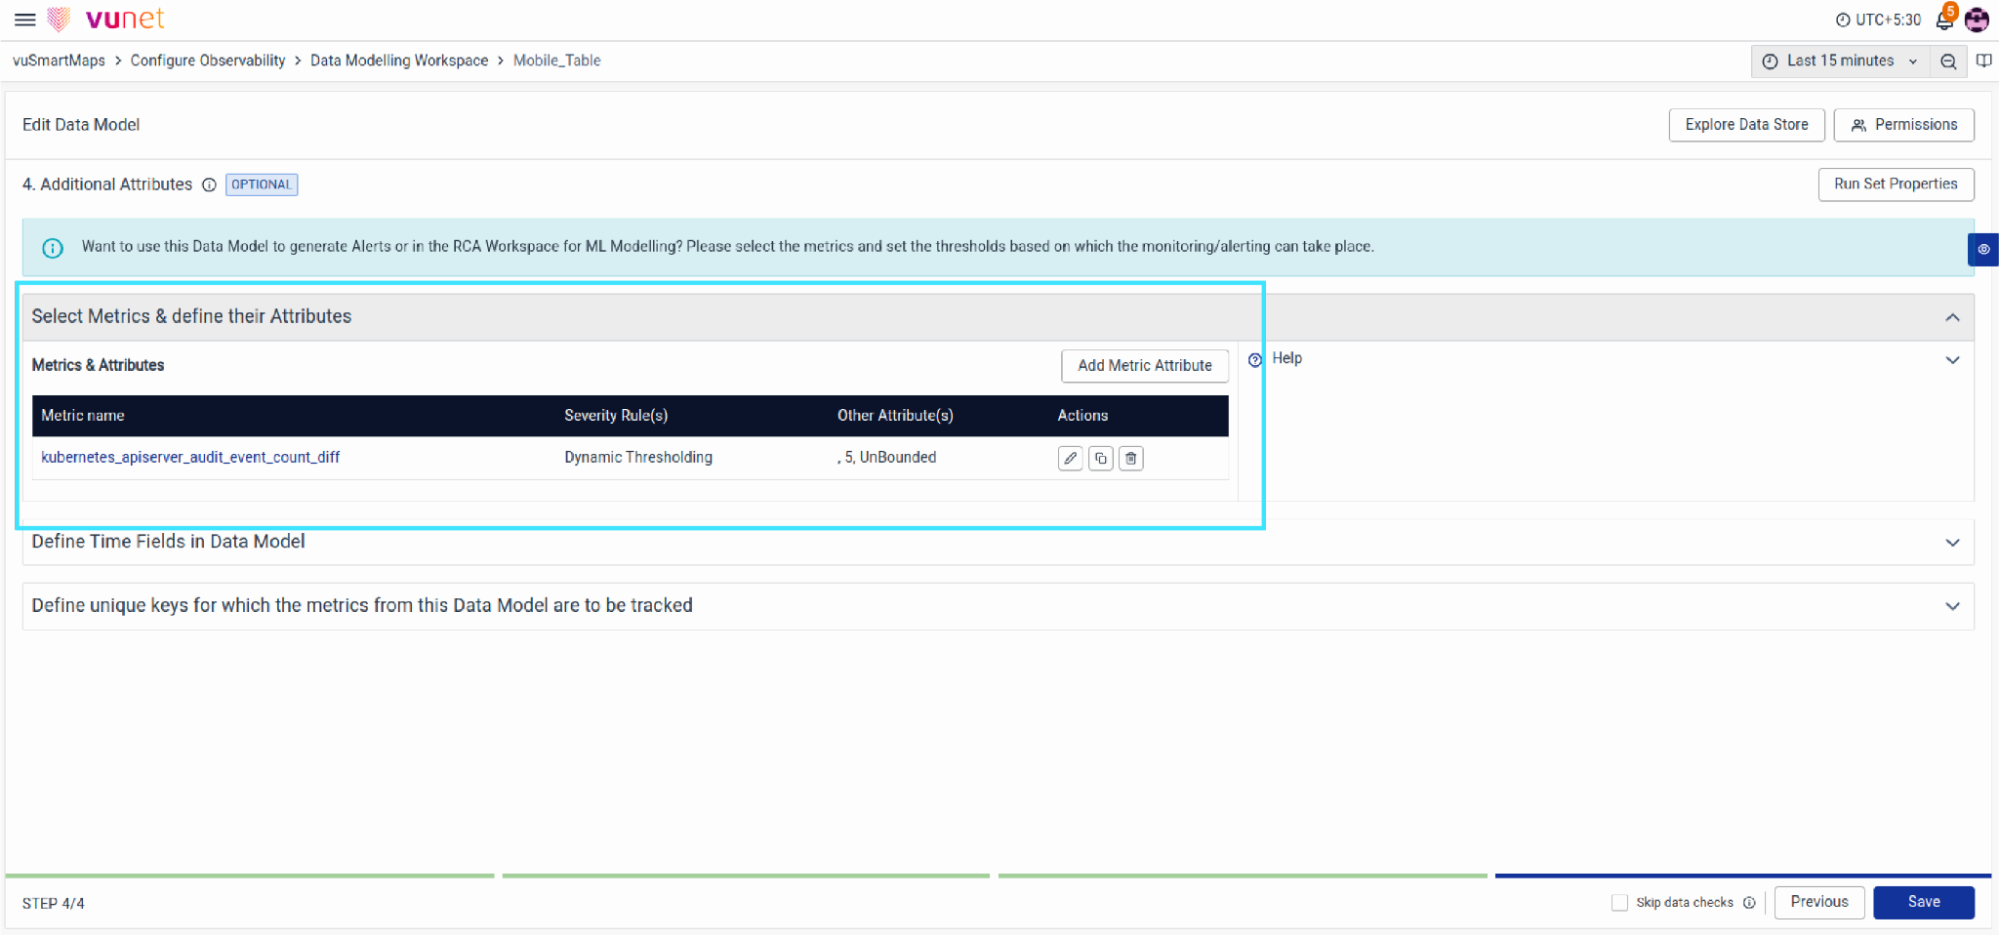
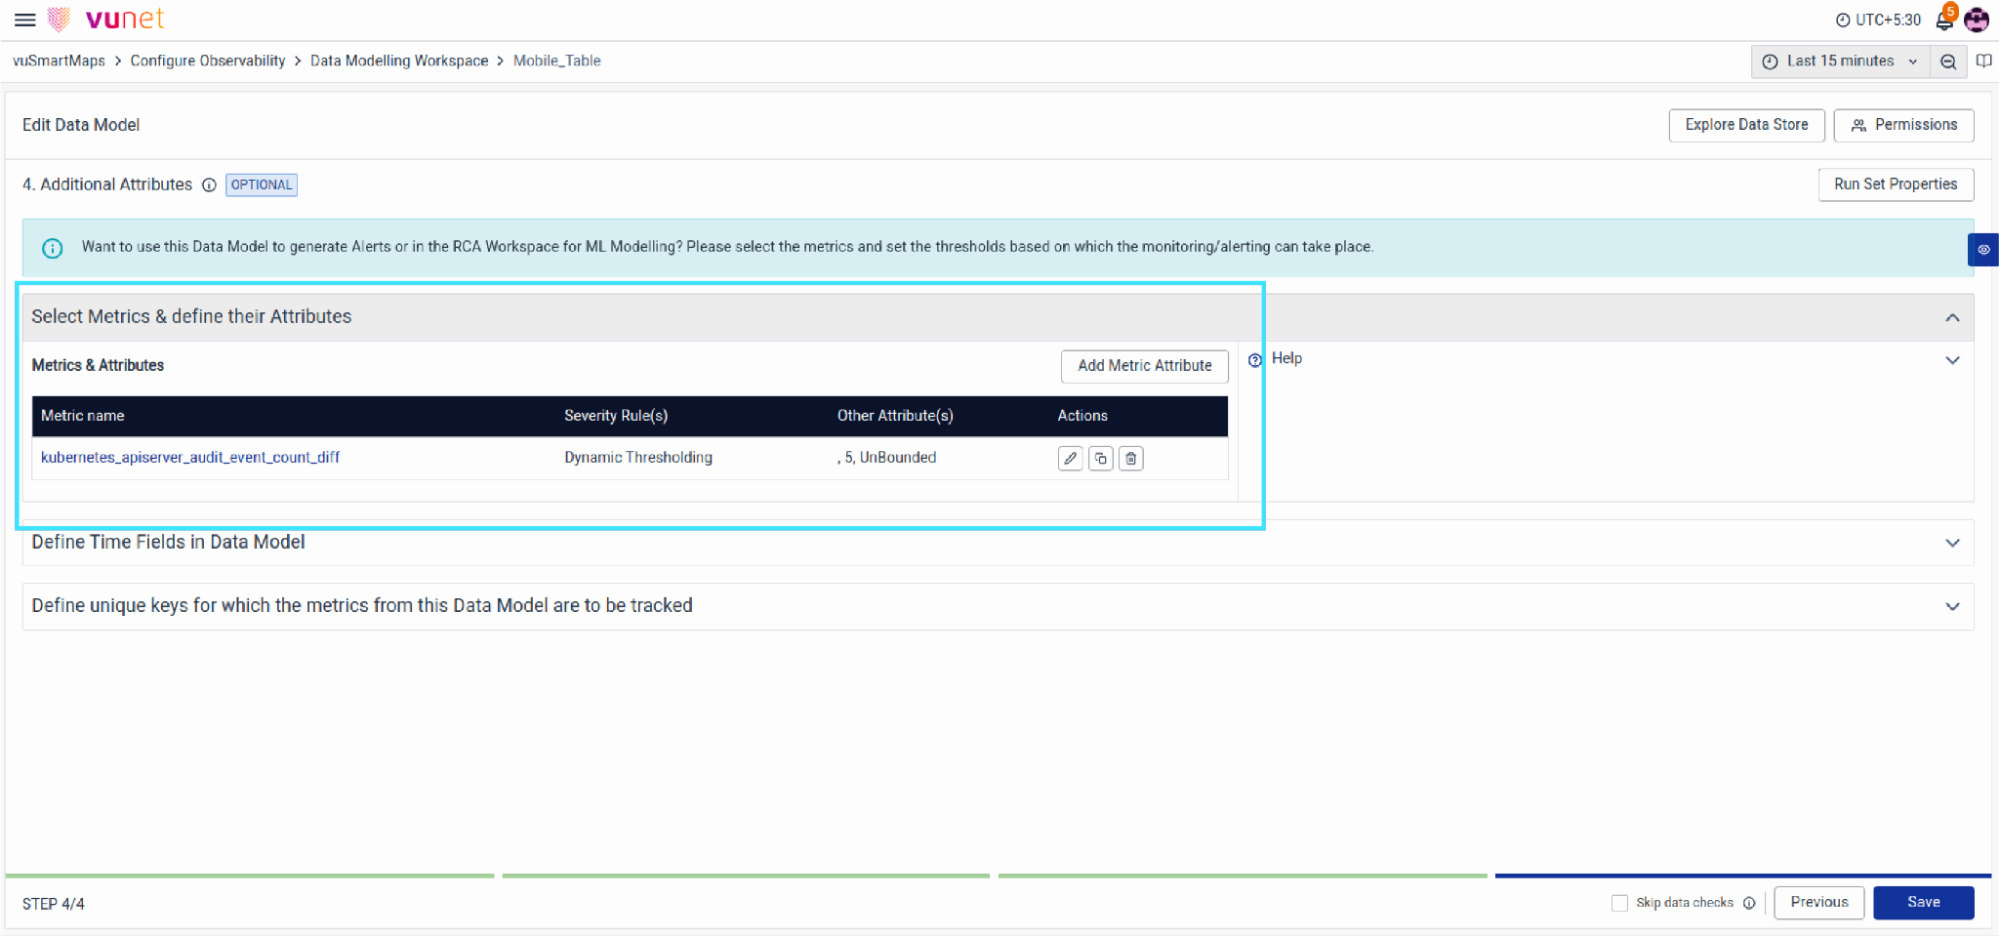
Table
The data model must have one or more grouping fields selected.
The “Select Metrics” section must not contain fields already selected under the “Define Unique Keys” section. And Threshold Must be selected for each Metric Selected.

In the image above, 'Select Grouping Fields' has 'asc_target' and 'asc_target_state,' while 'Select Metrics' contains 'count.' Ensure these fields do not overlap to achieve the expected mobile visualization.
Import/Export Mobile Dashboards to JSON
You can Import or Export Mobile Dashboards using the 'Import' and 'Export' buttons.
Steps to Import / Export Mobile Dashboards
-
Select the rows you want to export, then click the Export button.
-
A JSON file containing information about the selected rows will be downloaded.
-
To add external rows, use the Import button to upload the JSON file.
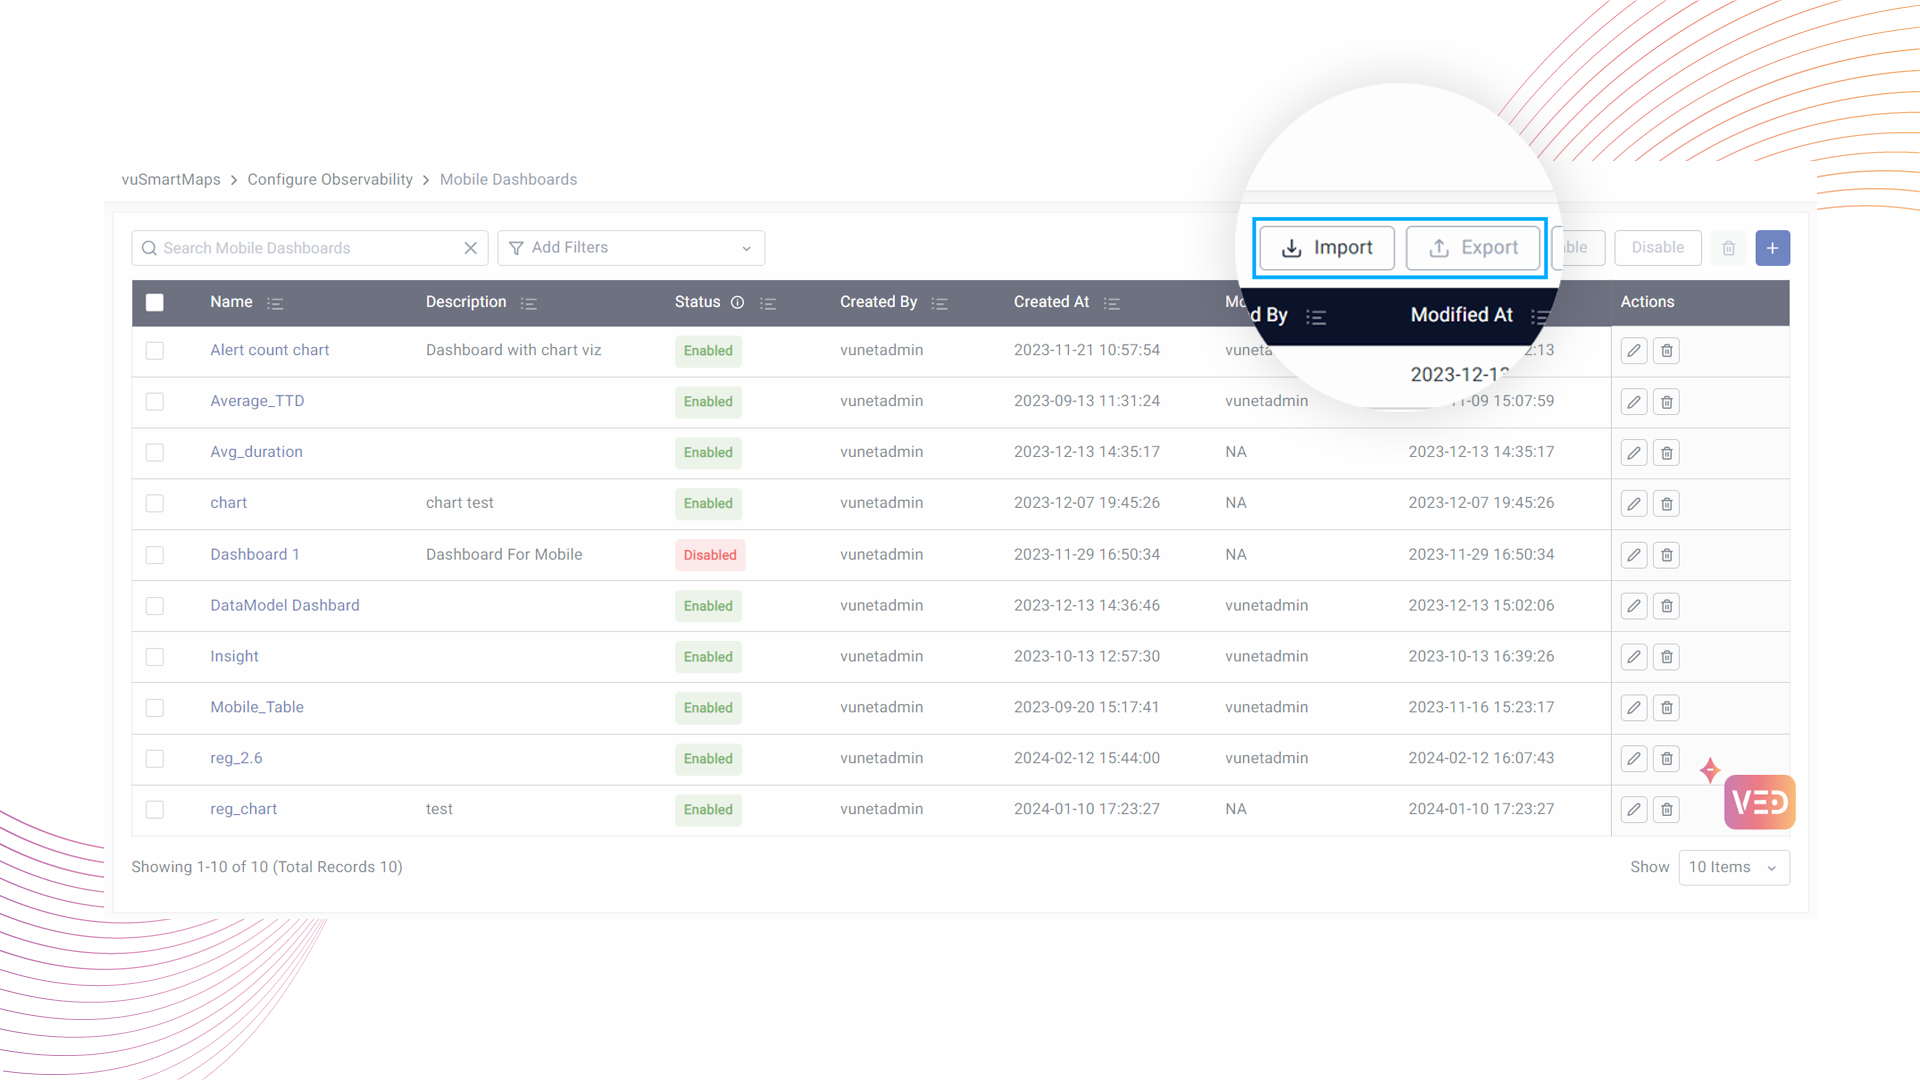
The Import will fail if the exported JSON file contains a mobile dashboard with the same name already present in the saved Mobile Dashboards.
