Create a New Data Model
Basic Information
When you click on the + button on the listing page, you'll land on the Data Model's configuration page, where you provide basic information about the data model.
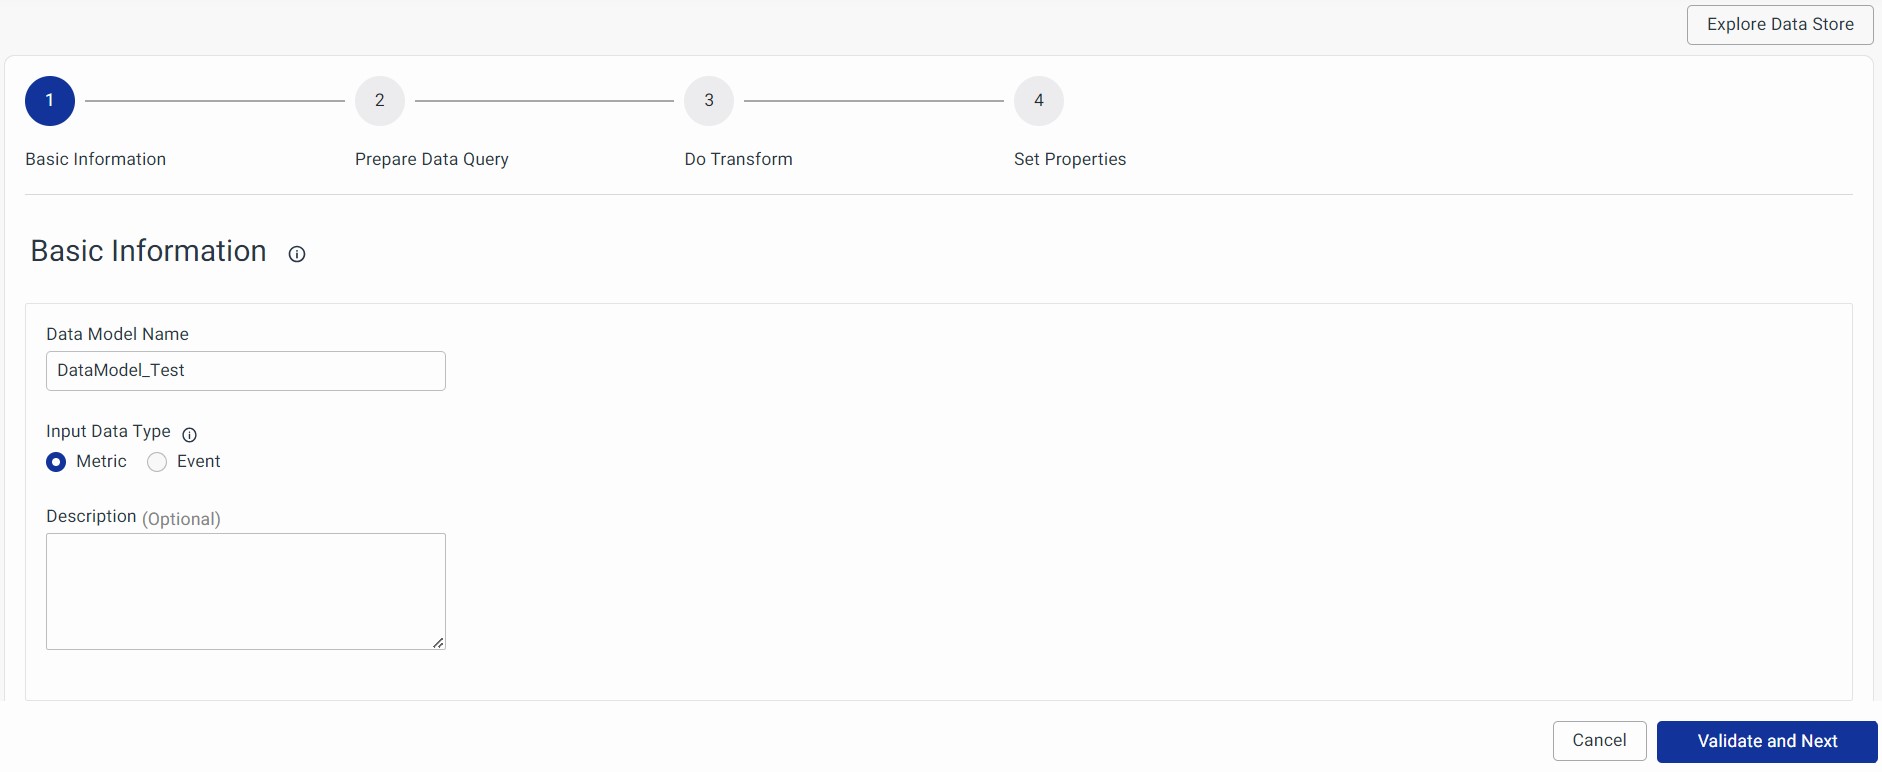
- Data Model Name: Give your data model a unique name for easy reference.
- Input Data Type: You can choose between "Metric" or "Event" based on your needs.
- Metric: Use this for metric-based data models.
- Event: Select this for alert-related or event-based data models.
- Description (Optional): You can add a brief description to explain this data model. It is a good practice to add a brief informative description so that users can figure out how to use this data model.
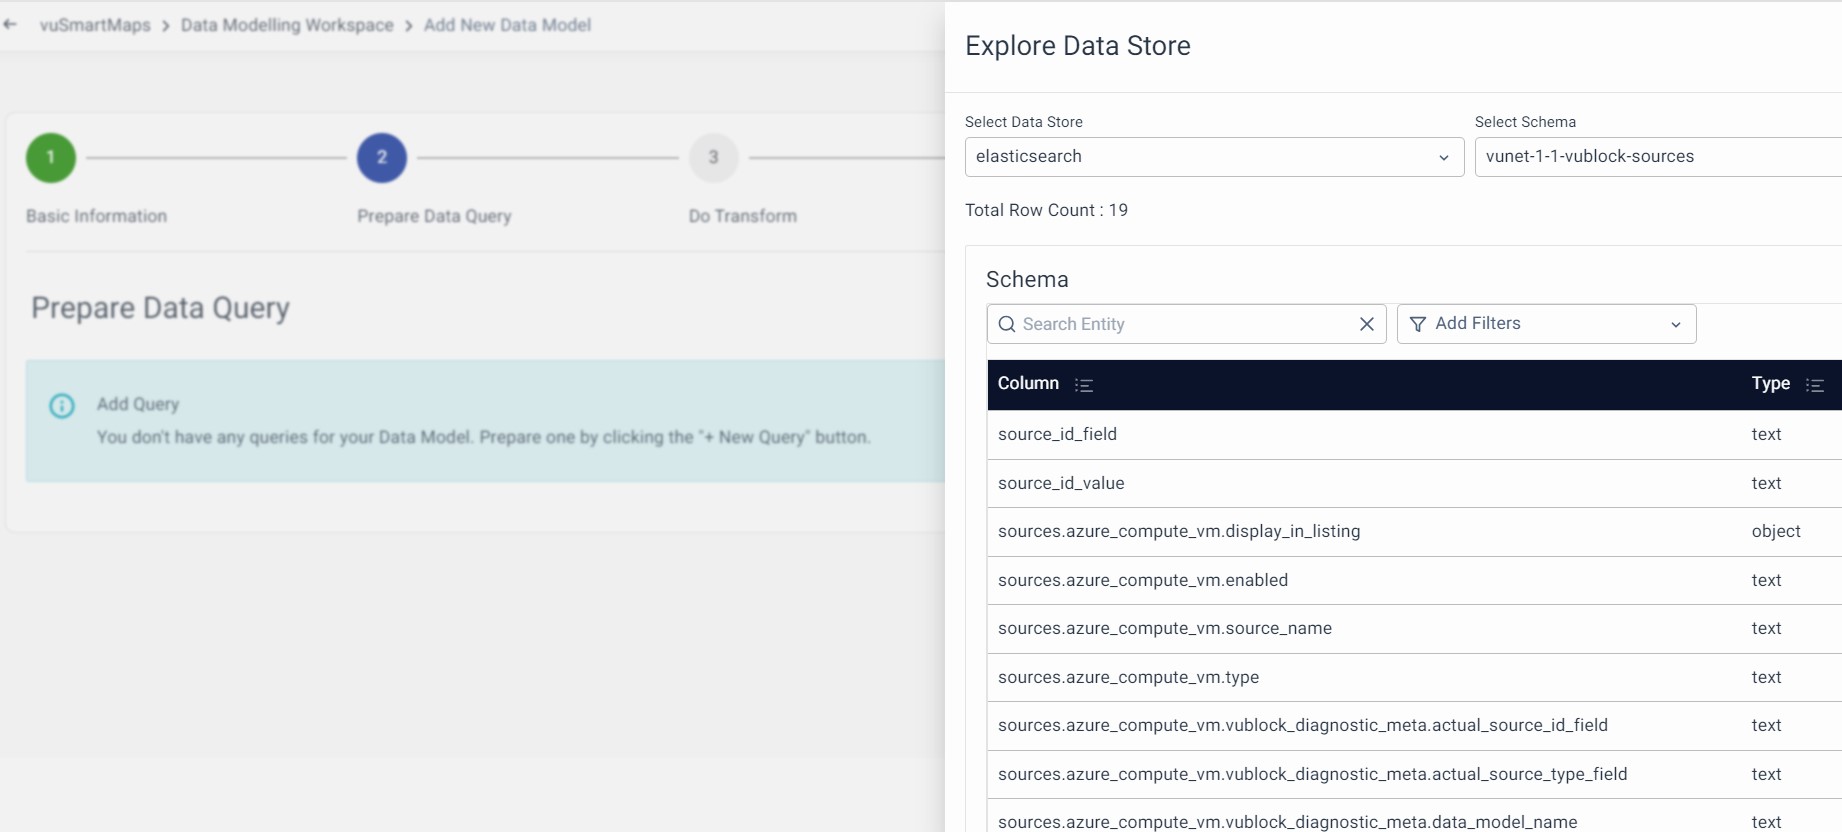
Explore Data Store
It is a helpful feature that offers users a quick view of the information stored in a Data Store. It provides information about tables or indices, and their schema. This feature assists users in selecting and configuring the correct field in the data model and workspace stages. Manage your data stores directly from the listing page. Check it out here for more details.
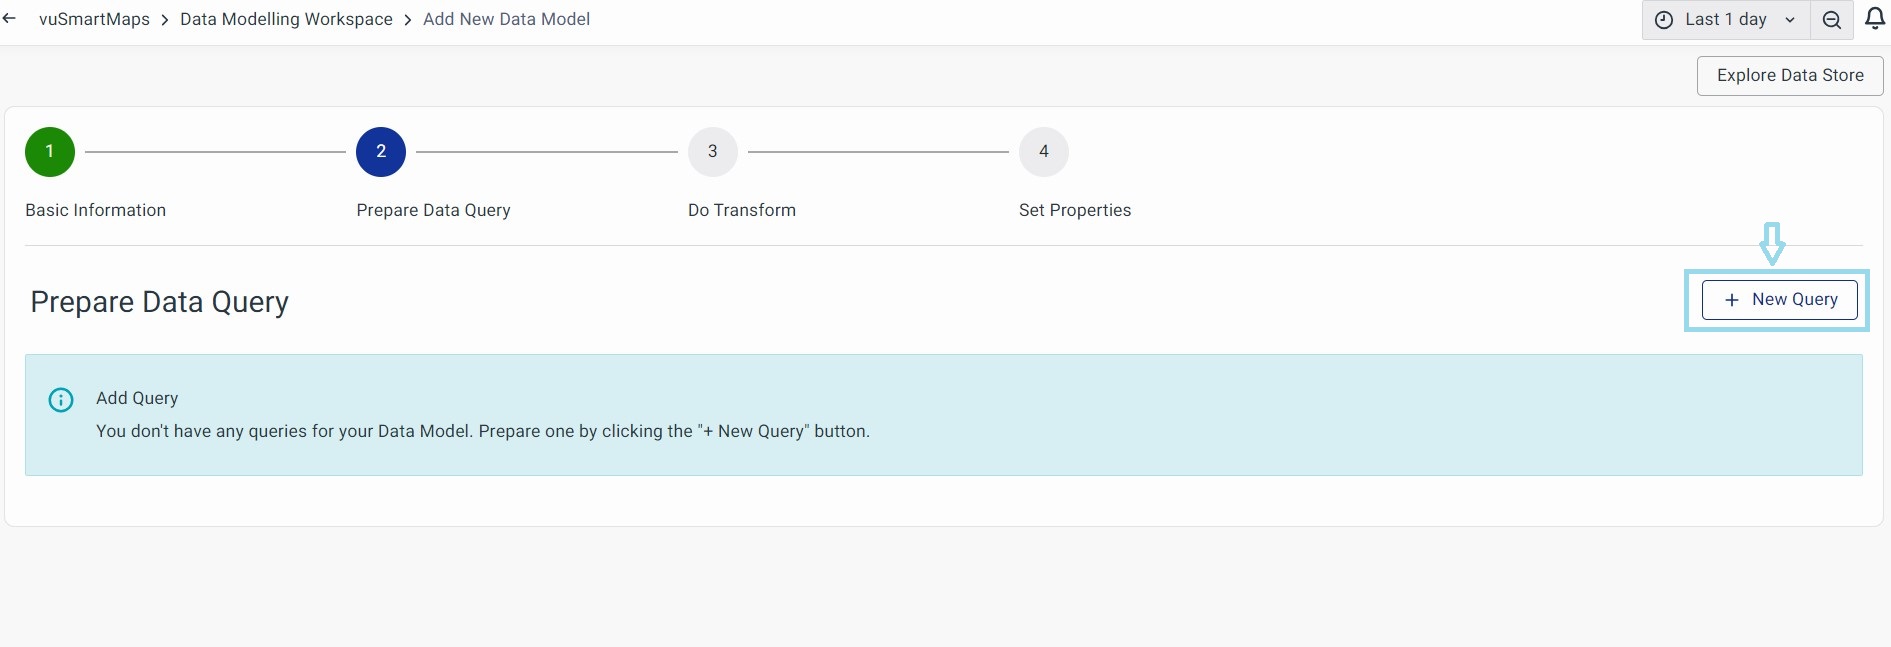
Prepare Data Query
This step is where you can prepare your queries to fetch the required data. The syntax for building and writing queries could be different based on the selected data store. For each data store, you can either build your queries with a query builder or write the raw queries. Here are the tasks you can do in this section:
- Build a Query with a Query Builder
- Specify a Raw Query
- Run all Queries
- Query editor functions
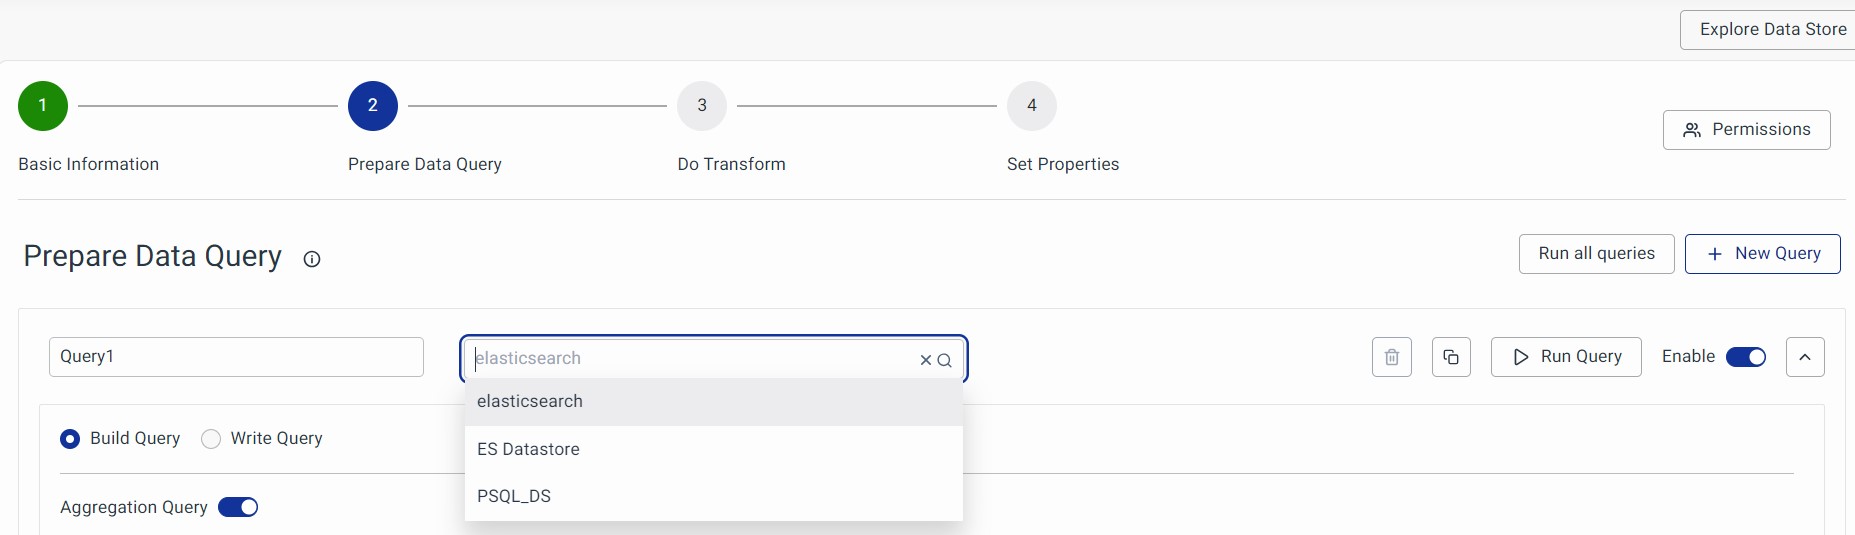
Build a Query with a Query Builder
A Data Model query can be built in two ways:
- Using Build Query
- Write Query.
To start configuring the query, you must first select the Data Store. For more details on managing Data Stores, please see the Data Store section.
In the below example, Elasticsearch Data Store is considered.
A data model can have multiple queries based on your needs. For example, if you want to use data from different Data Stores, you can create more than one query and use transformations in the subsequent steps to combine them.
Example: If you use Hyperscale DB for Query 1 and ElasticSearch Data Store for Query 2, simply use a Join transform in step 3 to merge them according to your needs.
Using the Build Query Option
Now, you can create a database query using the Build Query. This helps you build basic select queries for various supported databases using VuNet's Query Language User Interface.
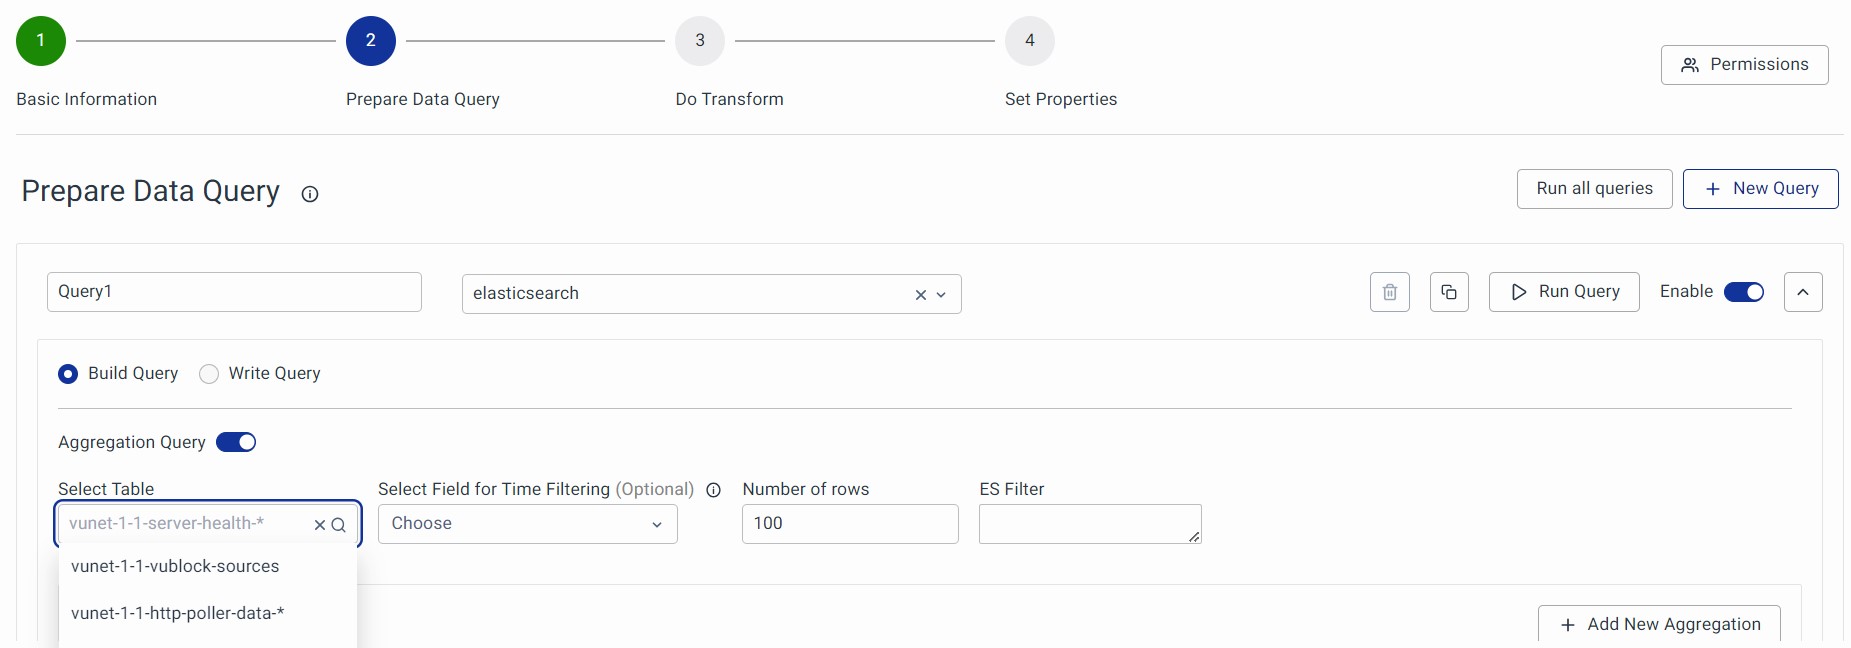
In the "Select Table” section, choose the table or index from which you want to retrieve data.
Field for Time Filtering (Optional)
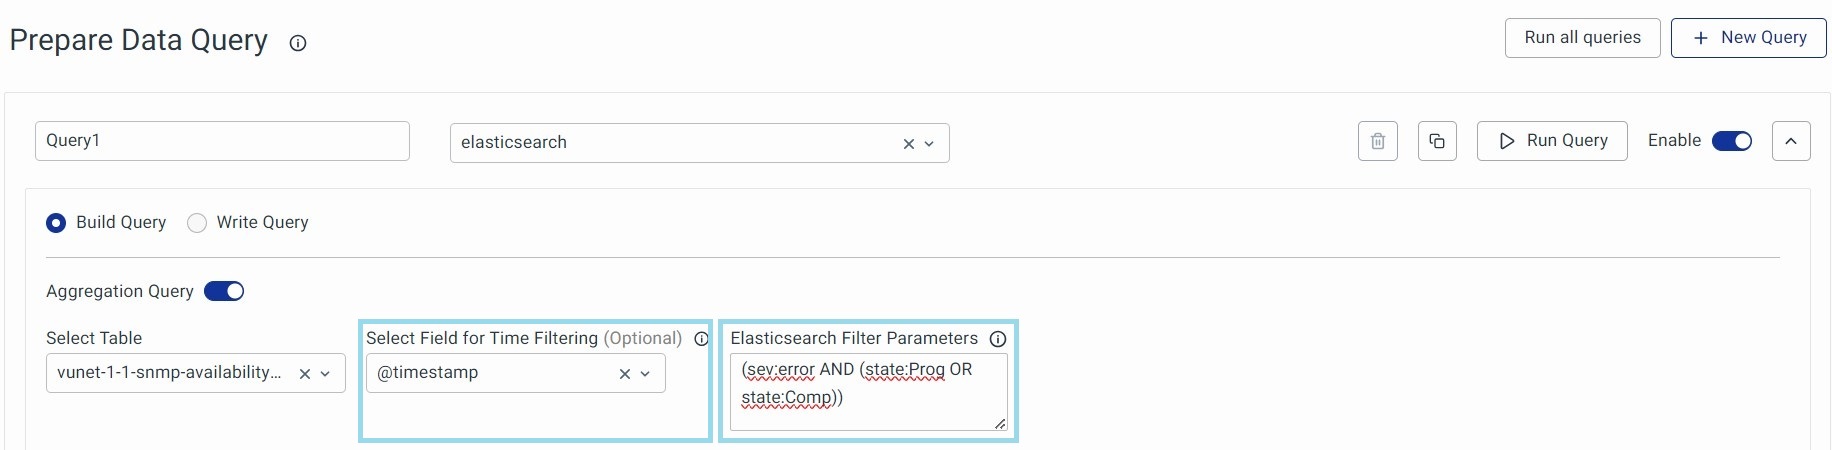
If your data is time series data, you want the Data Model to return data for the time range selected in your dashboard. In such a case, select the field containing the timestamp corresponding to your time series data here. This dynamically serves the Global Time Filter (Last 15 min, 24 hours, or 7 days, and so on) as input for the given query. If no field is selected, the query will retrieve all the data from the Data Store, regardless of the chosen time range.
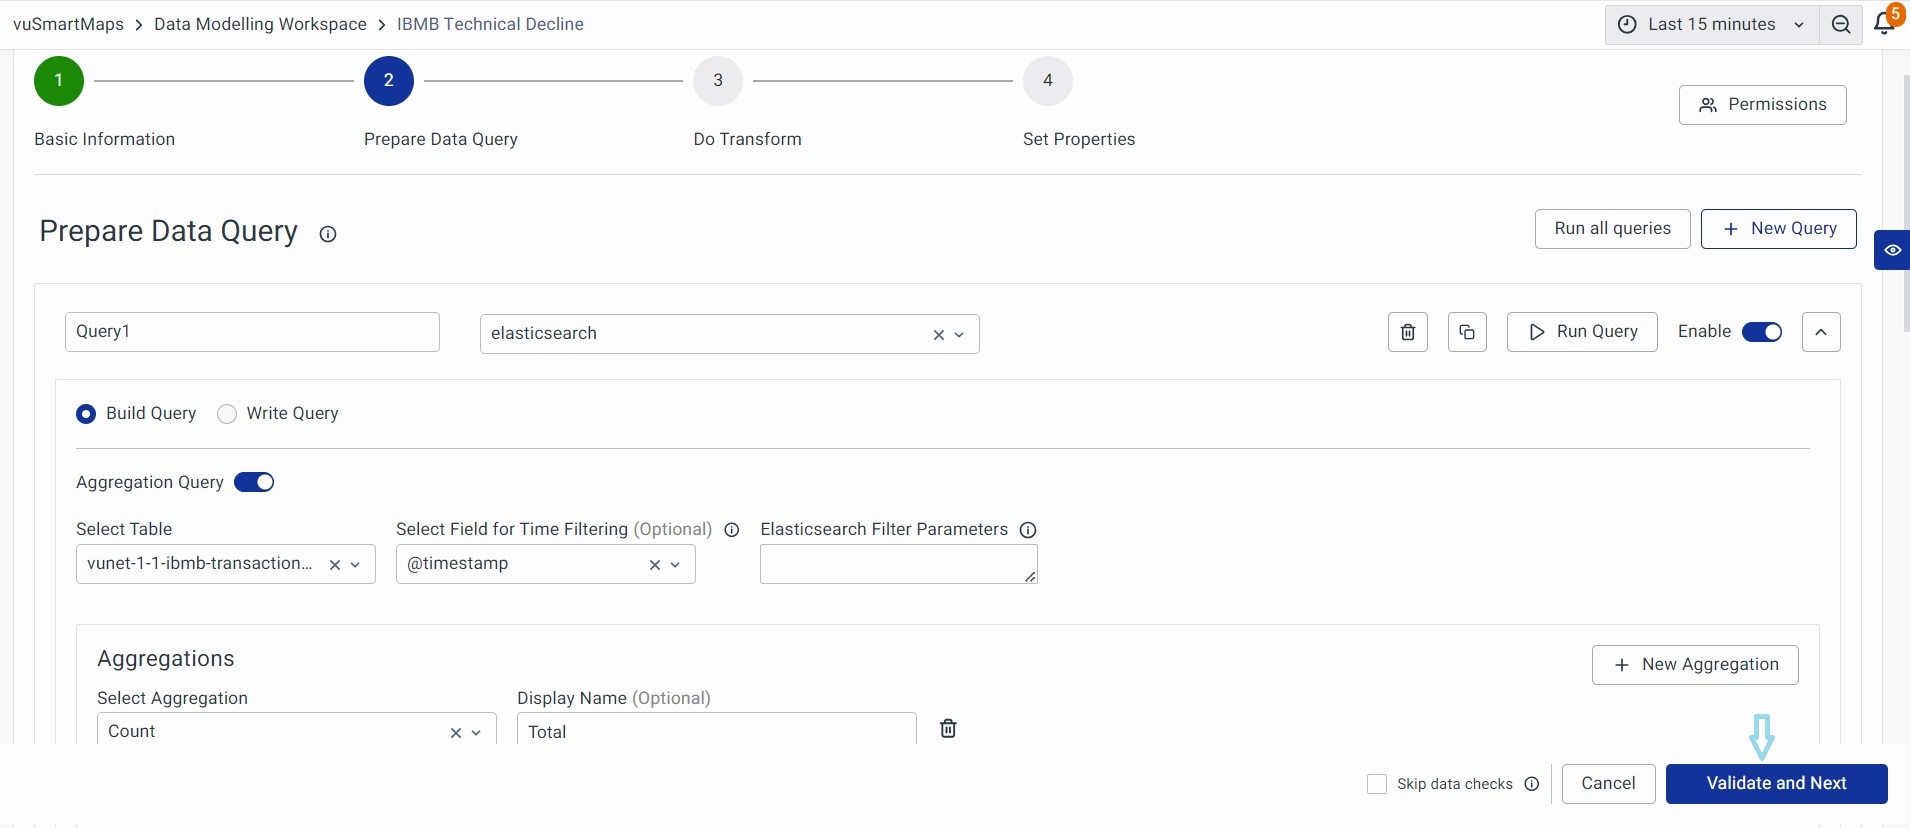
Elasticsearch Filter Parameter
You can add the filter to fetch the data from the Data Store. It must follow the proper Elasticsearch Syntax. Please note that this is an optional field and is only visible when using Elasticsearch Data Sources.
It uses a key:value syntax and the following is an example:
(sev:error AND (state:Prog OR state:Comp))
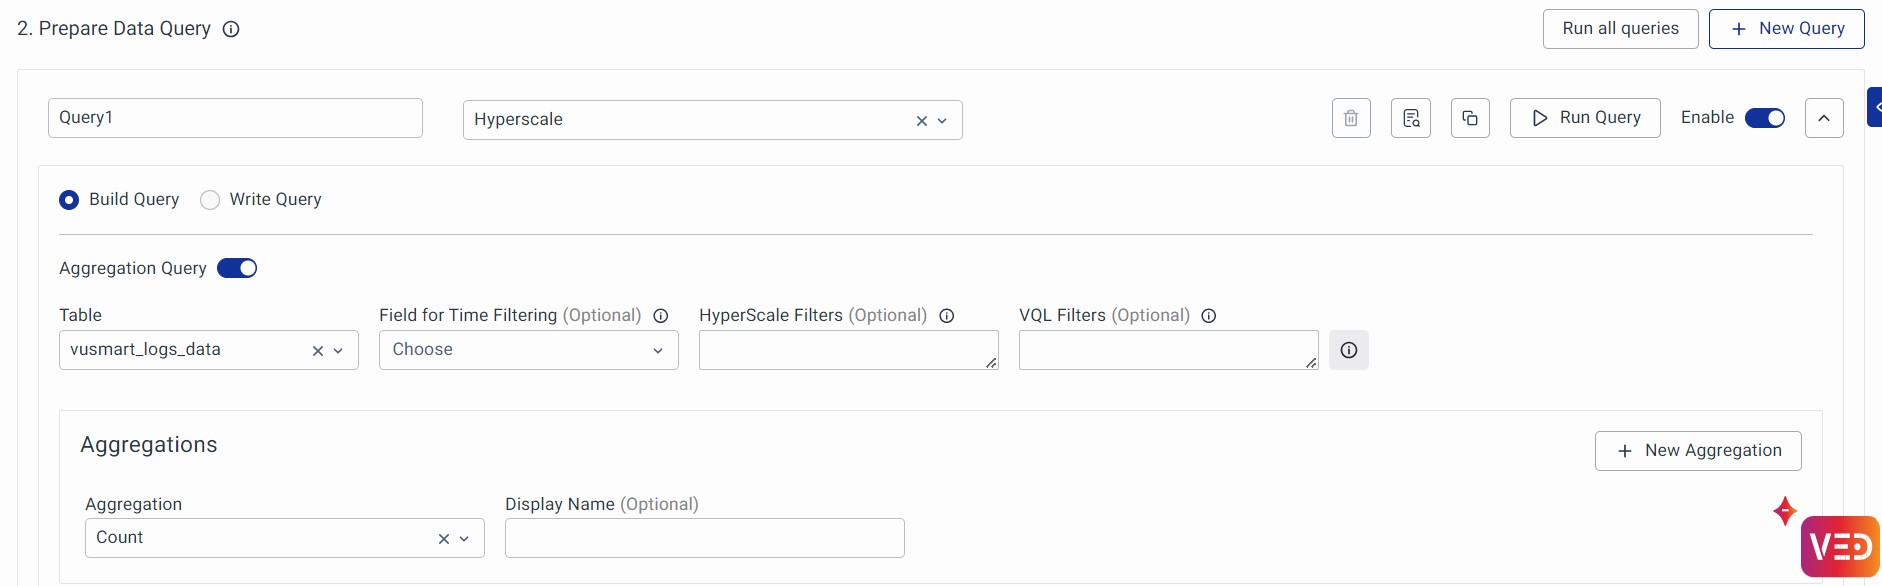
1. If we choose Hyperscale Data Store then Hyperscale Filter Parameters must follow proper SQL syntax.
Example: CPU usage >= 70 AND memory usage >= 70

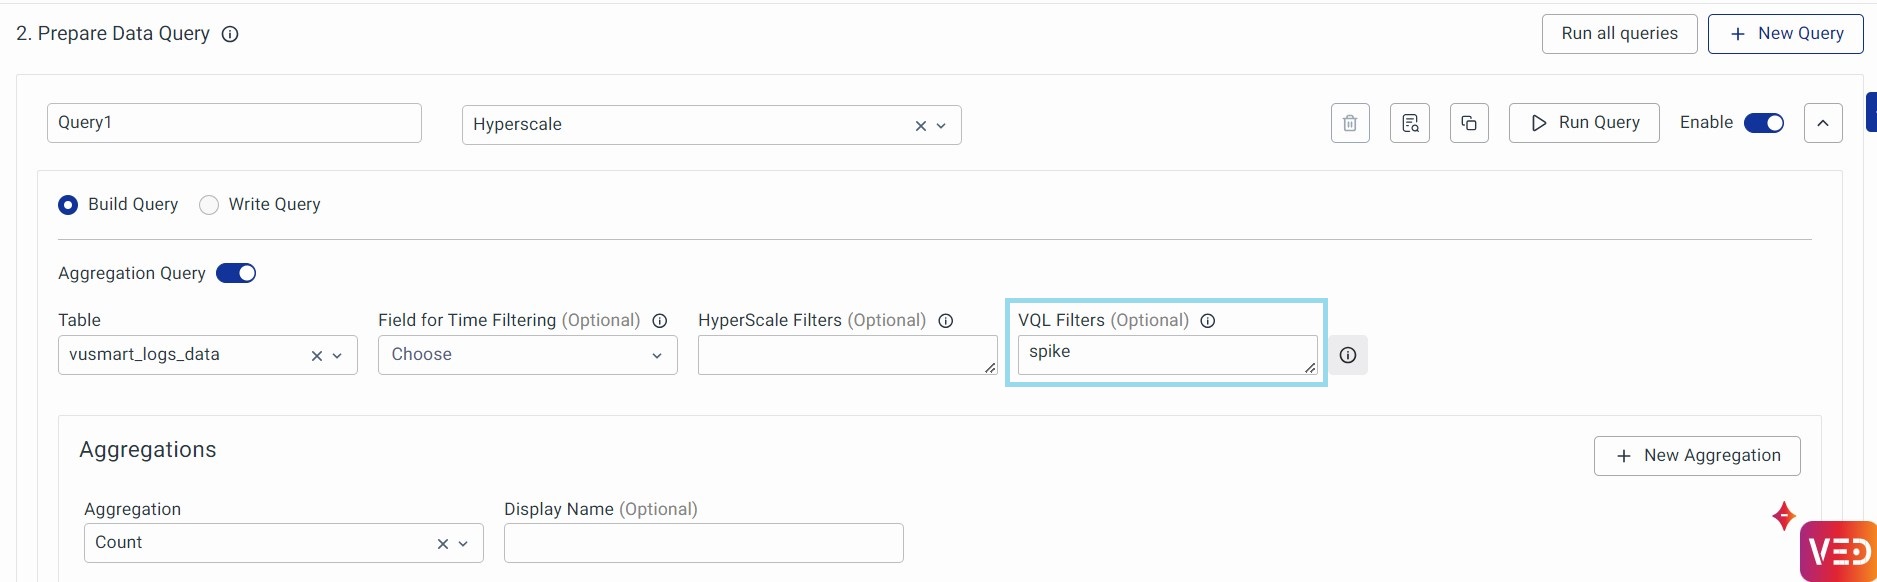
2. If we choose Hyperscale Data Store, you can optionally use VQL (VuNet Query Language) Filters. VQL is an easy-to-use text-based query language for filtering data. Use VQL to filter documents based on substring match, and value match, where a value for a field exists and similar such simple and compound conditions.
Before using the VQL filter:
Output:
Click on Run Query to view the result.
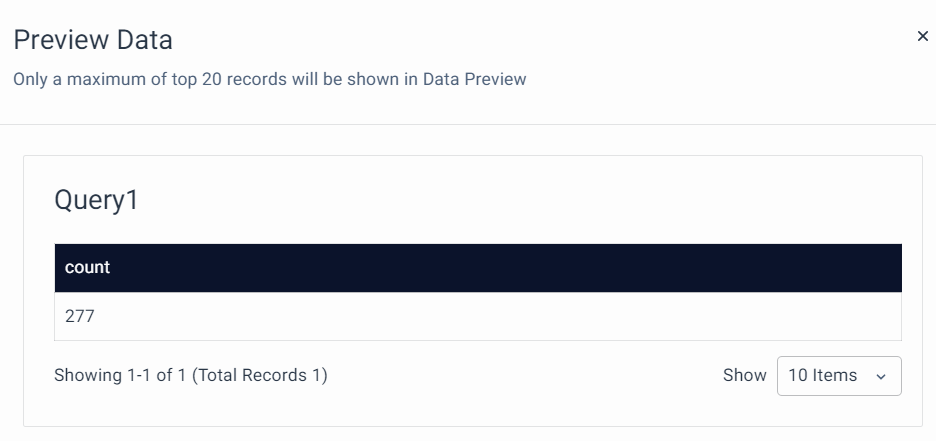
After using the VQL filter:
Output:
Click on Run Query to view the result.
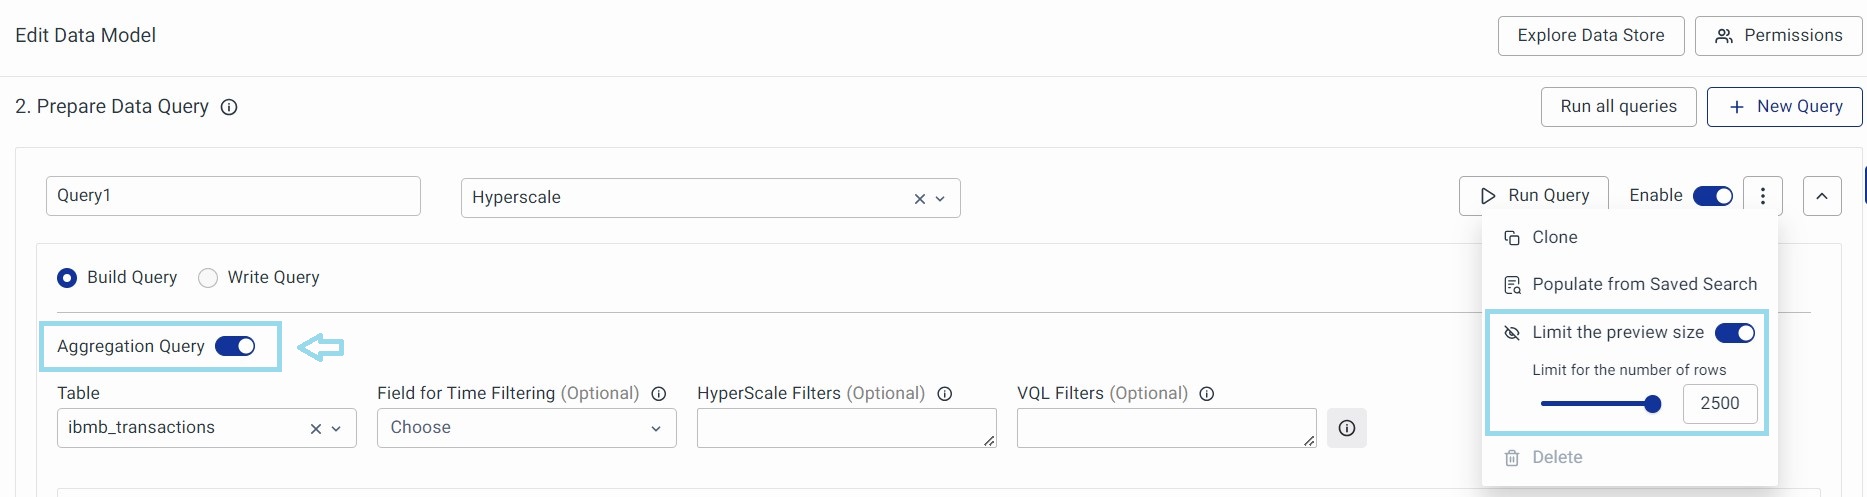
Limit the Preview Size
This is an option to limit the number of rows displayed in the preview. Click on the Menu button next to the Enable toggle button. Click on Limit the Preview Size toggle button to activate it. Drag the horizontal bar to set the limit. Alternatively, you can enter the number directly.
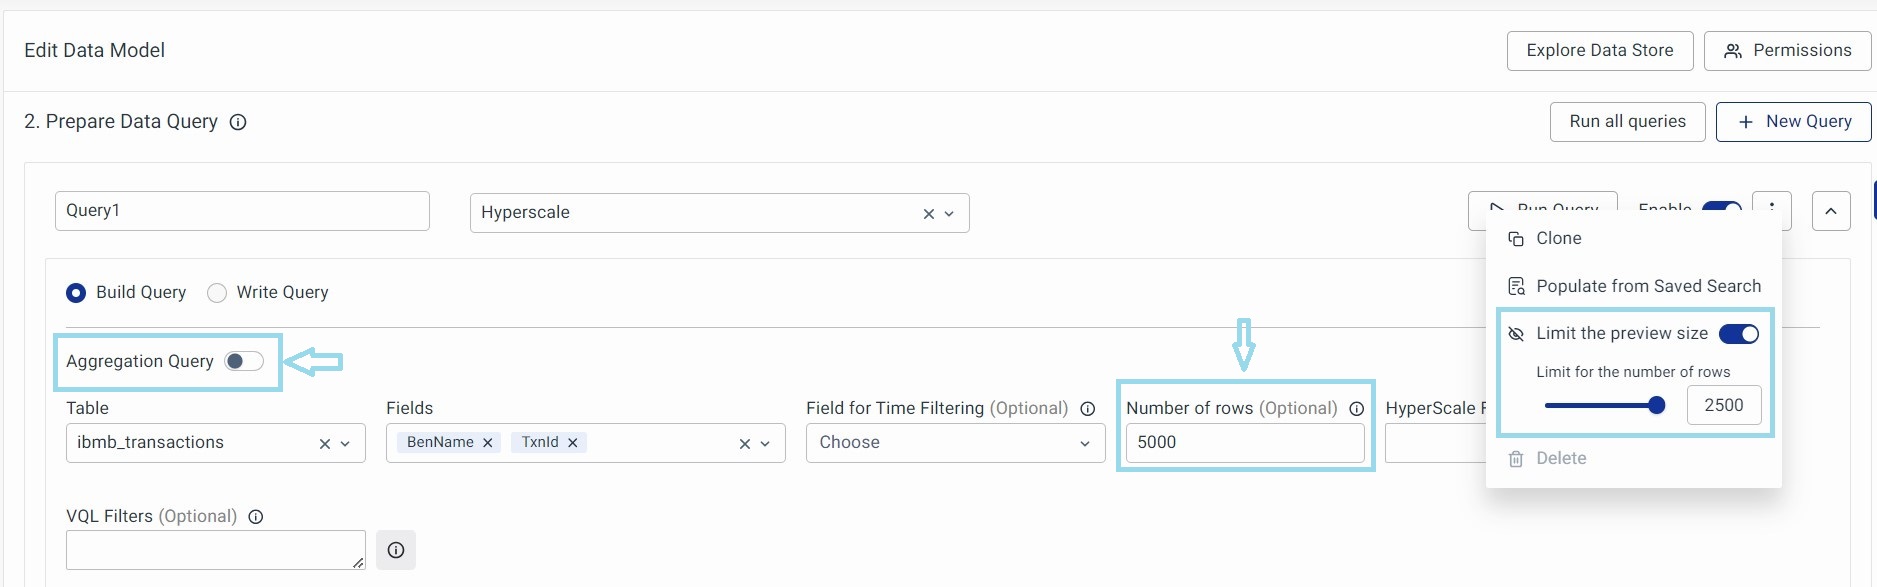
You can specifically use this option when the Aggregation Query is turned on. When the ‘Aggregation Query’ is turned on, the ‘Number of Rows’ section is disabled.
If not you can type a number directly in the “Number of Rows” section. The data model will consider whichever number is smaller.
Parameters
The Parameters section in the Data Modelling Workspace helps users define and filter data effectively based on various field types.
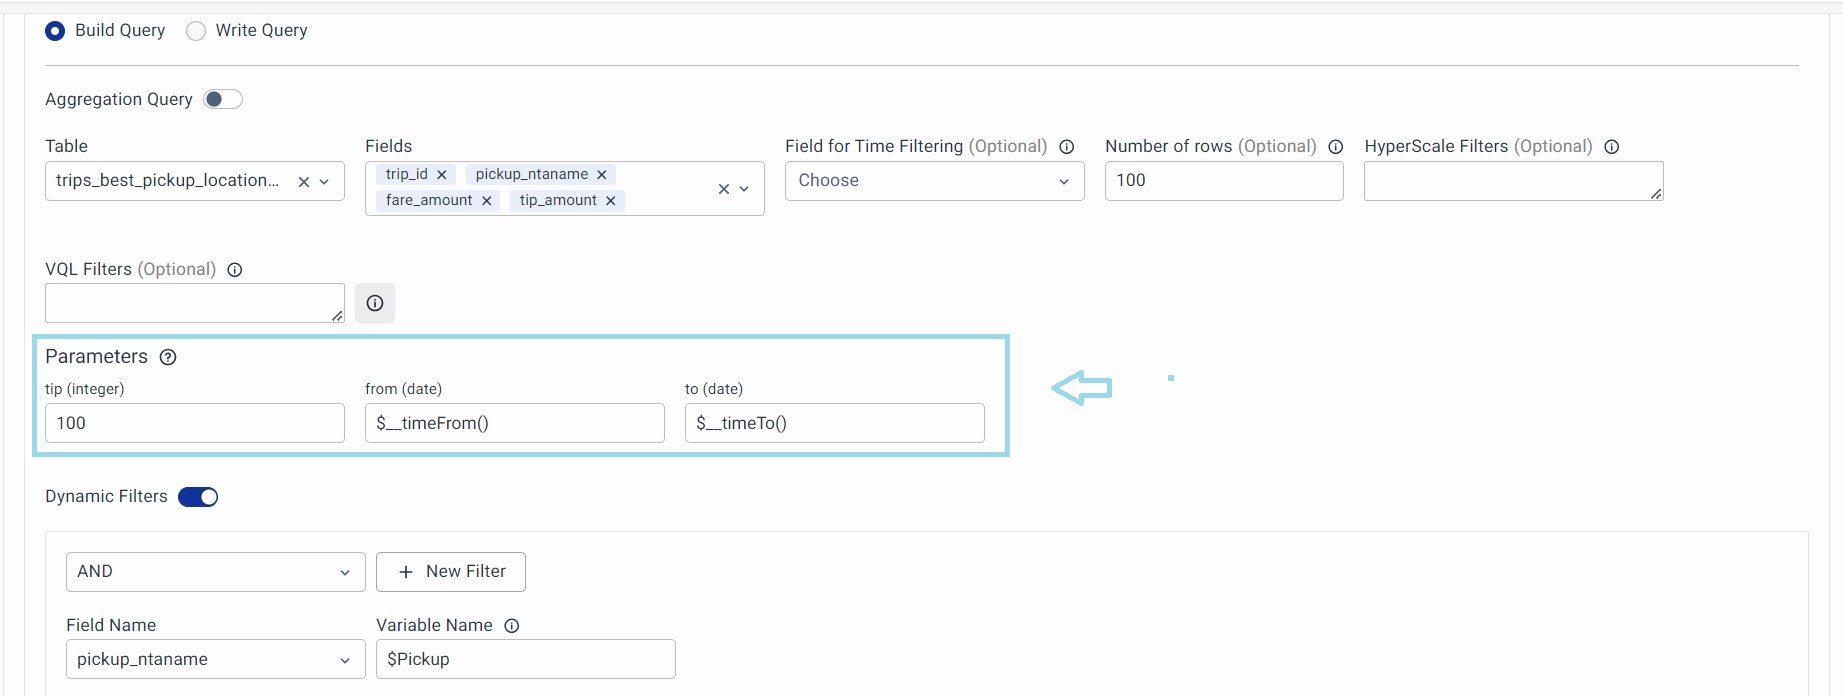
By using string, number, and date-time fields, along with macros for dynamic values, users can create precise filters and customize data views according to specific requirements.
- String Fields:
- Enclose string values in single quotes. For example: 'exampleString'
- Supports macros for dynamic values. For example:
$__dynamicVariable($Branch, 'Bengaluru')- Expands to the dashboard variable Branch, defaulting to 'Bengaluru' if not set.
- Number Fields:
- Supports direct values and macros. For example: 123.45
- Macro Example:
$__dynamicVariable($Latency, 0.1)- Expands to the dashboard variable Latency, defaulting to 0.1.
- Date-Time Fields & Expressions:
- Date-Time values can be provided in the following formats:
- String Format: 'YYYY-MM-DD HH:mm:ss' (enclosed in single quotes if the parameter expects a string).
- UNIX Time: It is valuable for filtering records or data based on time criteria, such as selecting records within a specific time range. Provide the UNIX time as a number if the parameter expects UInt32.
- Date-Time Expressions: Use SQL expressions like toDateTime('YYYY-MM-DD HH:mm:ss') or makeDateTime(year, month, day, hour, minute, second[, timezone]) if the parameter expects a DateTime.
- The user must ensure the SQL expression used outputs the correct data type expected by the parameter.
Aggregation in ElasticSearch
- Aggregations: Metric aggregation allows you to compute metrics in a specified form from the selected data points. For example: You can use the average aggregation with the memory utilization field to get an average value of memory utilization.
- Group By (Optional): Group-by allows you to organize data into different groups/buckets/categories. For example: A metric (CPU Utilization) is calculated for each host which means you are bucketing data at the host level.
These Group By serve as the logos/icons for servers, databases, etc., when these Data Models are used to generate the UTM.
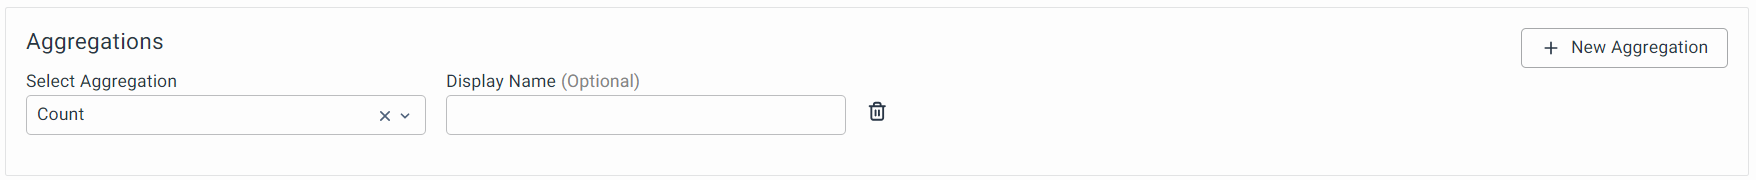
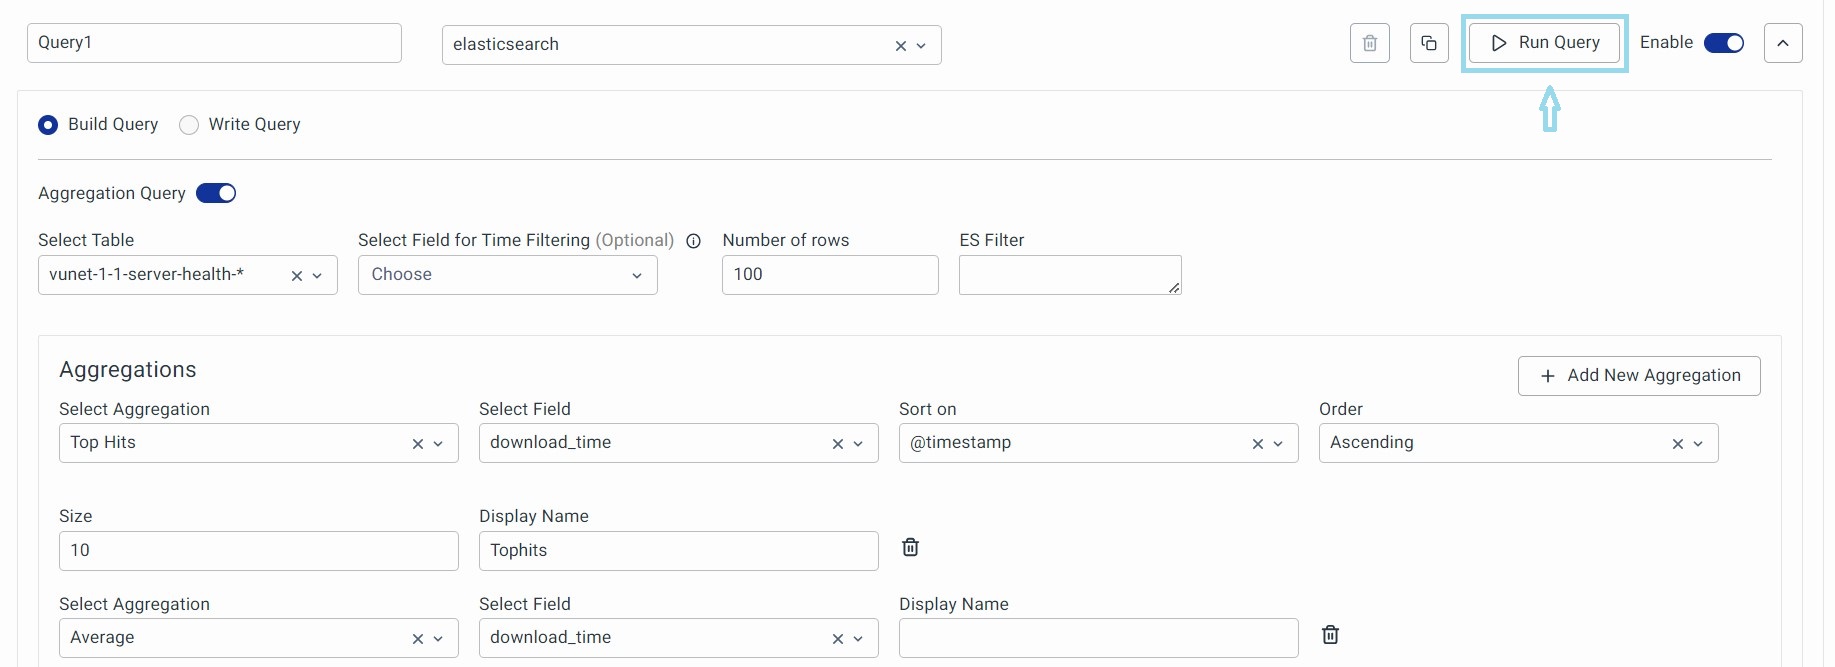
1. Aggregations
Choose an Aggregation from the dropdown based on your requirements. To add a new Aggregation, click on the + button.
There are different aggregations possible and you can select an aggregation from the dropdown. All aggregations fetch data based on the time selected in the Global Time Selector. Here is a list of aggregations supported:
a. Min: This allows you to fetch the minimum value of the selected field.
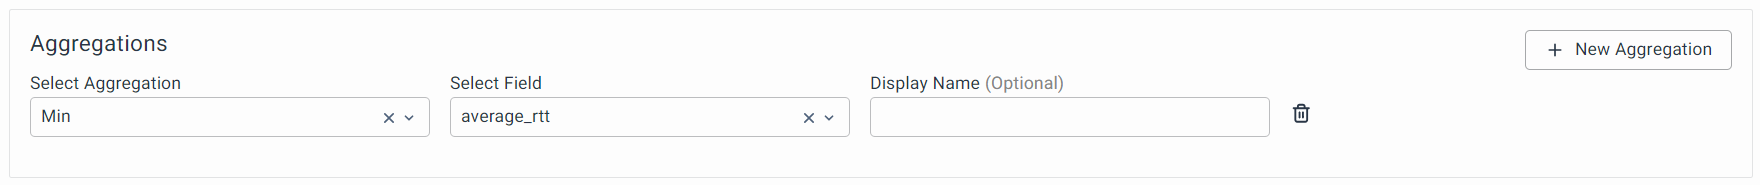
- Select Aggregation: Choose min from the drop-down.
- Select Field: Choose a field of interest.
- Display name: It is the name you can give to this aggregation. This name will be visible to users in Step 3 and Step 4 of the Data Model configuration.
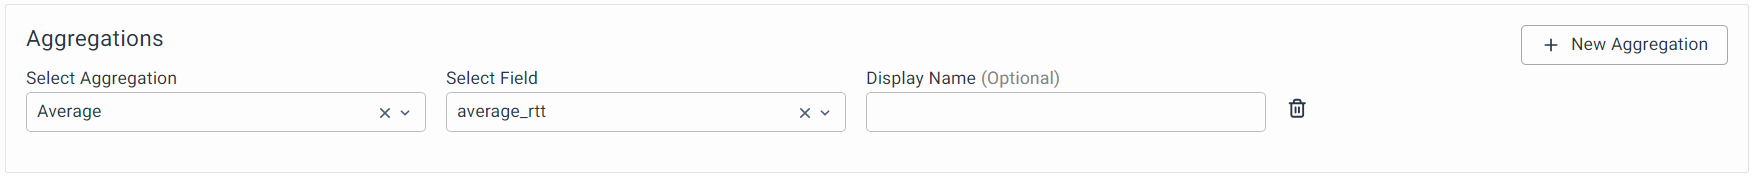
b. Average: Calculates the average value for a given field.
c. Count: Provides the total number of documents in that table
d. Max: The max aggregation returns the maximum value of a numeric field. Example: Max aggregate for the 'duration' field will return the highest value of the 'duration' field in all the records.

e. Percentiles: Computes a specific percentile for all the values in a given field. For example, the 10th percentile for ‘timetodetect’ is the value that is greater than the ‘timetodetect’ value of 10% of the transactions.

If you choose HyperScale DB, you can also select “Calculation Type” for Percentiles which was otherwise possible in Write Query.
f. Sum: The sum aggregation returns the total sum of a numeric field.

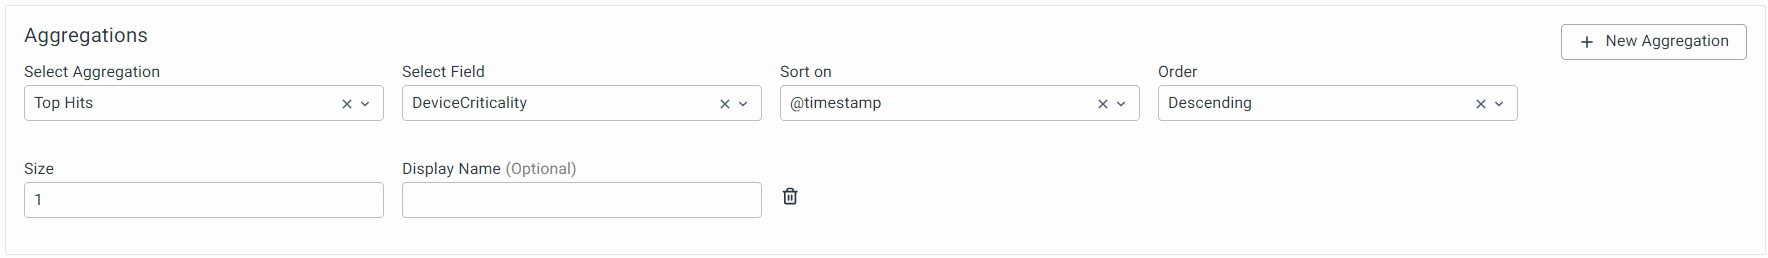
g. Top Hits: Top Hits allows you to get the most recent data for the selected field. It is now supported both on ElasticSearch and HyperScale DB. For example: Top Hits for a status field of a service will always return the most recent status of the service.
h. Unique Count: Provides a distinct count for selected fields. For example: A unique count of the host field will provide the number of unique hosts available in the selected table/index.

2. Group By (Optional)
You can group the aggregation in different buckets by using methods like Data Histogram, Histogram, and Term. Click on 'Add New Group By' to configure a bucket. Click on Add Group By to include the Buckets.

Following Buckets supported by Group By.
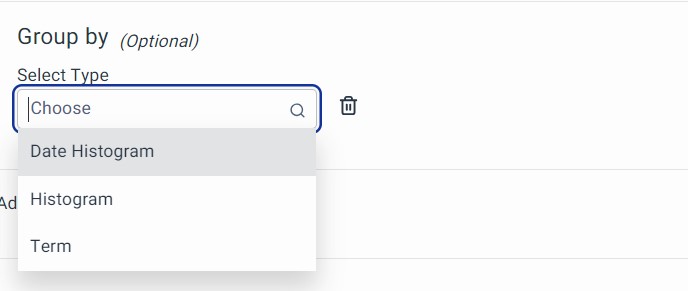
a. Date Histogram: You can use the "Date Histogram" to group time series data into continuous intervals:
In the Date Histogram, we further have 3 fields that need to be filled to make Date Histogram aggregation work which involve:
- Select Fields: Select the Data and Time field which represents the record time. In most of the cases, it would be @timestamp.
- Time Unit: It is the unit for which time interval needs to take place. Auto is the default value for this.
- Interval: It is the time interval. Units will be as per time unit.

b. Histogram: It is used to group numerical data into nearby intervals based on the frequency of occurrence. The "Interval" represents the size of these intervals in seconds.

c. Terms: Terms are used to group data based on the value of the selected field.

Under "Terms," there are four fields you need to fill in to make the term aggregation work. These fields include
- Order By: The results of the grouped data are ordered/sorted based on the field selected in Order-by.
- Note: While using Group By, vuSmartMaps also allows you to sort your data based on your preference. The sorting field can be different from the field used for grouping, hence, there is a separate selection.
- Field: This is the field that will be considered for ordering the data.
- Order: This determines the order in which the data needs to be sorted, either in ascending or descending order. There is no default sort so we have to choose either ascending or descending.
- Size: This limits the number of buckets/groups that should be returned by the query.
Advanced Settings: You can select a specific time zone by enabling Advanced Settings.

- Usually, the Data Models use the timezone of the database that is configured when we set up the Data Store to execute the queries.
- In a rare case scenario, if the timezone of timestamps in a particular table is somehow different from the one configured for the selected Data Store, then make use of Advanced Settings to set the appropriate timezone for that particular query.
- This option overrides the setting at the Data Store level and is not intended to be used unless you know the consequences.
For example, if the time timezone configured at the Data Store level is UTC, but for some reason, one particular table/index in that Data Store follows an Asia/Kolkata timezone, then enable Advanced Settings and override the timezone to Asia/Kolkata for that particular query on that table.
The display timezone (i.e. the timezone in which data will be displayed in previews, etc.) will always be the local timezone.
Dynamic Filters
Check out how to configure this here.
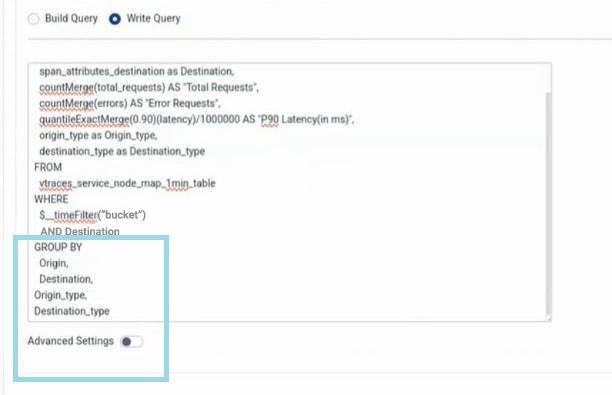
Write Query
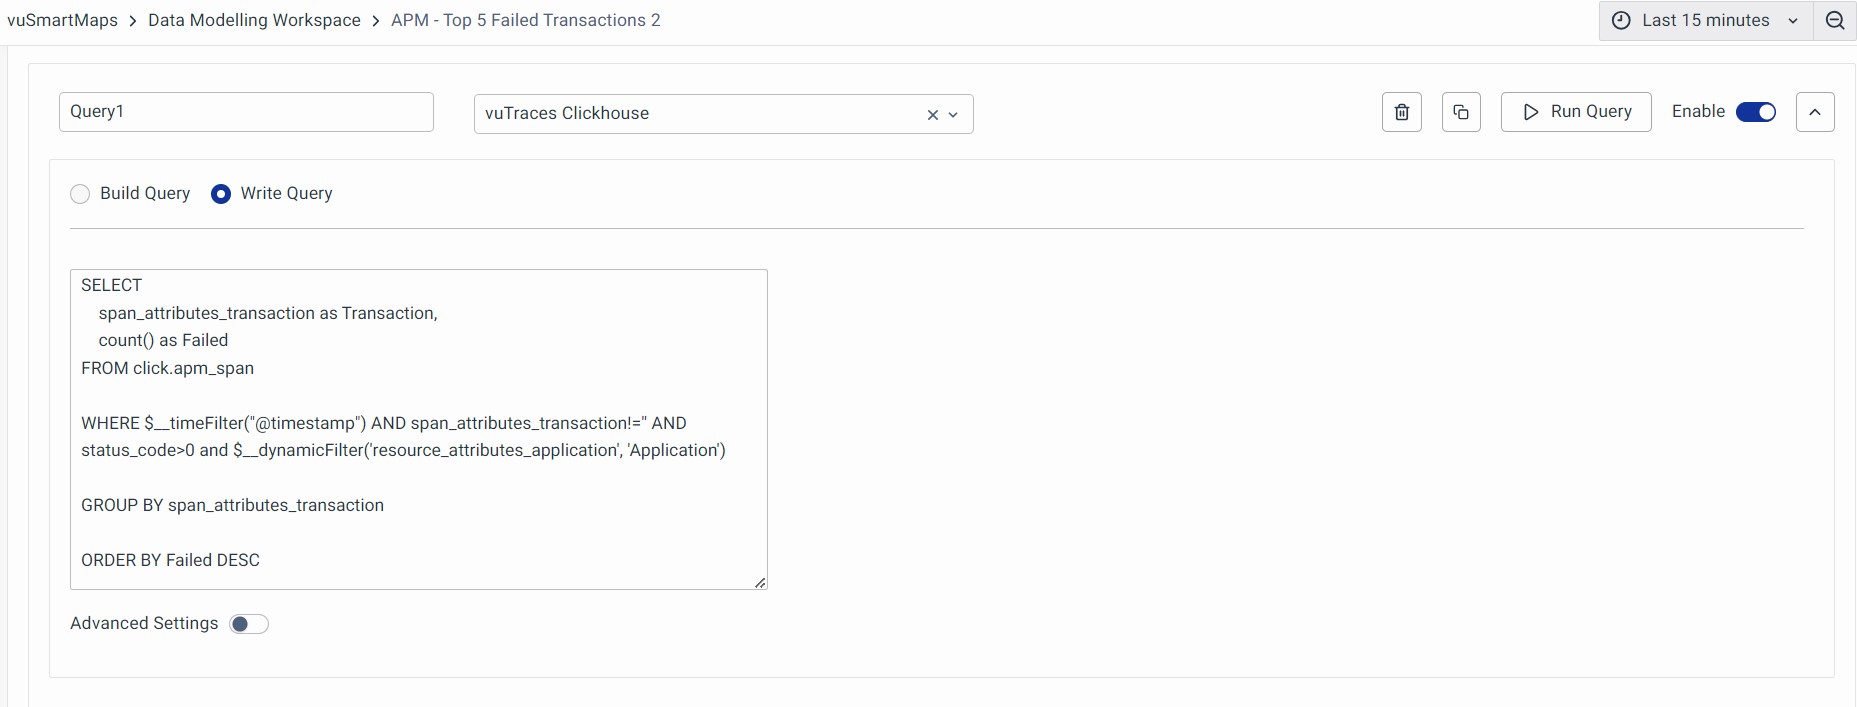
You can specify a raw database query for any data source if you want to use more advanced source-based queries. To do this, click on Write Query and enter the raw query. For example, a sample SQL query can be used to calculate the top failed transactions.
Here we are selecting span_attributes_http_target from the table click apm_span. The query counts the Failed transactions.
Script:
SELECT
    span_attributes_http_target as Transaction,
    count() as Failed
FROM click.apm_span

WHERE $__timeFilter("@timestamp") AND span_attributes_http_target!='' AND status_code>0 and $__dynamicFilter('resource_attributes_application', 'Application')
GROUP BY span_attributes_http_target
ORDER BY Failed DESC
- Valid syntax: Existing and added features.
$__timeFilter("time_column")# with double quotes [EXISTING]$__timeFilter(time_column)# without quotes [ADDED FEATURE]$__timeFilter(db_function("time_column", *args, **kwargs))# with function wrapping [ADDED FEATURE]$__timeFilter(db_function(time_column, *args, **kwargs))# with function wrapping [ADDED FEATURE]
- Invalid syntax: Do not use. Deprecated old syntax, will be removed in a future release. Continues to work currently due to backward compatibility.
$__timeFilter('time_column')# with single quotes [EXISTING, DEPRECATED]
After completing this query, you can preview, validate, and move on to the next step.
Run Query
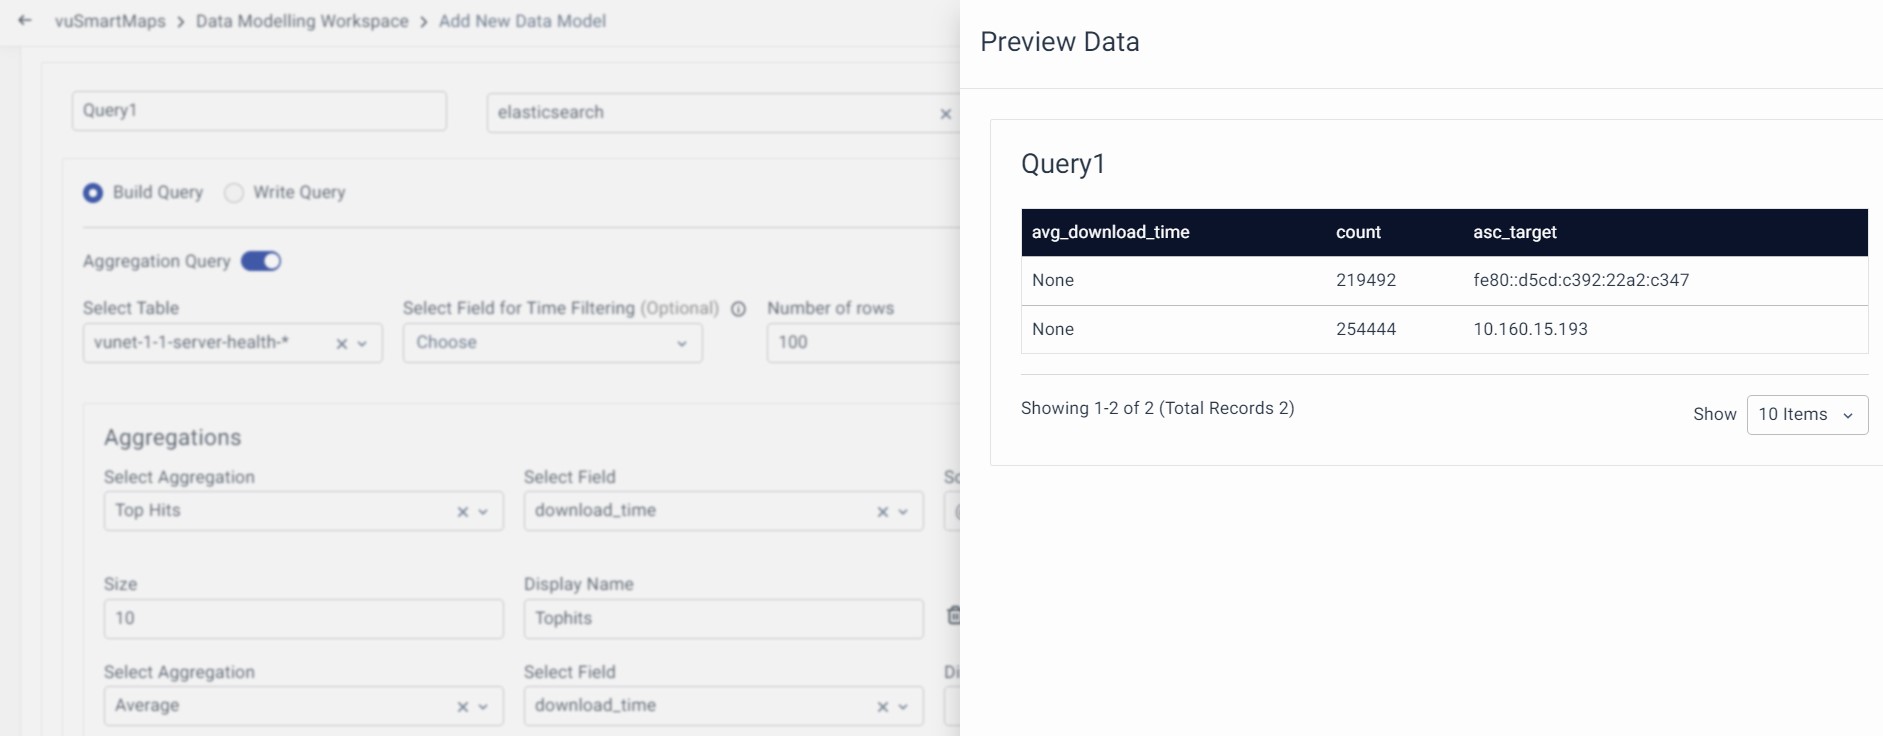
You can now preview the results of any query that is created. There are two ways to preview,
- Run Query: This will run a single data model query.
- Run all Queries: This will run all the Data Model queries. It will display all the results of every query specified in that data model.
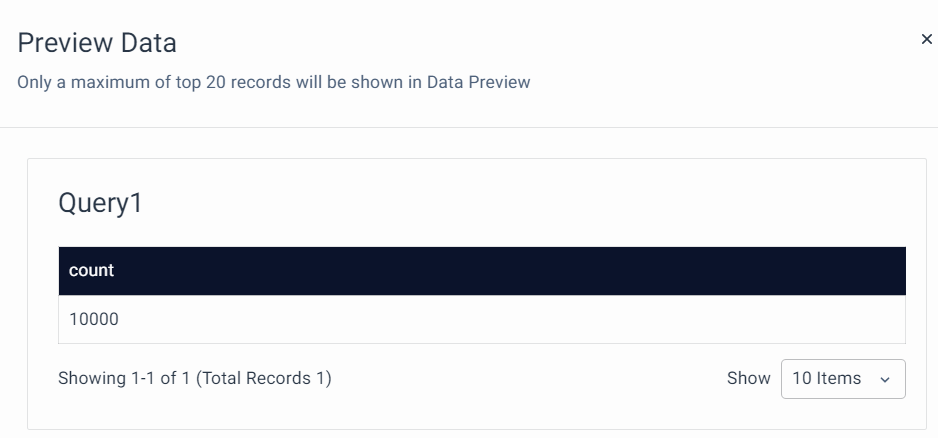
Run Query: Click on the run query option to get a preview of the selected query.
To run all the queries, click on the Run all queries option at a data model level to preview all the queries in a data model. The results will be displayed as shown below.
Once the preview looks accurate click on Validate and Next to move to the third step.
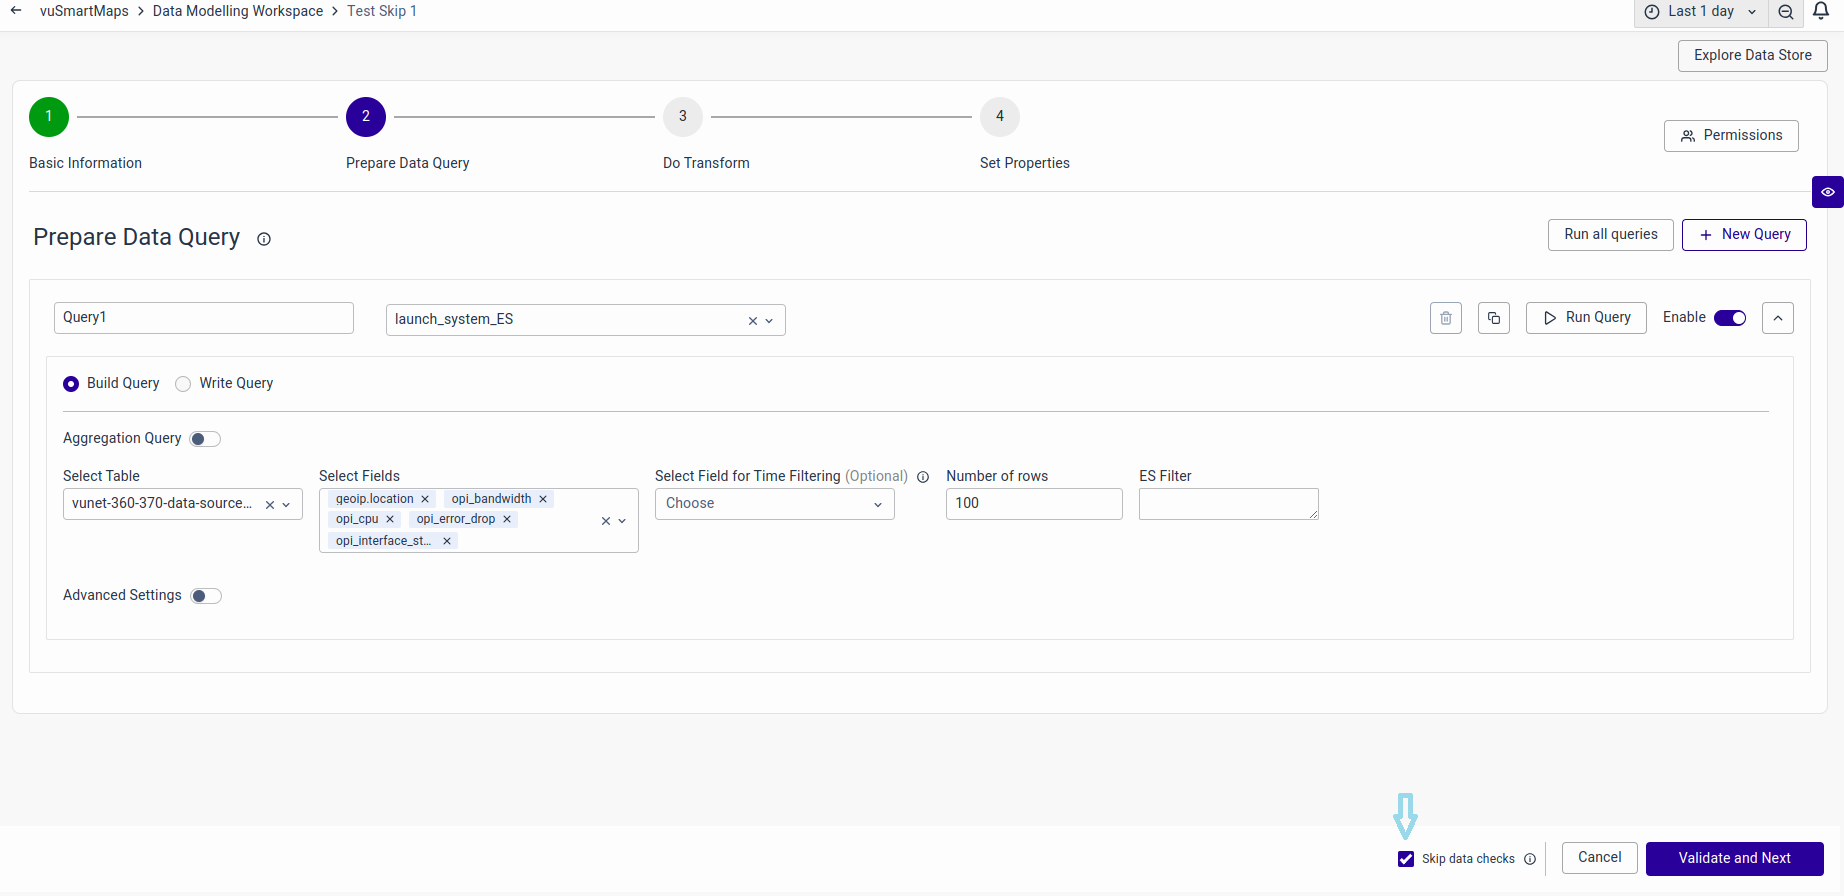
Skip Validation
During the creation of a data model where data is currently unavailable in the data store, queries cannot be validated. In such instances, clicking the 'Validate and Next' button will result in an error. To bypass data checks and proceed to the next step, you can enable 'Skip data checks' before clicking on 'Validate and Next'.
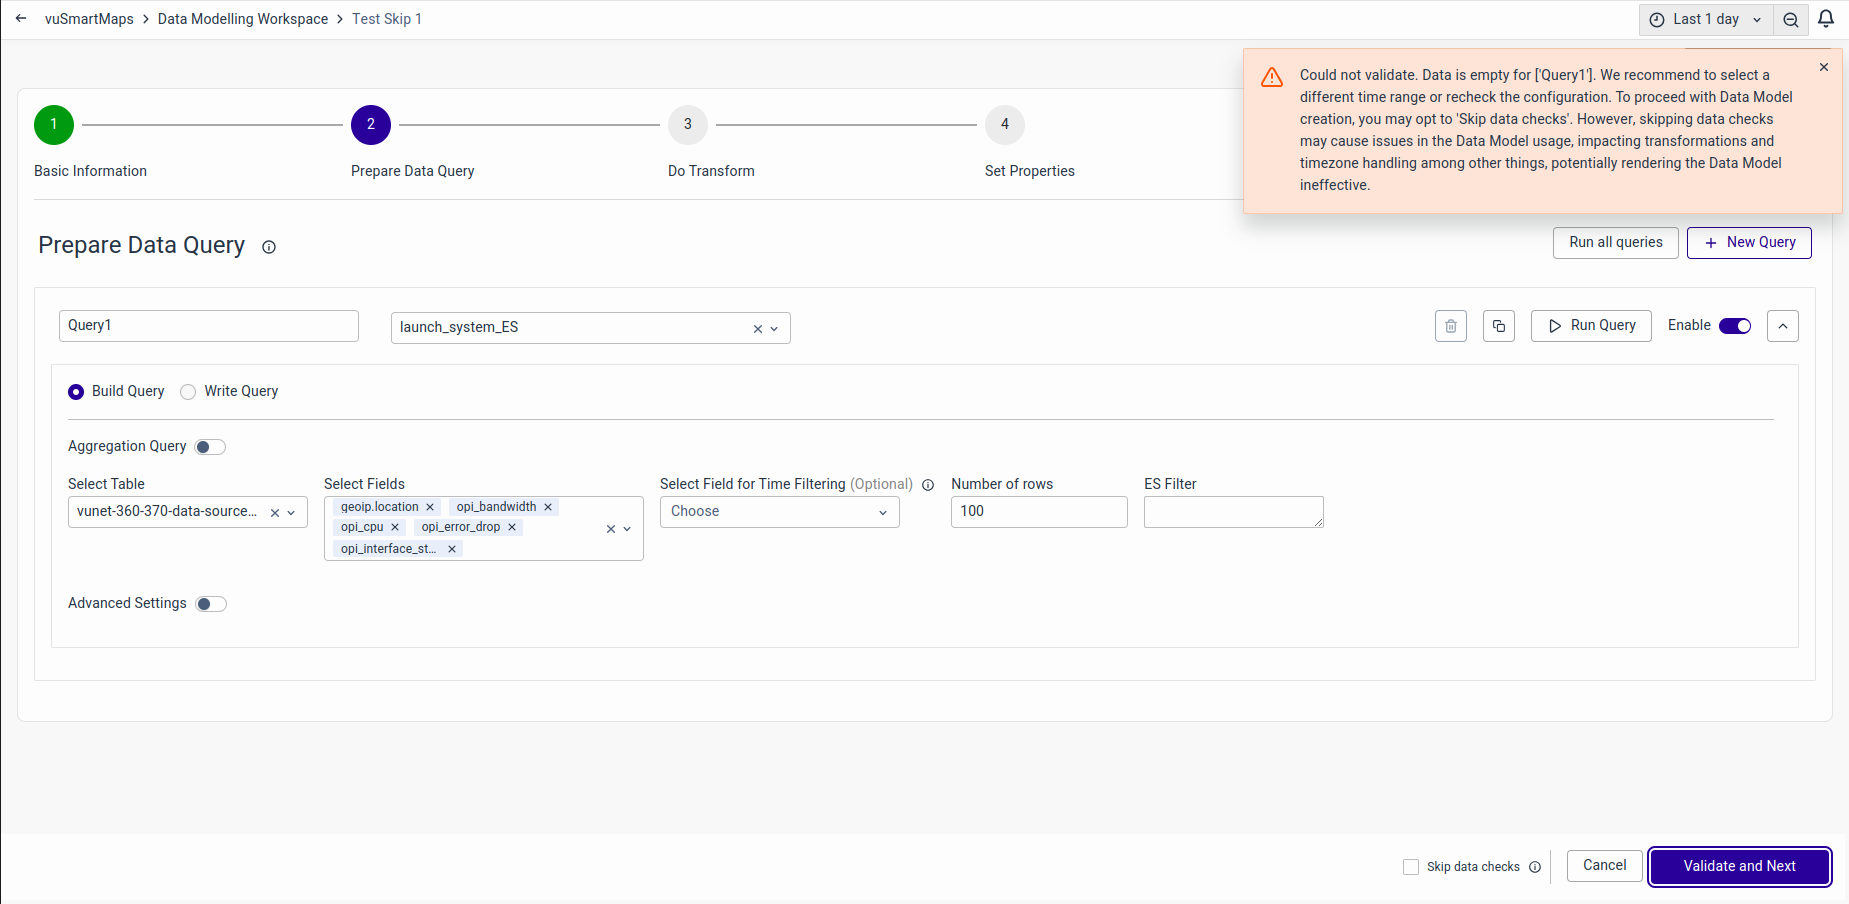
You can skip the validation by clicking Skip Data Checks as shown below.
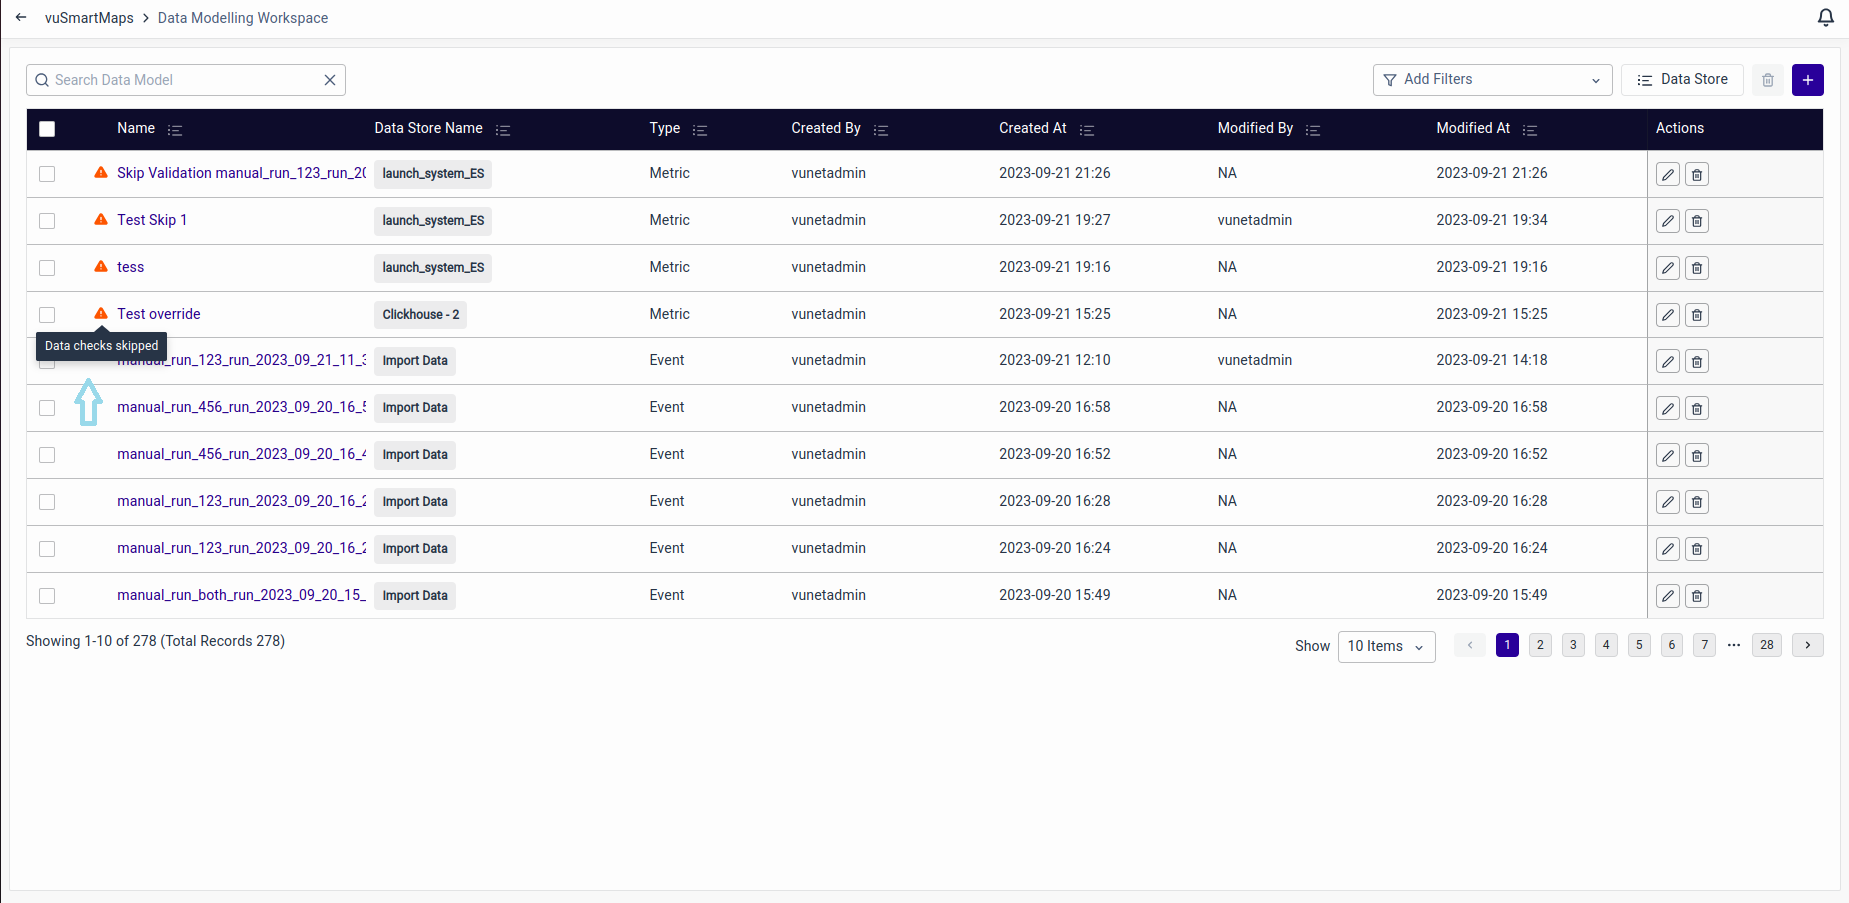
Such skipped Data Models will have a warning tag before the name on the landing page as shown below.
Other query options
You can use other operations to Copy, Delete, and Disable a query.
Copy: This allows you to copy an existing query to create a new query within the same data model.

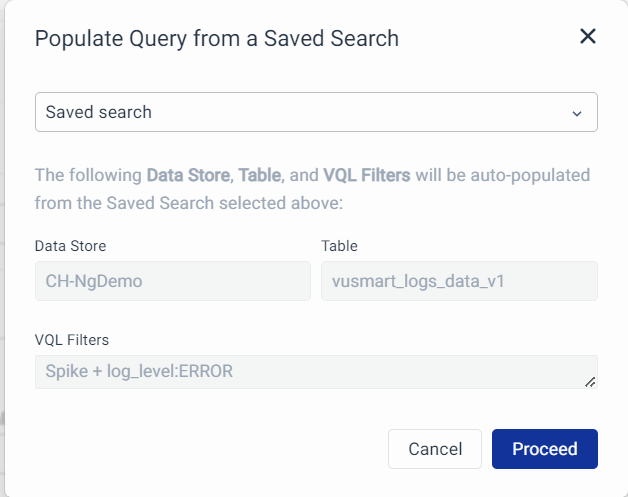
Saved Search: This allows you to populate a query from a Saved Search. Click on Proceed to auto-populate the query.
Disable: You can disable a query in a data model. When a data model is used somewhere, a disabled query won't be executed.
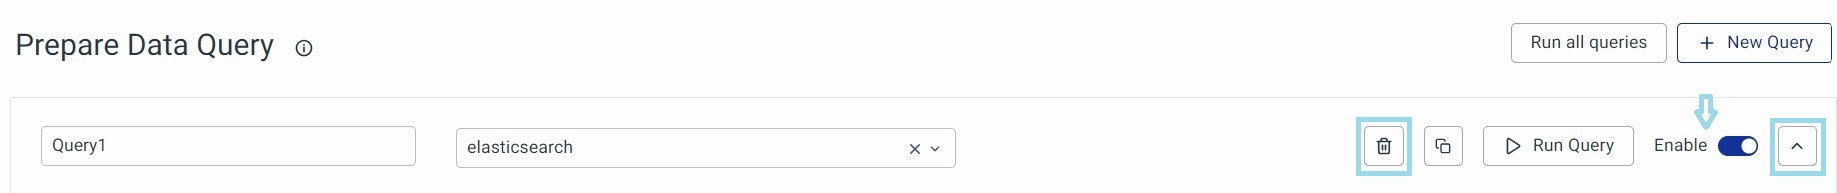
Delete: You can delete a query. This means you can remove a query entirely from your data model.
Collapsible arrow: You can click on the button to hide the query content and keep only one of them to focus on that.
Do Transform
After successfully validating the query section, you'll enter the transformation section. The transformations are used for data manipulation. You can combine data from two tables or data stores by using a join transformation when required.
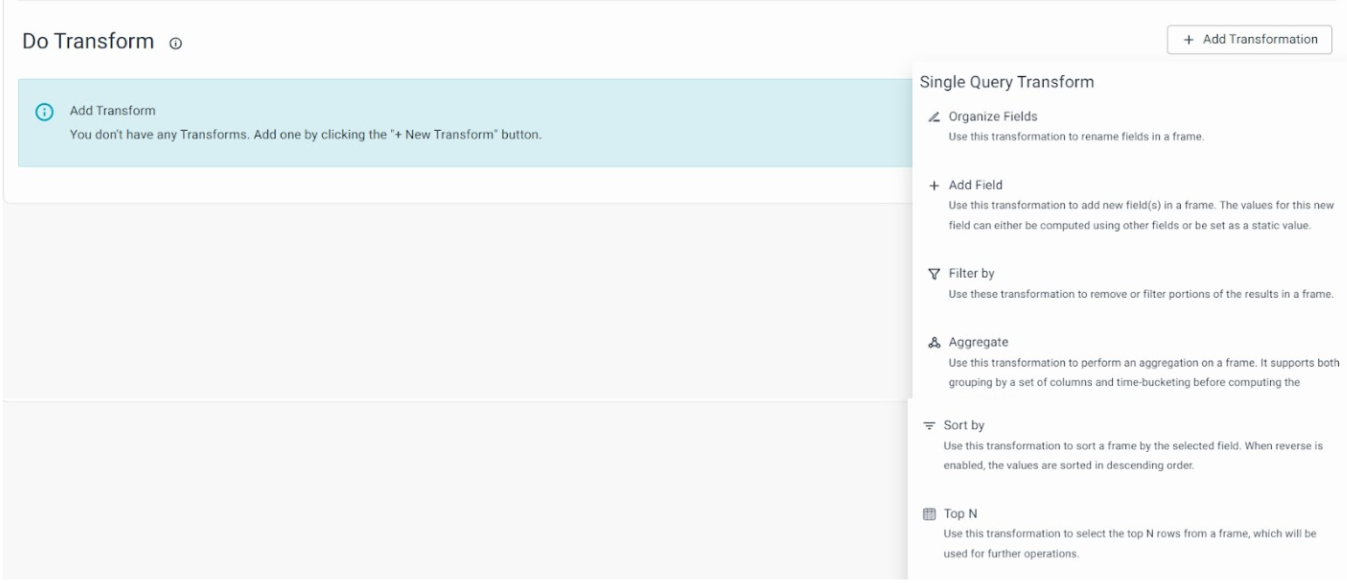
On this page, you'll see a list of supported transformations. Each transformation here comes with a description of its highlights. Clicking on a transformation will take you to the respective transformation screen, where you can create and configure the transformation.
Single Query Transform:
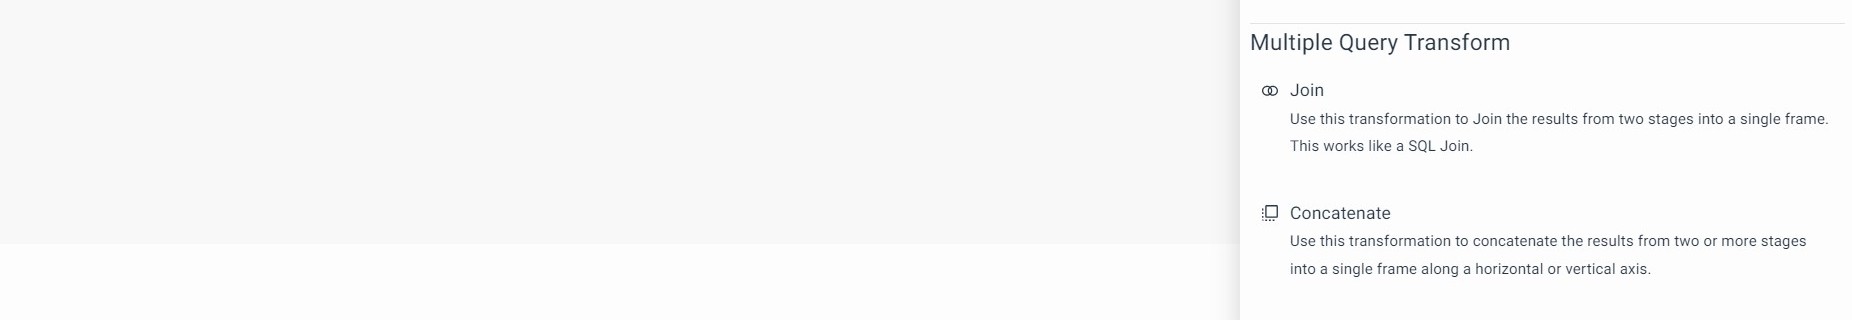
Multiple Query Transform: In addition to incorporating all the single query transformations, two additional transformations are available for handling multiple queries.
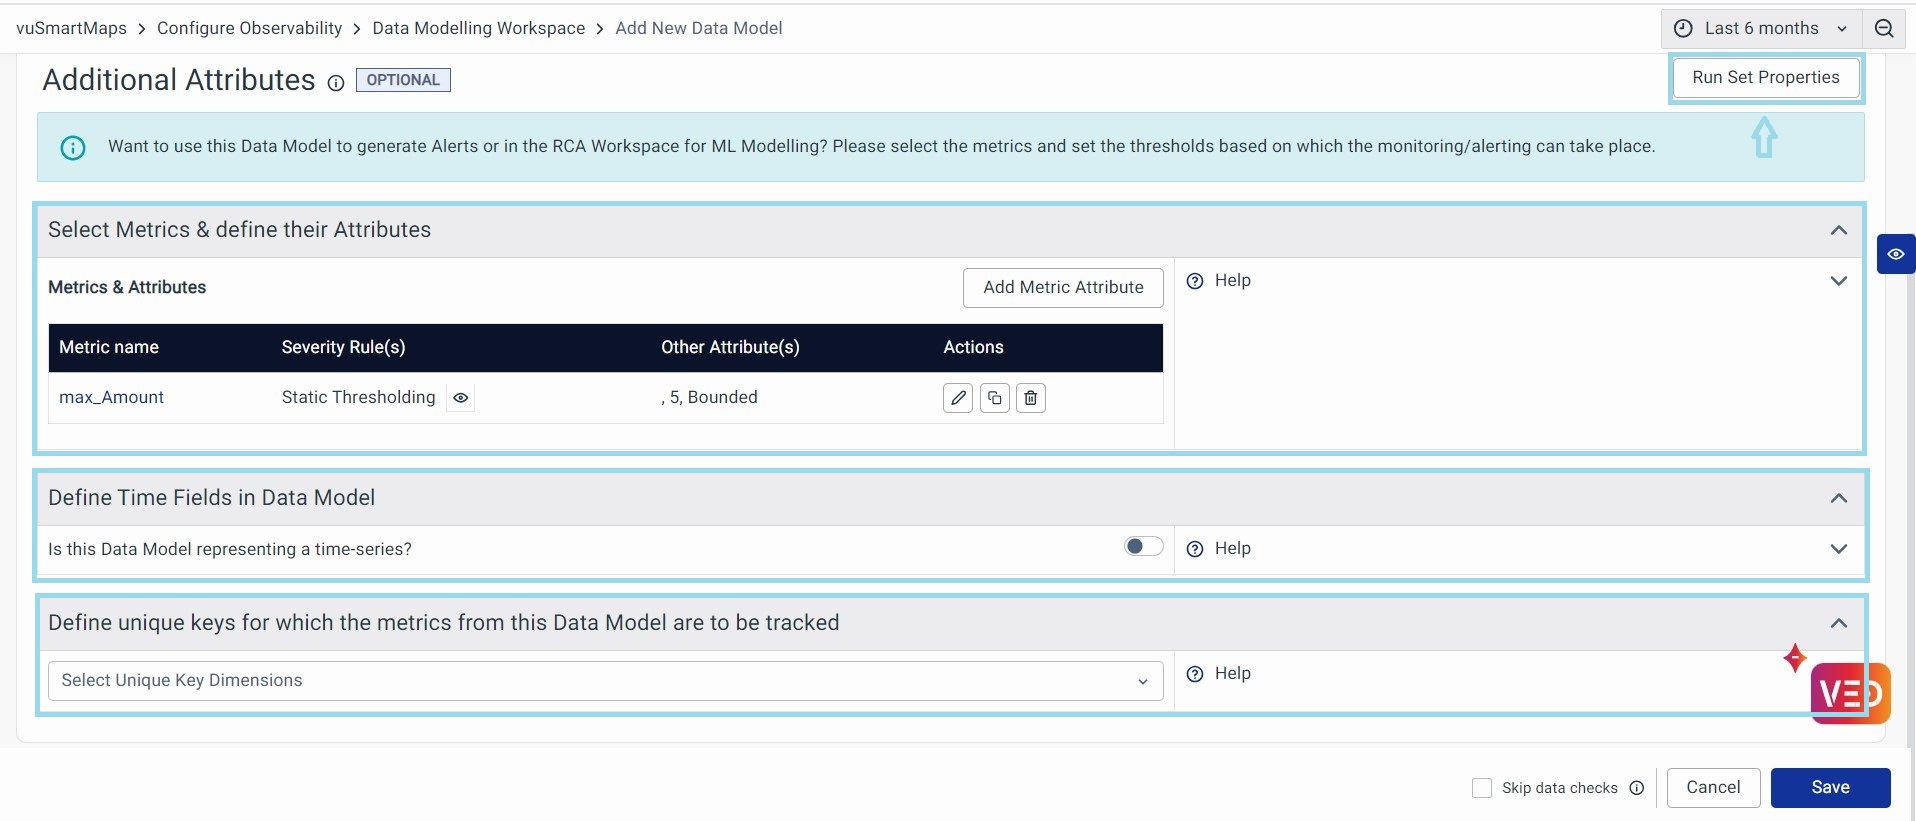
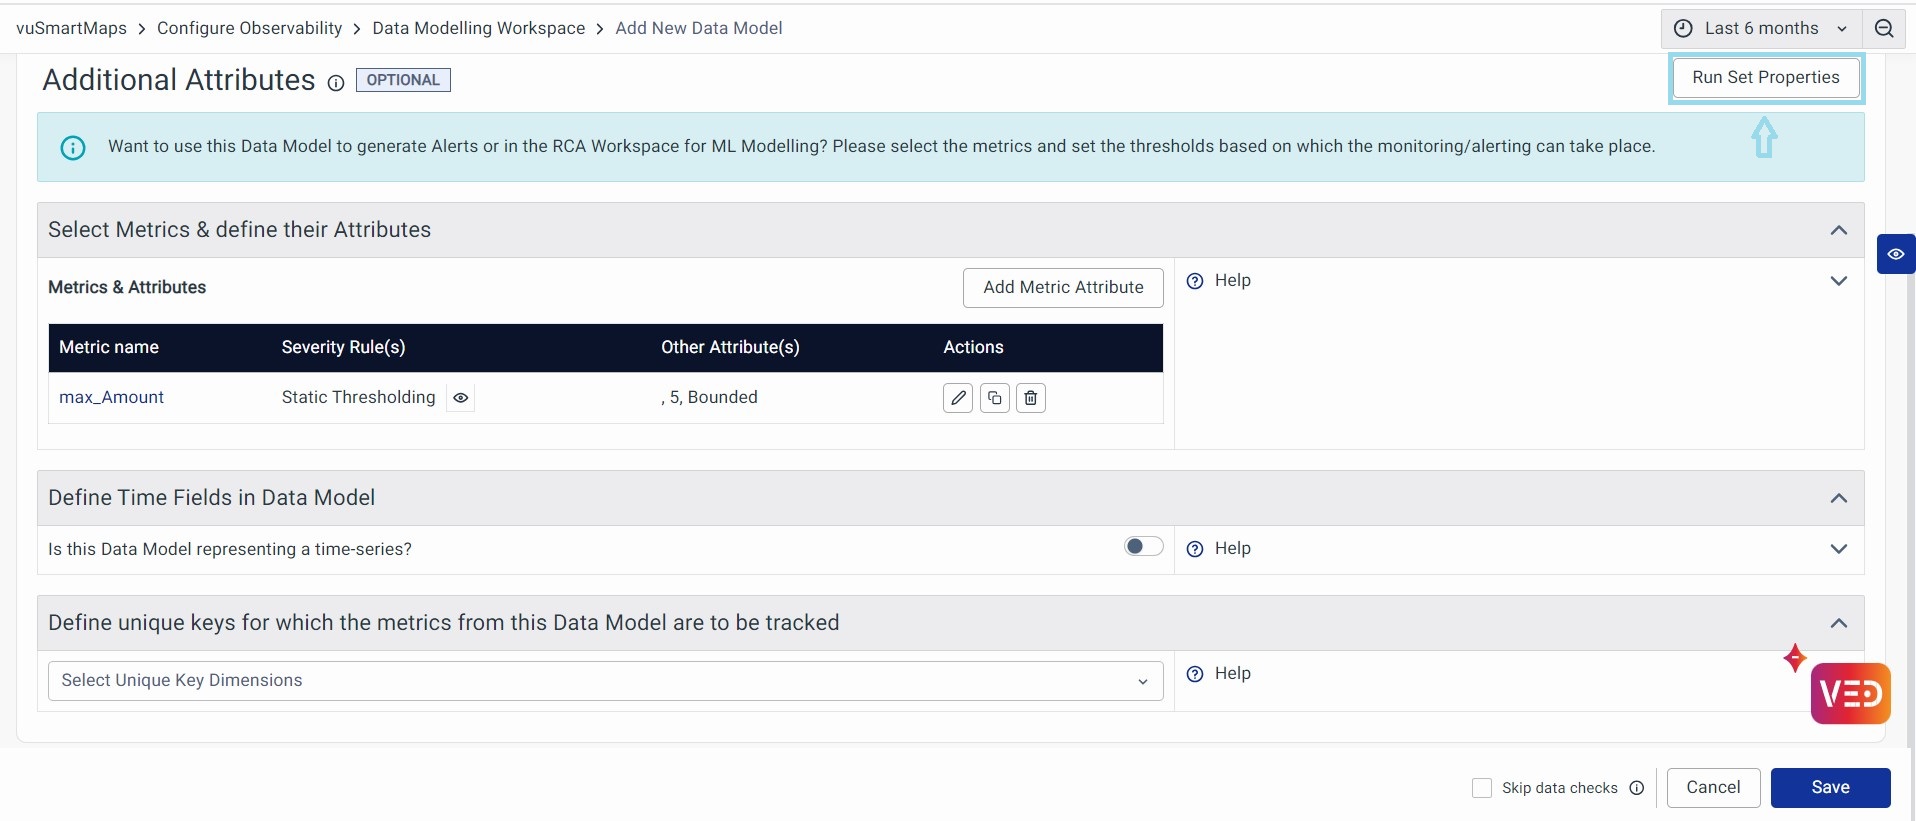
Additional Attributes
You can use the Additional Attributes step to select the metrics and buckets that should be exposed for this data model. Additionally, you can set properties for ML modeling and threshold for alerting purposes.
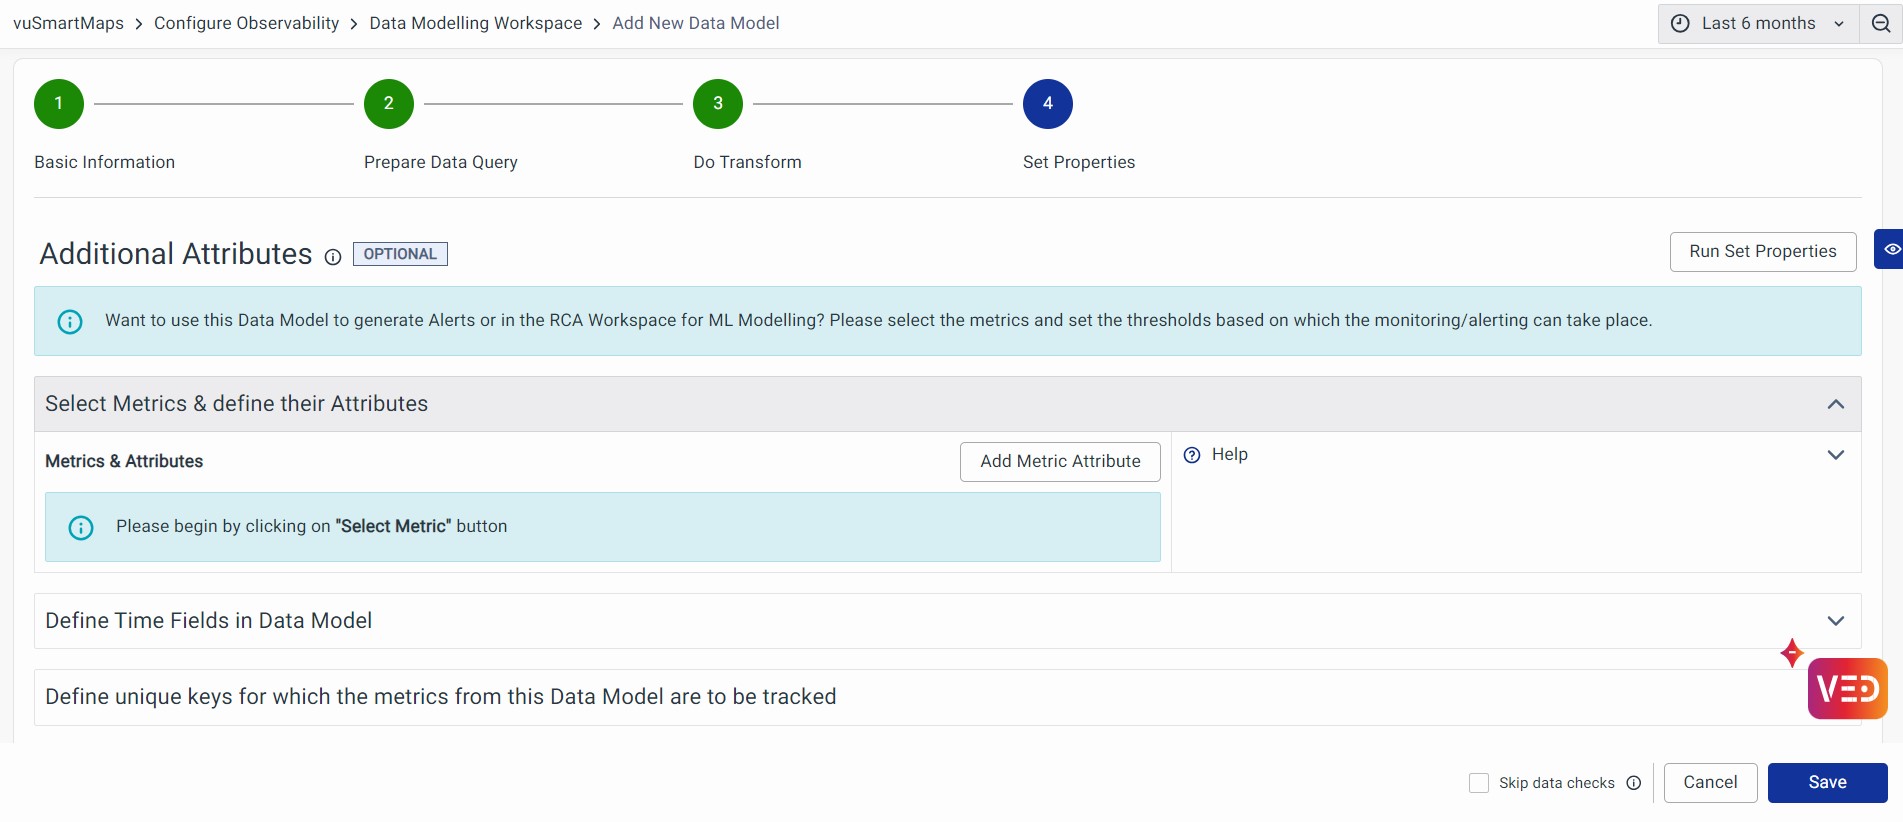
Click Add Metric Attribute to add Metric Name, Severity Rules, and other attributes. These definitions are used by Visualizations, Alerting, Reporting, and Machine Learning modules, to handle the metric and their monitoring/reporting.
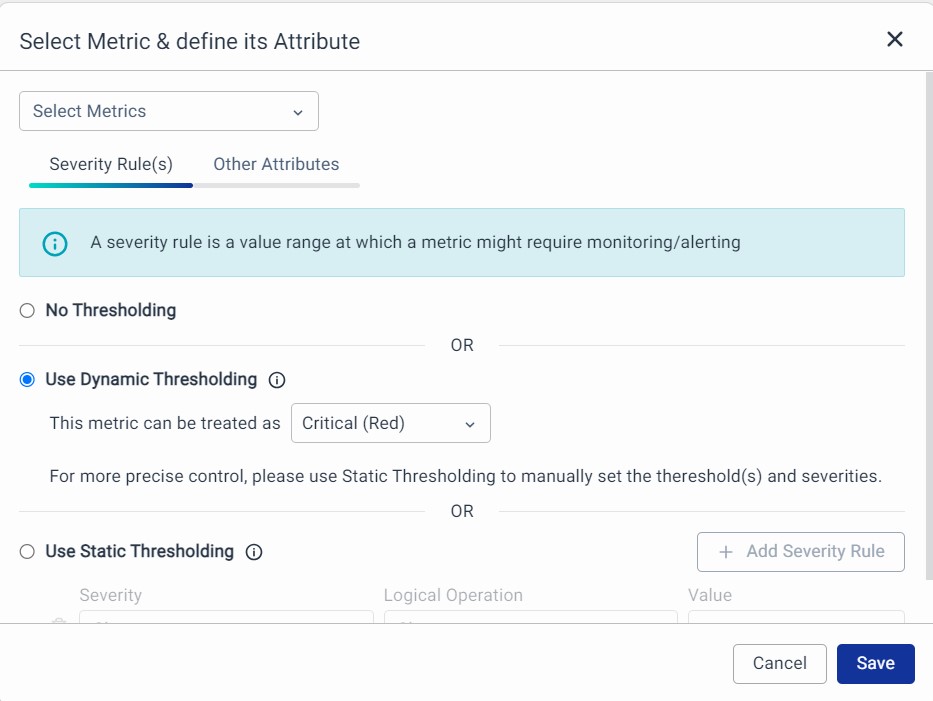
Select Metrics: Pick a field representing the Metric or key data point. You have the following 2 sections to make the required configurations.
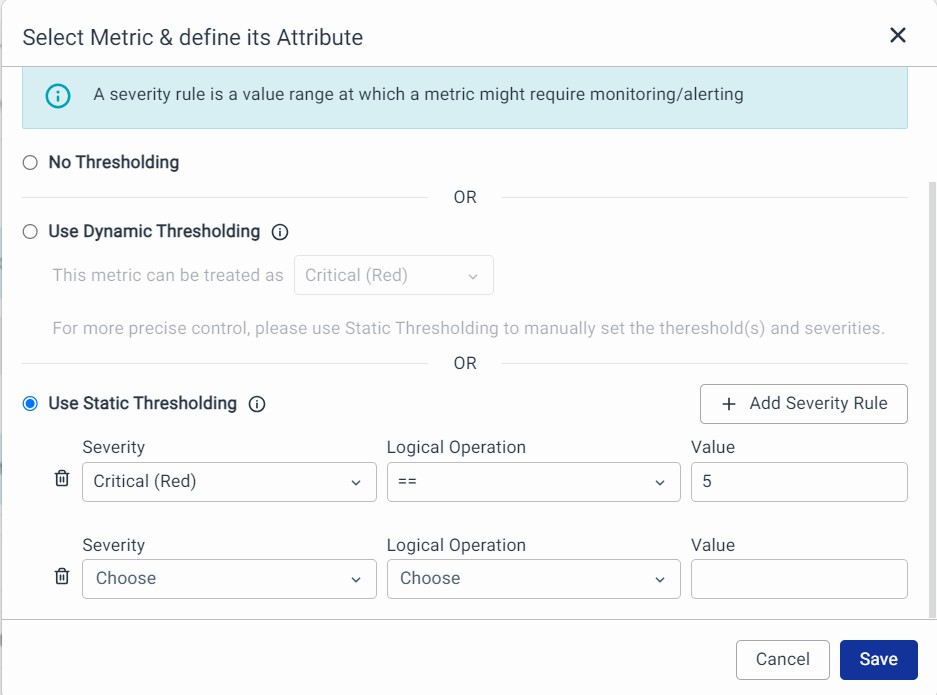
1. Severity Rules: A severity rule is a value range at which a metric might require monitoring or alerting.
- No Thresholding: Choose this if you do not want to set any thresholds.
- Use Dynamic Thresholding: It helps you in auto-baselining and Health Scoring for the given metric using ML. This happens when we use the Data Model in Alerts. Dynamic thresholds help detect problems that may have gone unnoticed when using static thresholds.
- Use Static Thresholding: Set numeric values to receive notifications when the metric exceeds specific thresholds (up to 10 thresholds).
2. Other Attributes (Optional): The attributes presented in this section are tailored for Data Models utilized within the RCA Workspace.
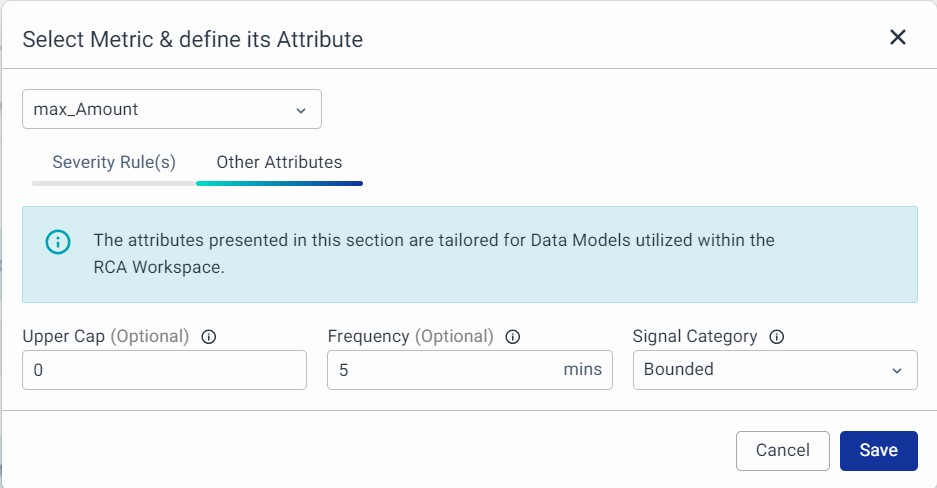
Each metric can now be given with information on the following properties.
- Select Metric Name: Choose a unique name for the metric to use in your workspaces.
- Upper Cap (optional): If you know the maximum value, you can specify it here (numeric).
- Frequency (optional): Indicate how often the metric data is recorded in minutes (numeric).
- Signal Category: Categorize your metric as Bounded (known upper and lower limits), Unbounded (unknown limits), or Binary (only two values).
All these settings are very useful when the Data Model is used in the RCA Workspace.
Define Time Fields in Data Model
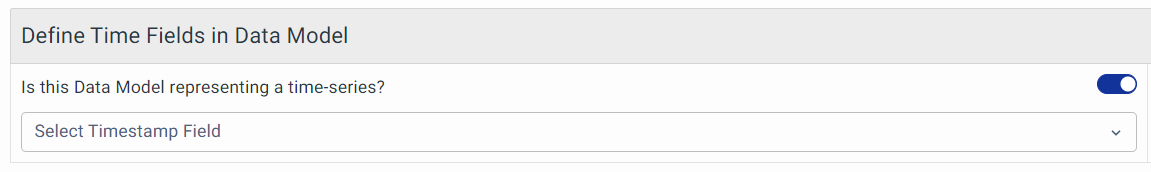
This helps you enable the timestamp for the given Data Model. It is data that is recorded over consistent intervals of time. You should enable this whenever the Final Data is time-series data. Time series data could come when bucketed data is fetched, or raw time series data is queried.
Define unique keys for which the metrics from this Data Model are to be tracked
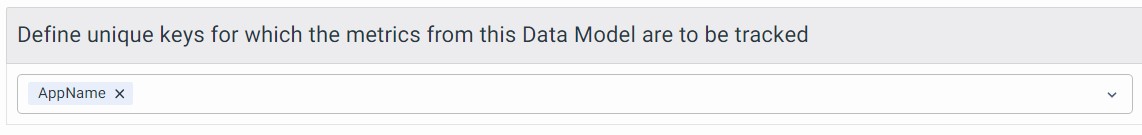
Unique Keys are fields in the data model output that help in distinguishing different categories of data in the data model. This is used by Alerting and Machine Learning Modules to track the metrics separately for each value of unique keys.
Run Set Properties: Once you've finished configuring your metrics, simply click the Run Set Properties button at the top right. This will validate the metric properties, and the Data Model will perform a background check based on the new information you've provided.
Preview
Click on the blue eye icon to preview the results.
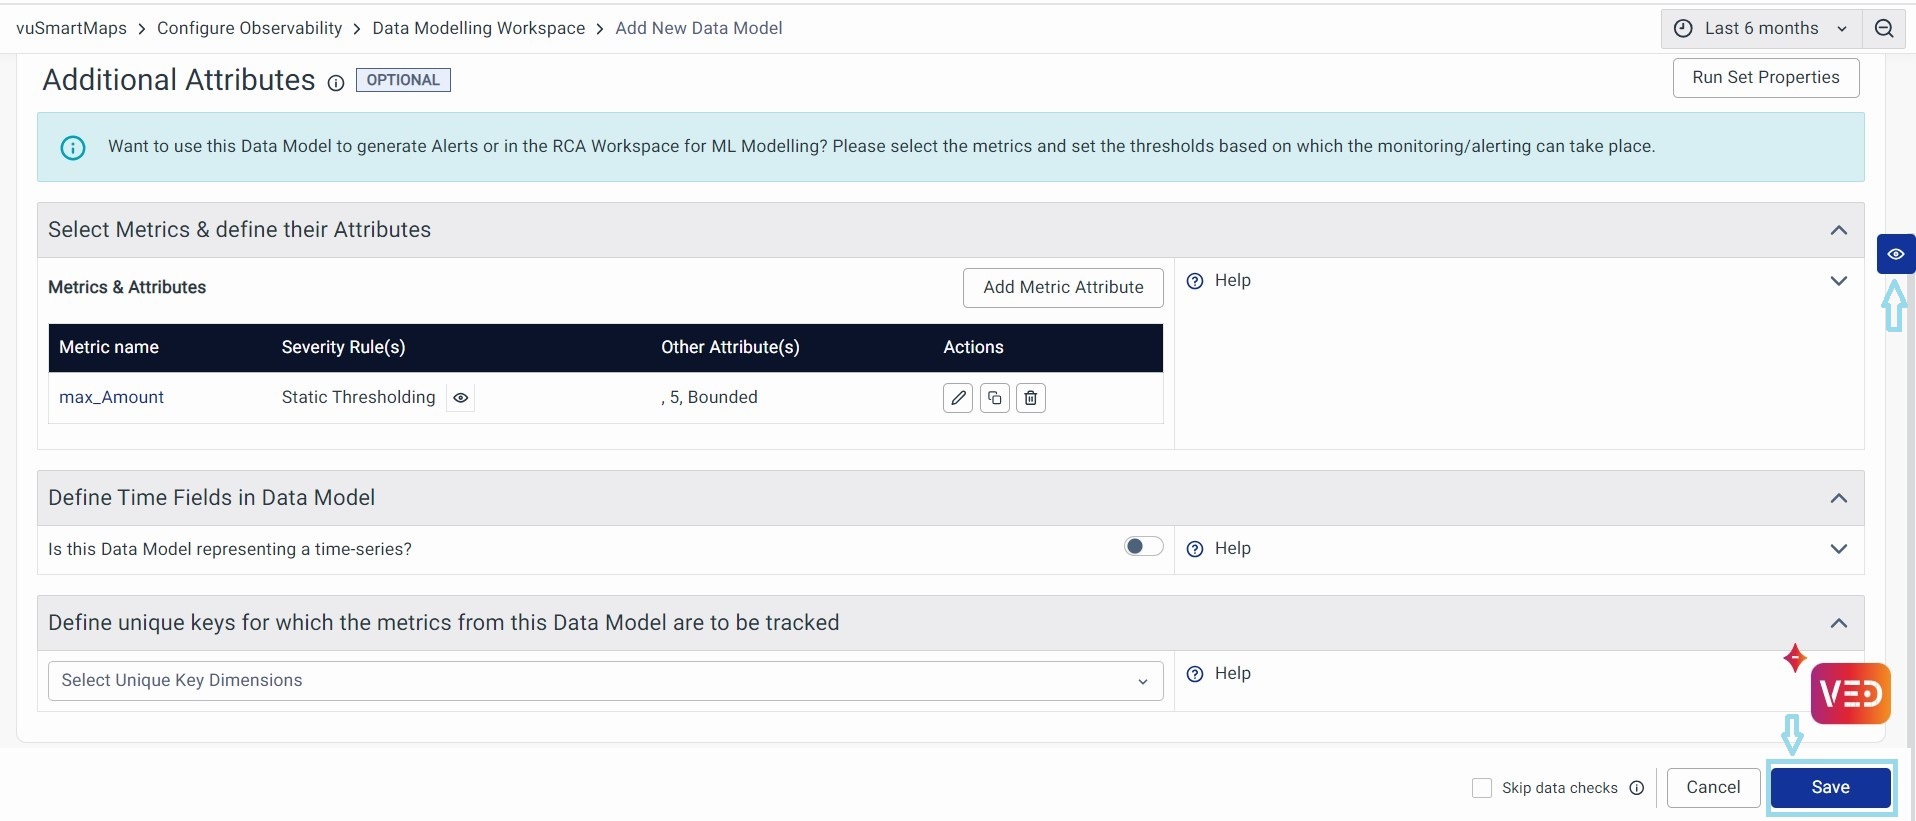
Save
Once validation is complete, the Save button gets activated at the bottom right. Click on it to save the Data Model. With this, The Data Model creation is now complete.
Support for Dynamic Filters in Dashboards for UTM and Insights Visualization
Dynamic filters allow you to set up custom filters within your queries using the "$" symbol with a variable.
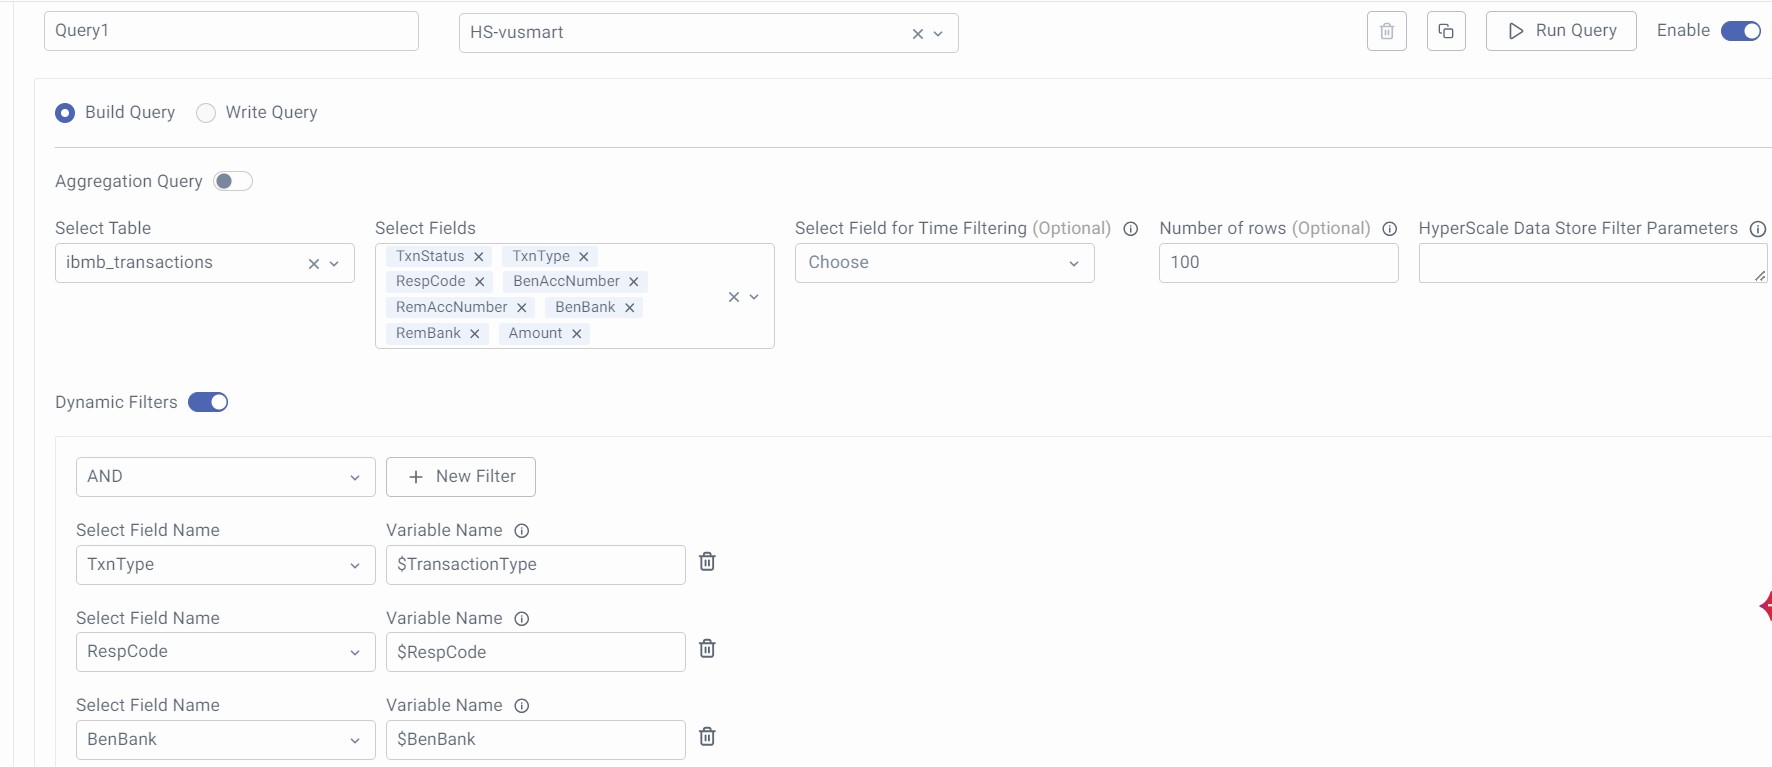
For Hyperscale DB using Build Query:
Enable the Toggle button to configure the Dynamic Filters in the Build Query section of the Data Model.
Select the Field name, based on which you want to filter the data, and provide the Variable Name. The same variable name will be used to configure 'variable' in the dashboard and use it as a Filter. (Variable name is case sensitive). Click on the + New Filter button to add multiple filters.

This is what the whole Build Query configuration looks like for a sample ibmb_transactions table.
For Timescale Datastore (PSQL) using Write Query:
-
When defining a query for a data model, including placeholders for where clauses based on important filtering fields.
-
Example: select name, ip, location group by the location where
$__dynamicFilter(column, $variable)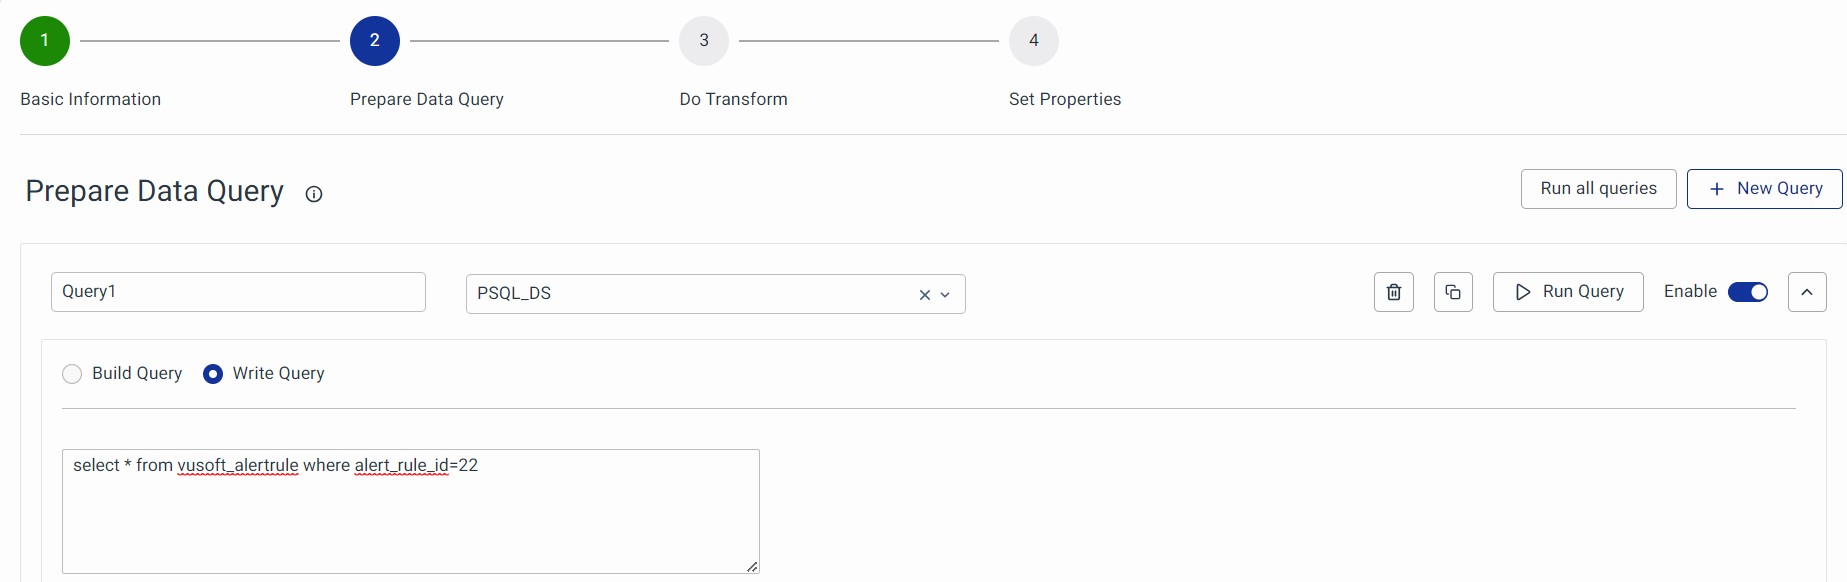
-
Example: If we have multiple dynamic filters in a single query, then the query should be sent as:
SELECT c1, c2, c3 FROM T1 WHERE $__dynamicFilter(c1, $c1) **AND** $__dynamicFilter(c2, $c2). The column name can also be used within double quotes:("c2",$c2).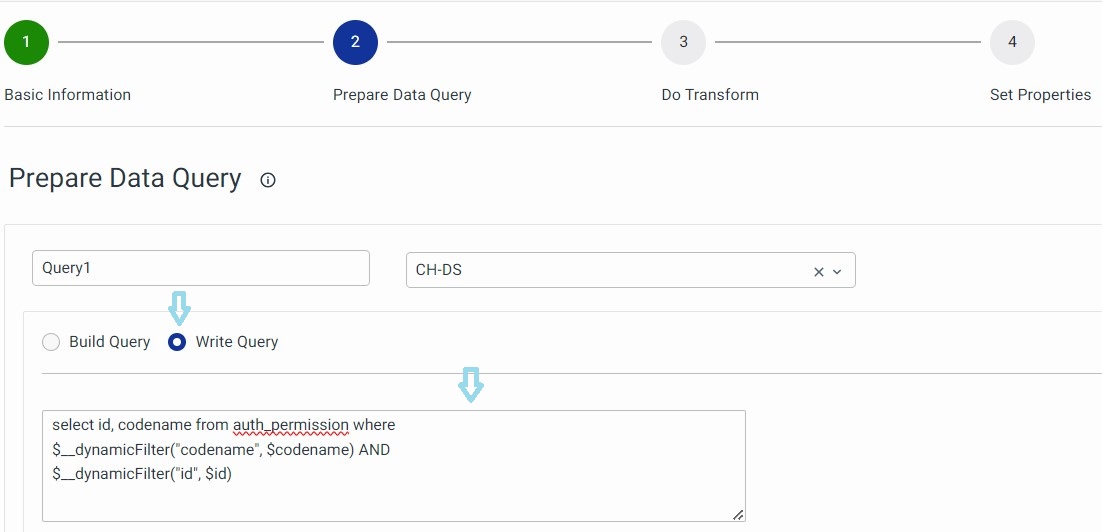
-
-
When running these queries if the variable (e.g., "location") is not available, the where clause is excluded. However, if the variable is present, it creates the where clause based on the user's selection in the dashboards.
- Valid syntax: Added features.
$__dynamicFilter("column", $variable)# with double quotes [ADDED FEATURE]$__dynamicFilter(column, $variable)# without quotes [ADDED FEATURE]$__dynamicFilter(db_function("column", *args, **kwargs), $variable)# with function wrapping [ADDED FEATURE]$__dynamicFilter(db_function(column, *args, **kwargs), $variable)# with function wrapping [ADDED FEATURE]
- Invalid syntax: Do not use. Deprecated old syntax, will be removed in a future release. Continues to work currently due to backward compatibility.
1$__dynamicFilter('column', 'variable')# with single quotes [EXISTING, DEPRECATED]
- For Elastic Search DataStore, use both Build Query and Write/Raw Query Dashboard Filters.
- For PSQL DataStore, use Write Query exclusively for Dashboard Filters.
