3T Alert Correlation
Rule-based correlation involves using a determined set of correlation profiles (rules) to correlate events originating from a list of event sources. Each profile has a set of instructions that guides the system to combine 2 or more events into a single cluster. The cluster generated is termed a Correlated Event.
For example,
- An instruction that says to cluster all the events originating from the location Bangalore is a Correlation Profile.
- Similarly, an instruction that guides the systems to combine all the events that represent an anomaly in a specific device is a Correlation Profile.
We can associate various metadata to a Correlated Event like the count of raw events, start time representing the timestamp when the correlated event was first formed, duration, end time, and so on. This provides the users the ability to make more sense of the problem at hand and reduce the time to fix it.
Add Workspace
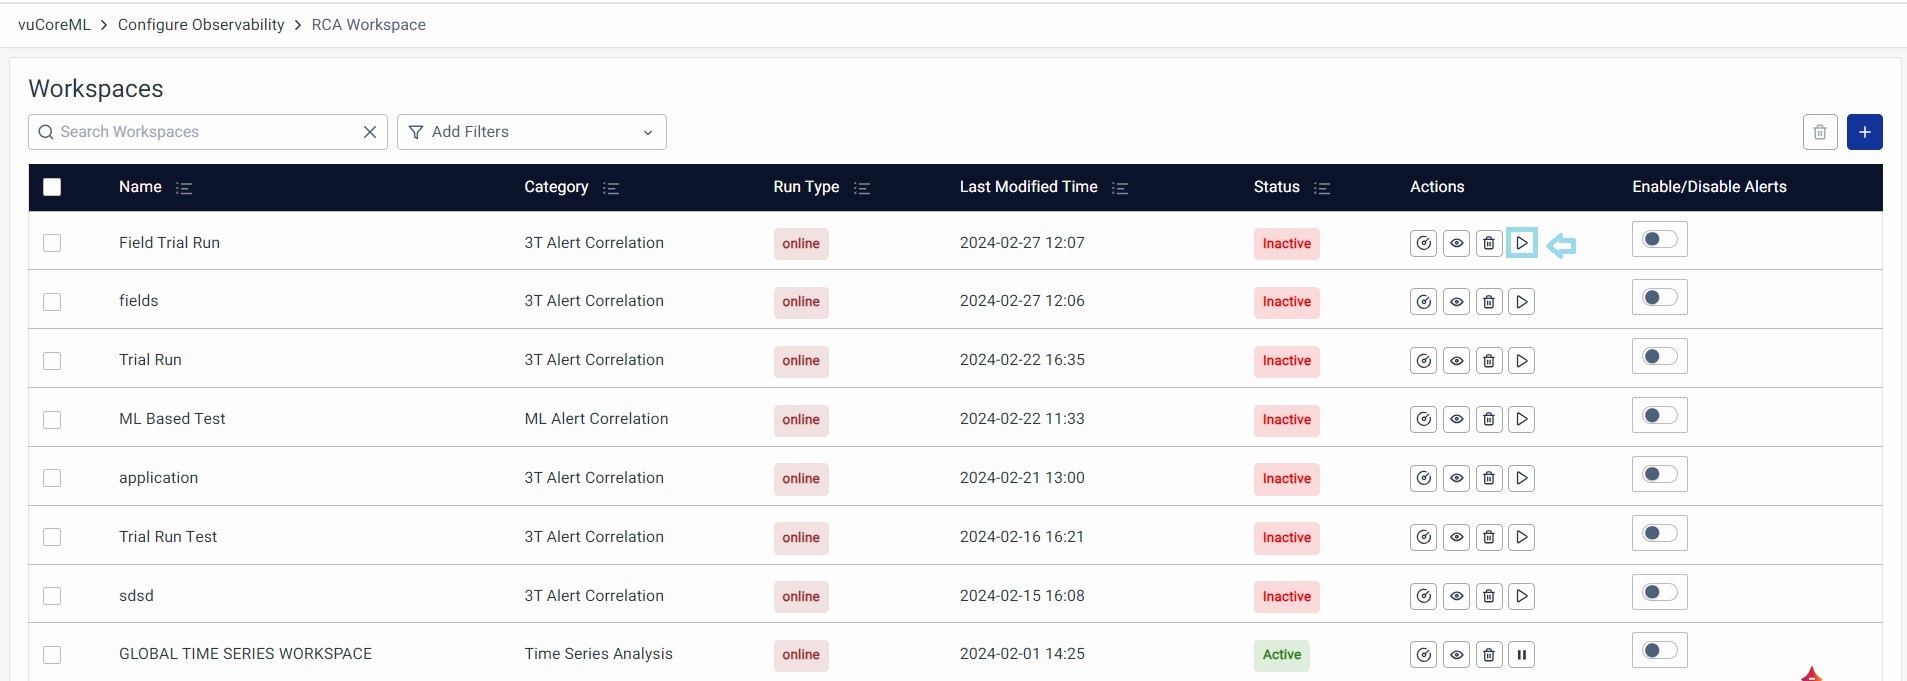
Click on the RCA Workspace on the left Toggle Menu.
- Name: Identifies the name of the workspace, typically clickable for configuration viewing.
- Category: Indicates the selected category among RCA, Time Series Analysis, 3T Correlation, or ML Correlation.
- Run Type: Specifies whether the workspace processes online or offline data, displaying either 'Online' or 'Offline'.
- Last Modified time: Displays the timestamp of the last modification made to the workspace.
- Status: Indicates whether the workspace is active or inactive.
- Actions: Provides options to View Incidents, Edit Workspace, Delete Workspace, and Activate or Deactivate the Workspace.
- Click View Incidents to navigate to the RCA Incidents page for detailed insights.
- Select Edit Workspace to make necessary adjustments.
- Use Delete Workspace to remove the workspace.
- Toggle Activate or Deactivate to enable or disable the workspace
- Enable/Disable Alerts: Toggle to enable or disable alert notifications for the respective workspace.
Create Workspace: The workspaces page shows a list of previously configured Workspaces. Click on the + icon to create a new Workspace.
You can now configure the workspace; the workspace comprises 3 major sections
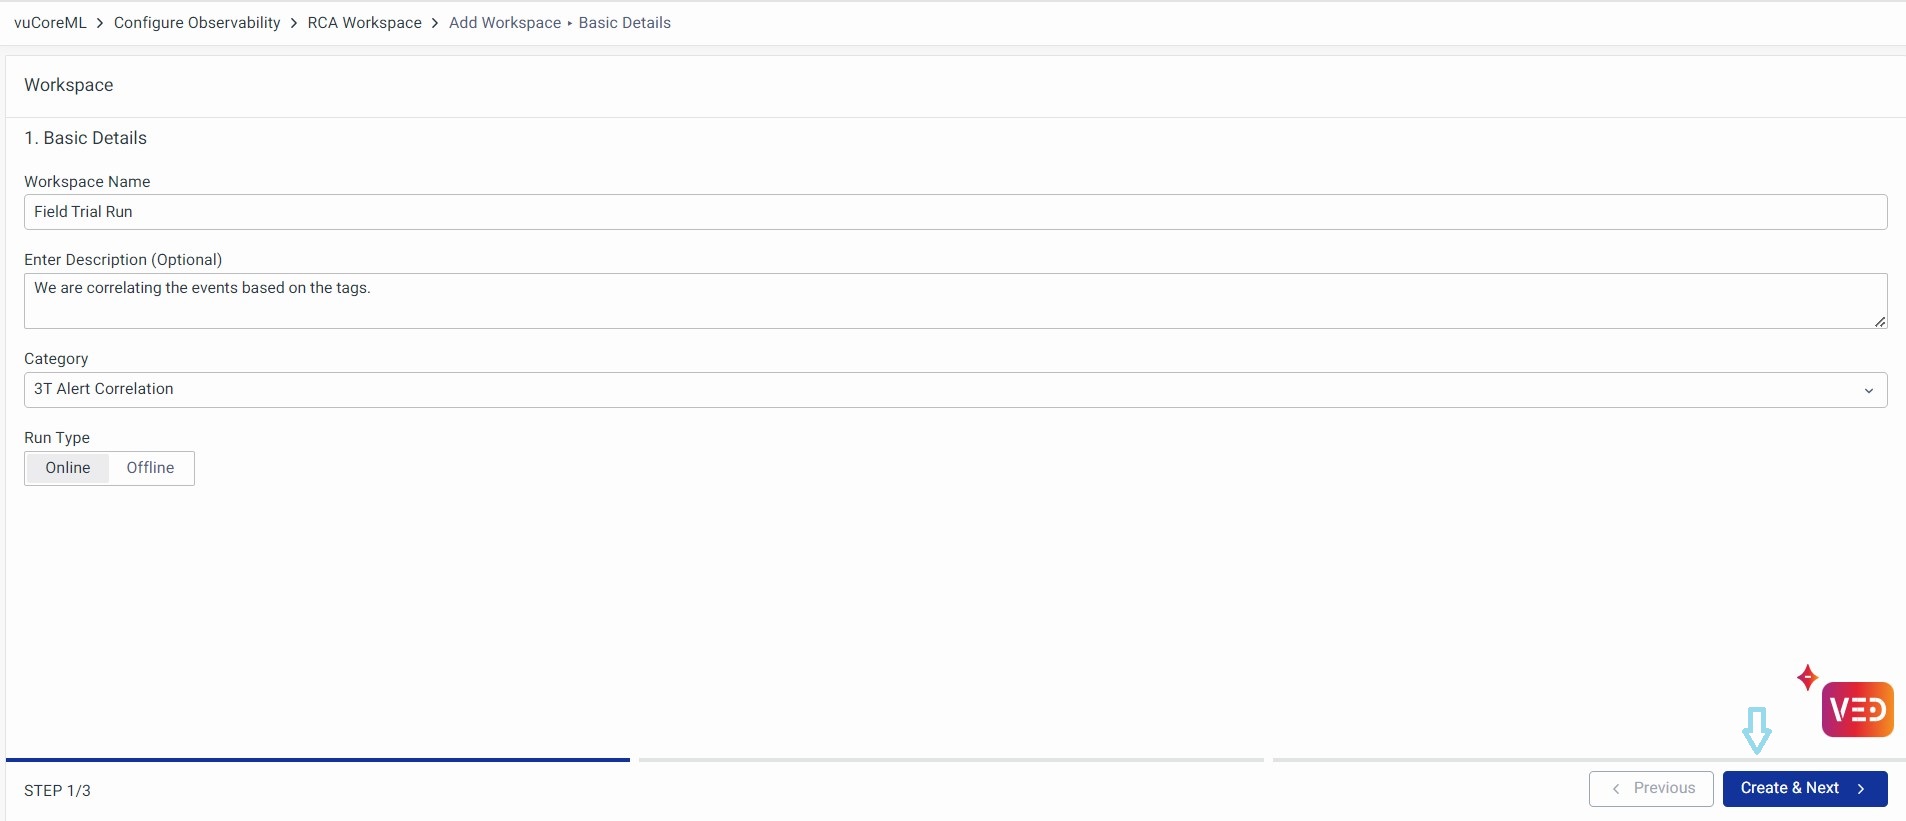
Basic Details
Enter the Workspace Name, Description, select the Category as 3T Alert Correlation, and choose the Run Type as Online or Offline.

Click on Create and Next at the bottom right to create the Workspace.
Setup Event Sources
Once Workspace is created, you will be directed to the Event Sources page, where you can add events by selecting the Event Data Model.
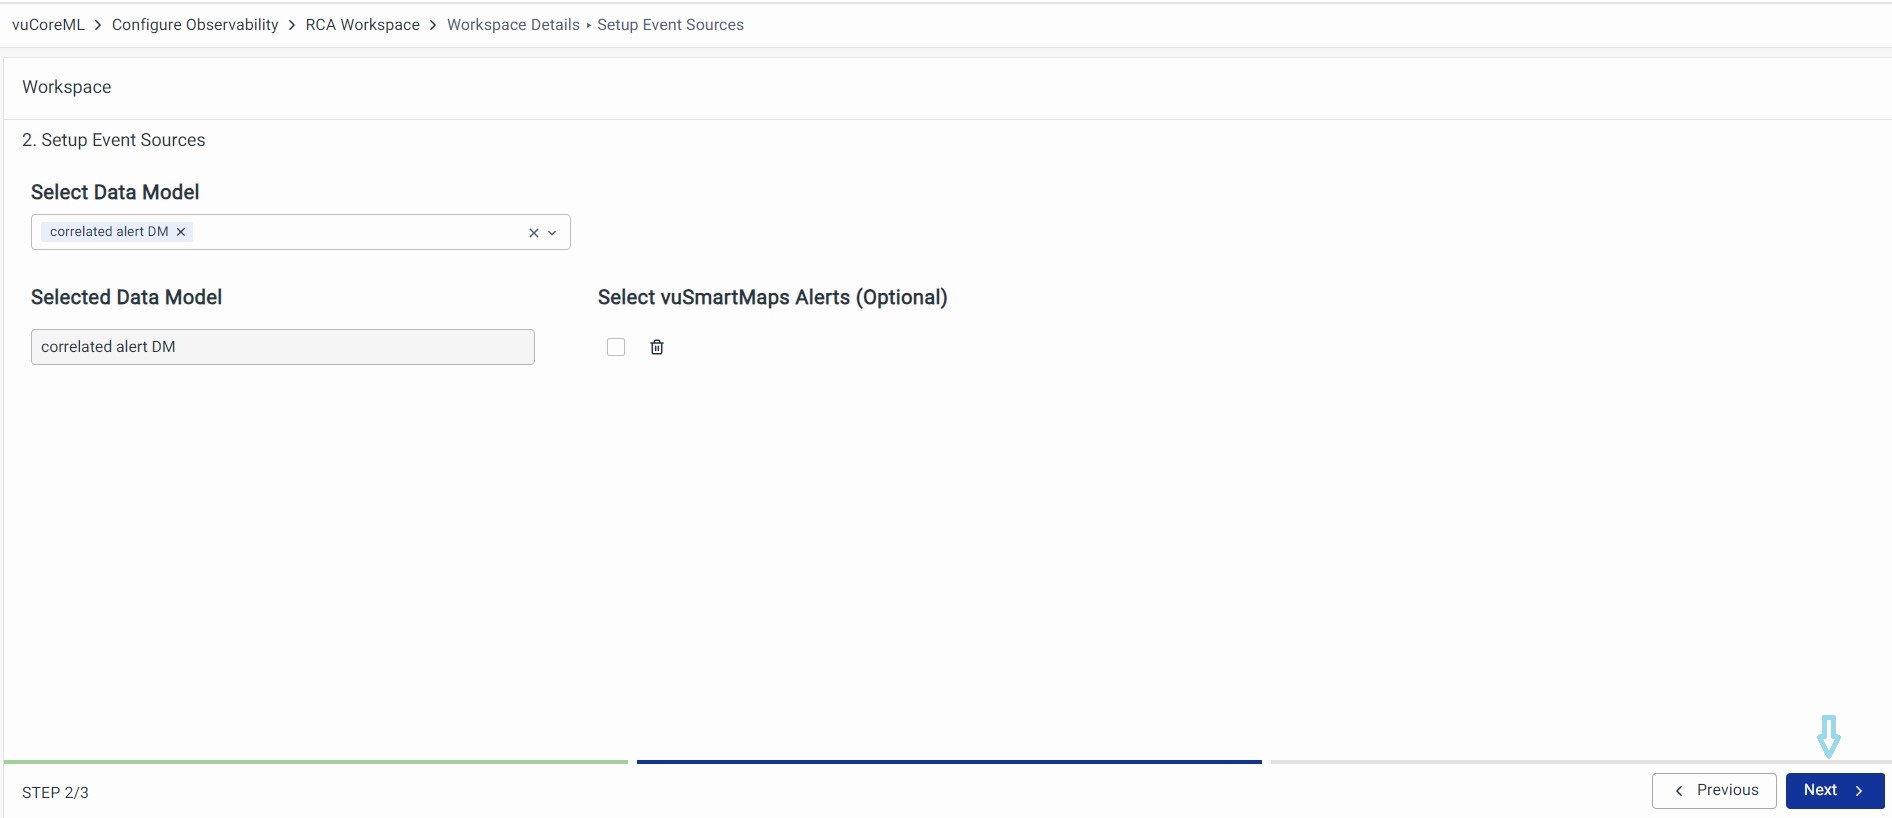
- Select Event Data Model: Choose a Data Model from the drop-down.
- Select vuSmartMaps Alerts (Optional): Check this box to consider the Alerts.
- Delete: Click on the Delete button to delete an Event Data Model
Click on Next to move to the final step.
Setup Correlation Profiles
Choose a category on which you want to correlate the events. The ‘Journey Based’ and ‘Fields Based’ Correlation profiles are fully functional now.
1. Network Topology Based: Alerts for device or service availability are suppressed if the system identifies that the alert is because of an intermediate router, switch, or link failure. This will be functional in the upcoming releases.
2. Journey Based: Alerts that are part of a particular business journey are combined in this case. Identifying whether an alert is part of a business journey will be done by looking for various matches including journey name, IP addresses, app name, etc.
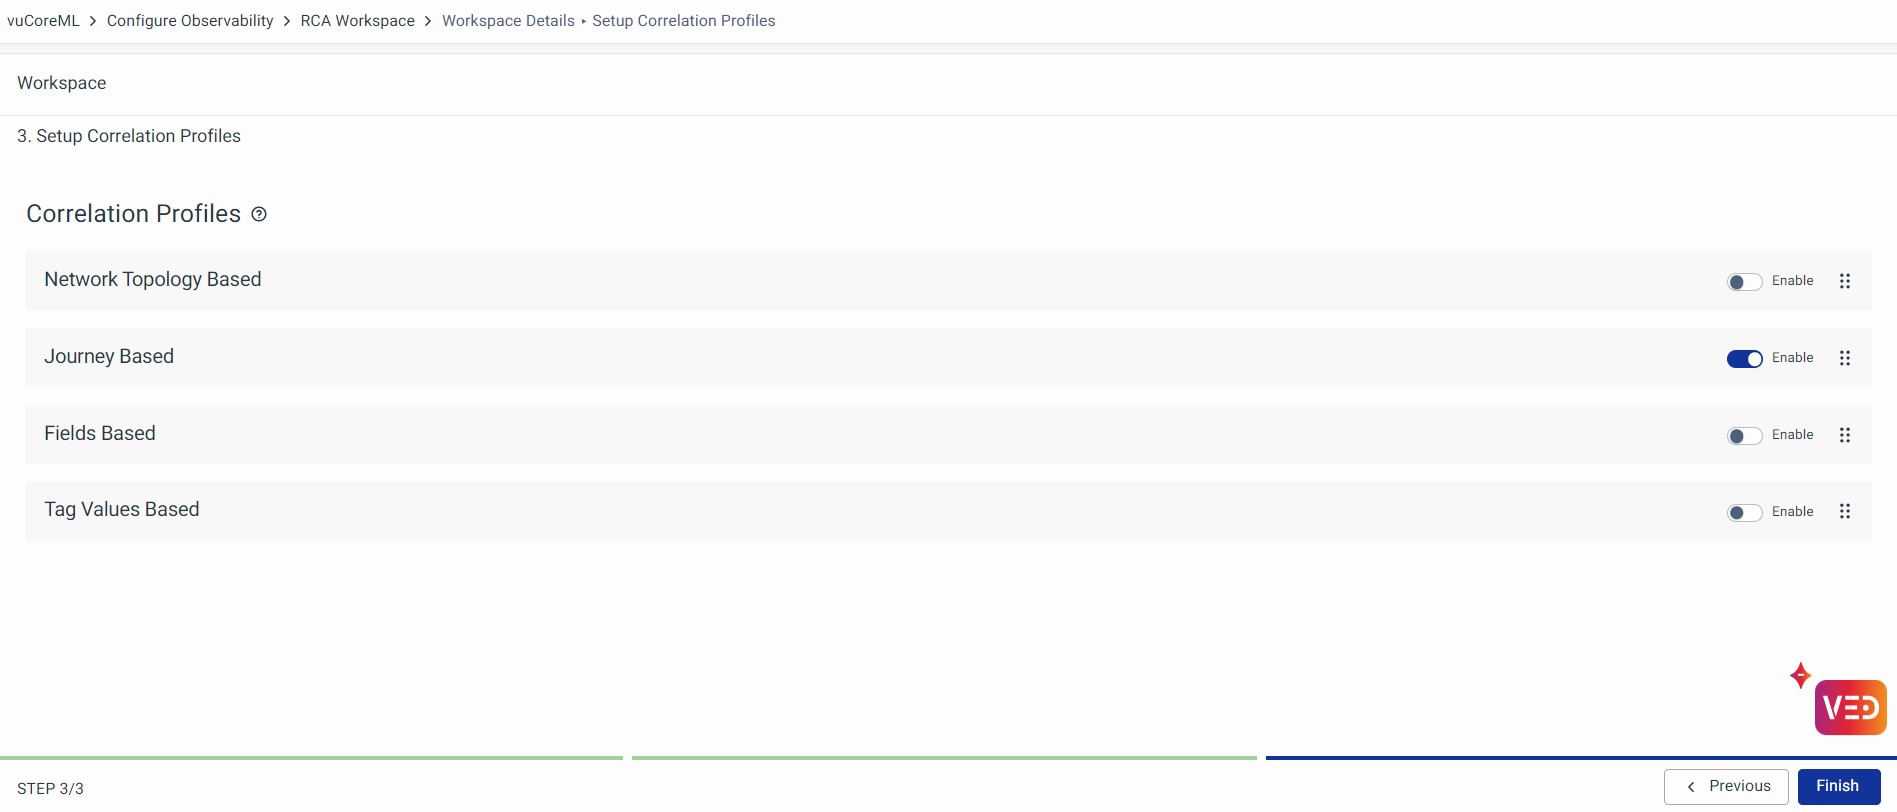
3. Fields Based: Users can specify the list of fields based on which context mapping will be done. For example, all alerts with a value for ‘summary’, and ‘severity’ will be combined.
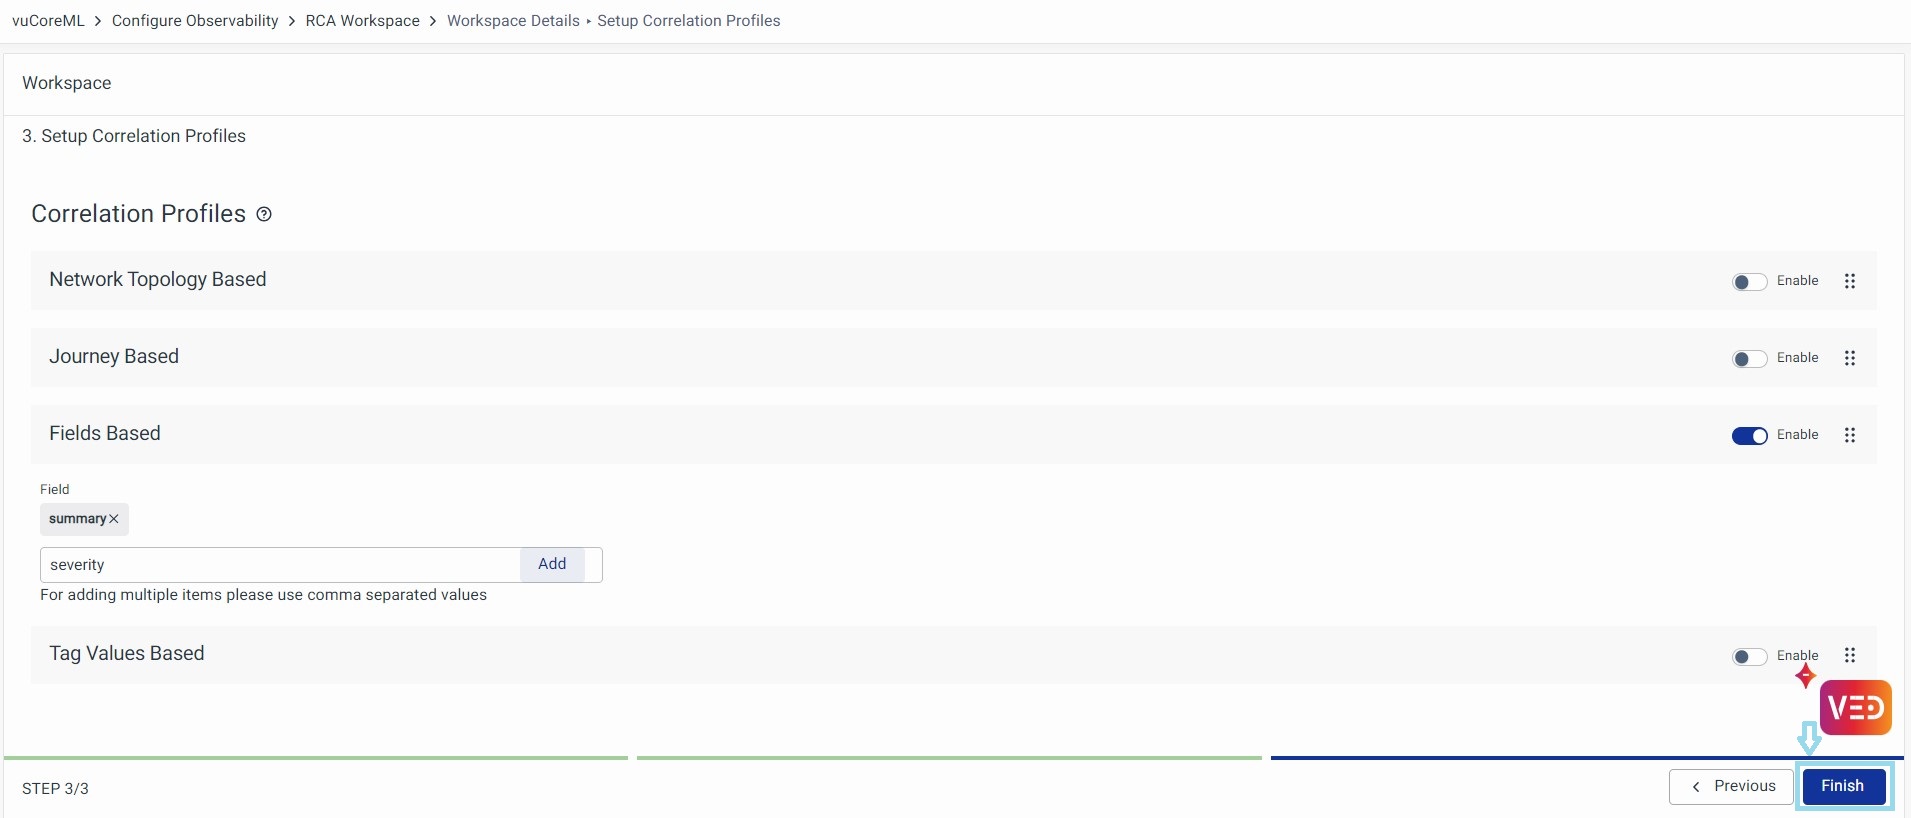
4. Tag Values Based: Similar to fields. Here, all alerts with a certain value in the tag are combined. This will be functional in the upcoming releases.
Finish
Click on Finish to complete the setup. And, you will arrive back at the listing page. Click on the Activate Workspace button from the Actions column.
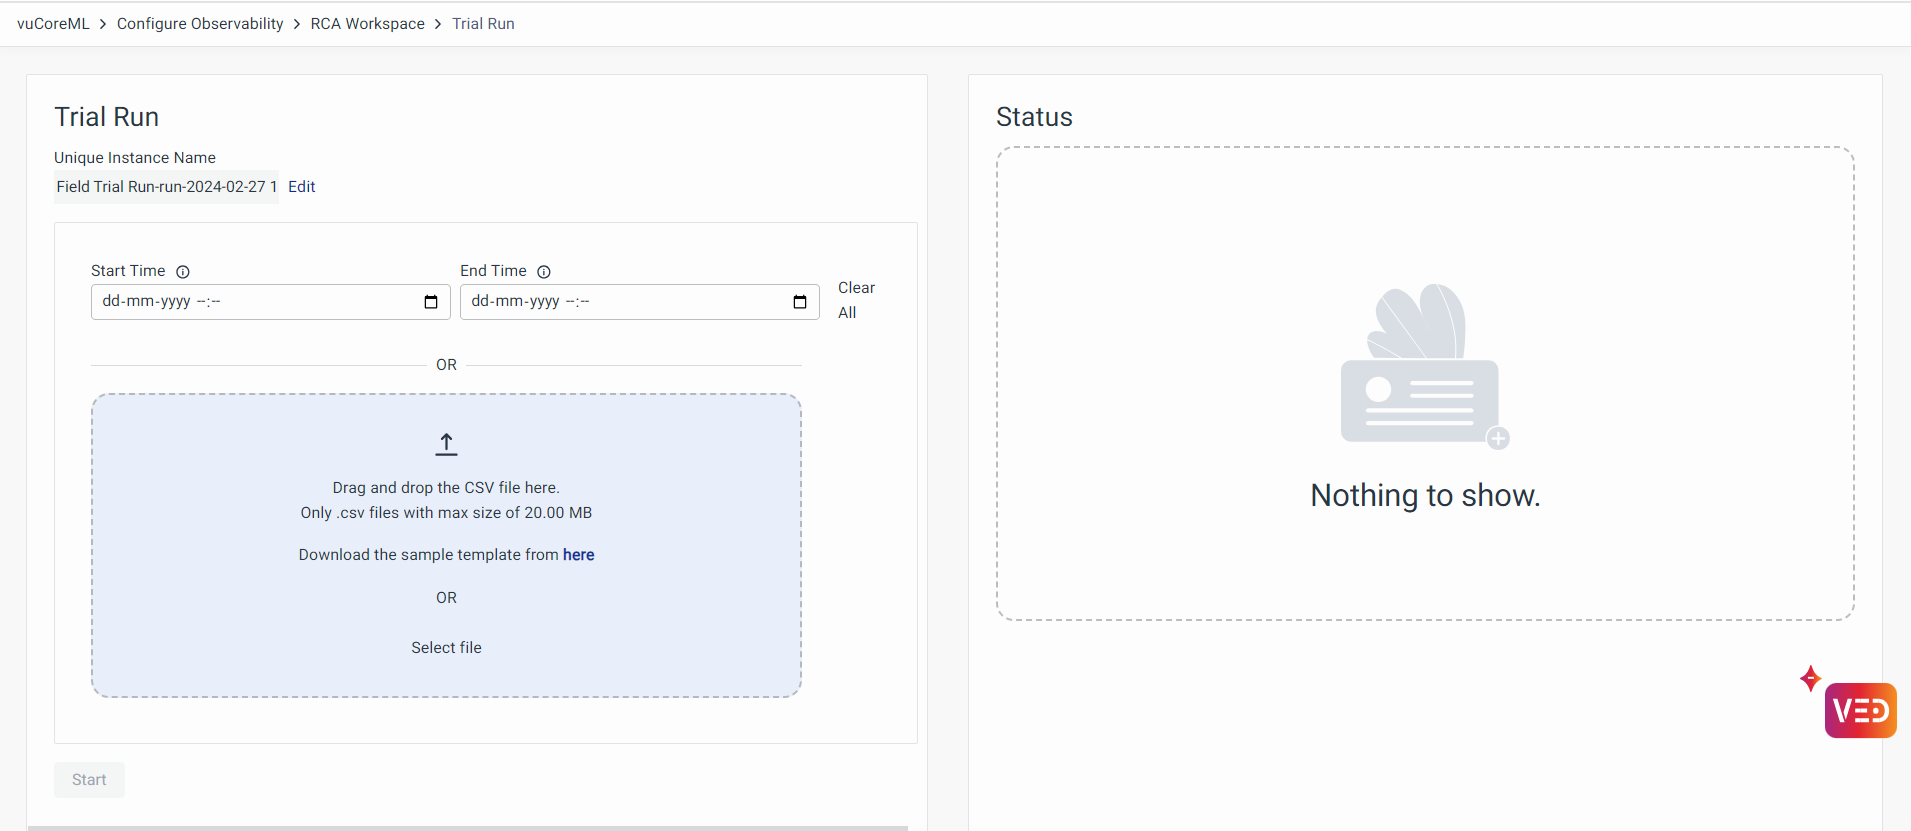
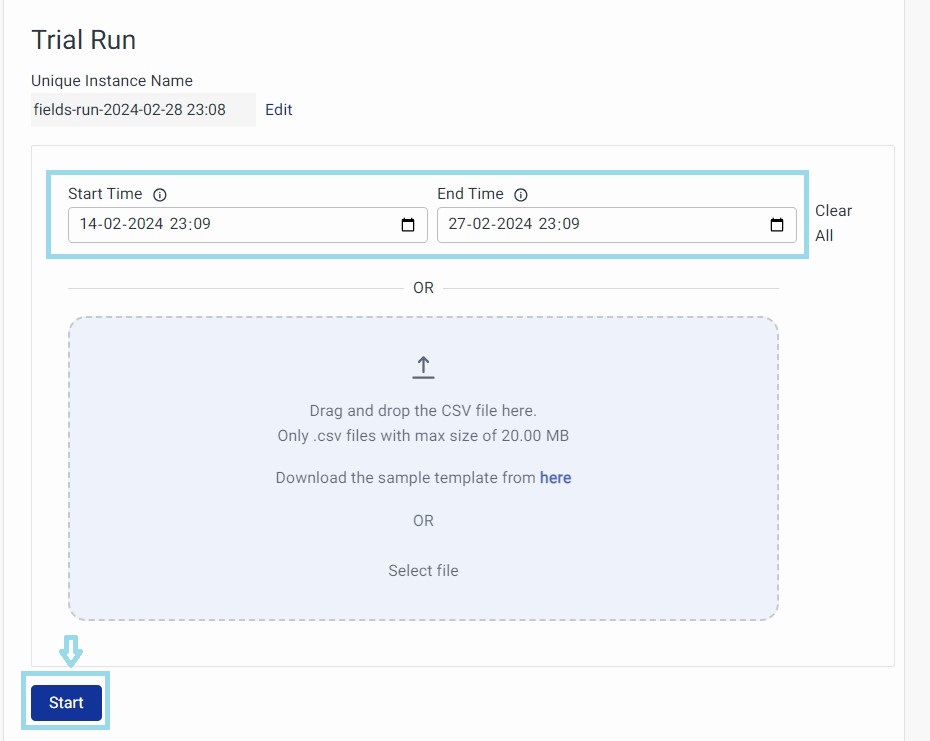
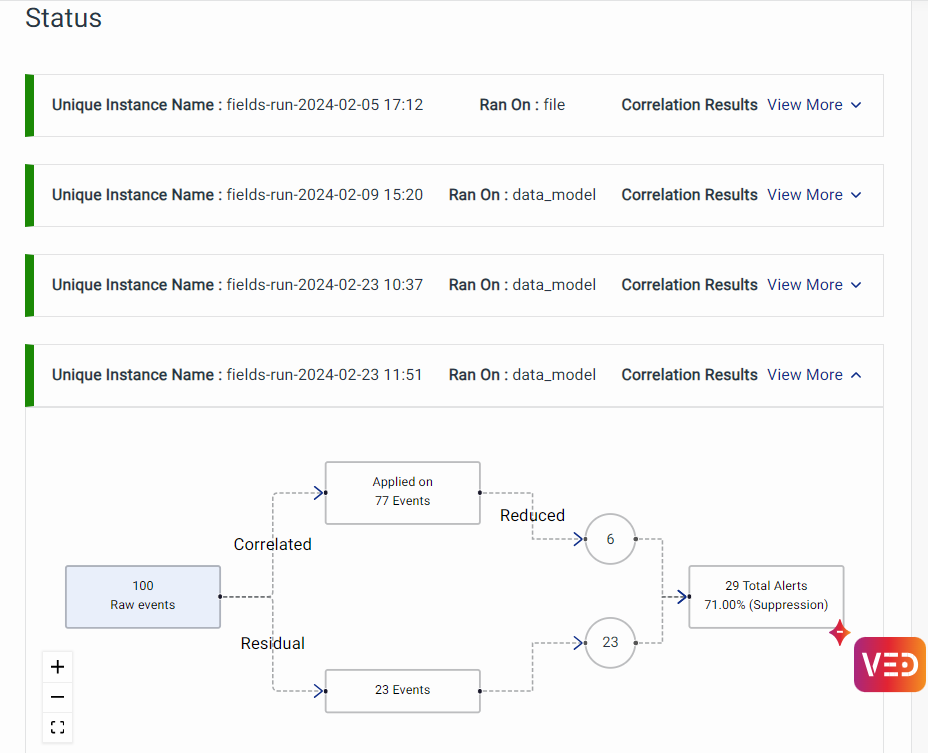
Choose the ‘Start Time’ and ‘End Time’ within which events will be considered for correlation. Click on the Start button to begin the correlation.
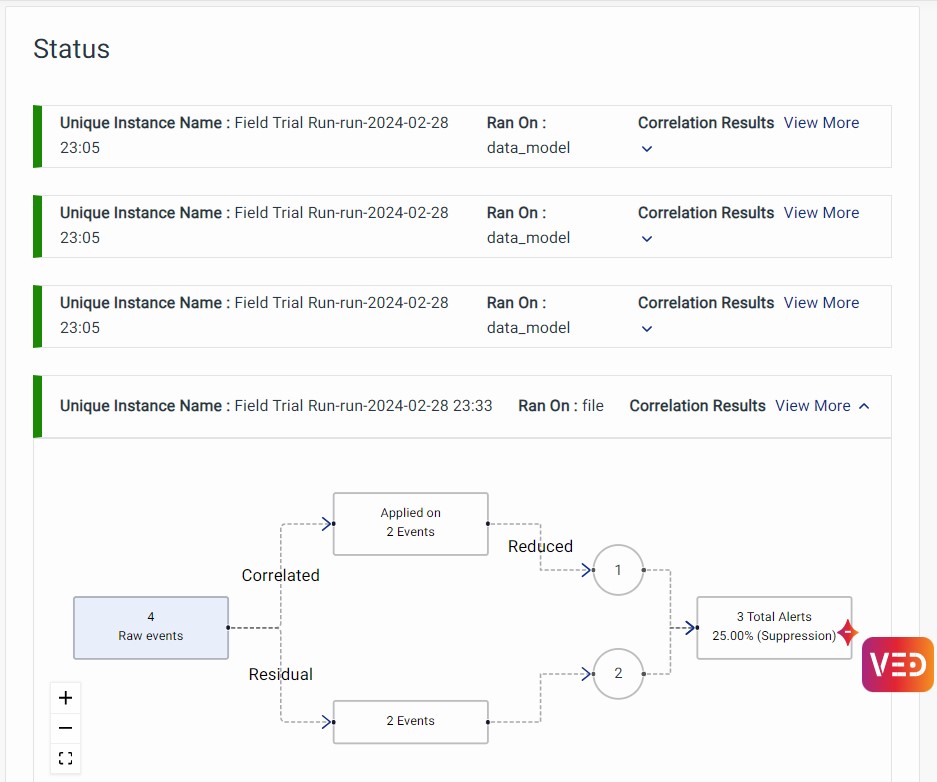
You will find the correlated alerts below. Here out of 100 raw events, 77 events were correlated and brought down to just 6 events. You can notice an amazing 71% suppression.
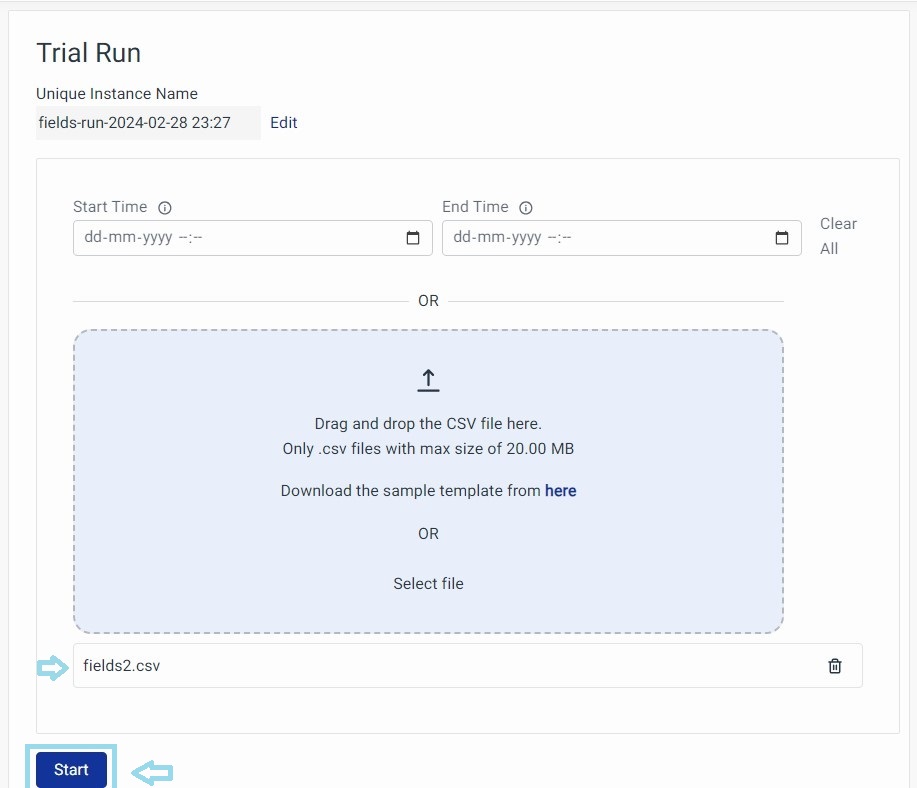
Alternatively, you can upload a CSV file to correlate the events and click on the Start button.
You will find the correlated alerts that appear below. Here out of 4 raw events, 2 events were correlated and brought down to 1 event. You can notice an amazing 25% suppression.