RCA
vuRCABot uses gathered data to detect system incidents promptly. It analyzes various data points and patterns to identify potential outages and disruptions. When an incident is detected, vuRCABot digs deeper into the data to offer insights into the likely root cause. This involves correlating data from multiple sources, assessing historical trends, and applying advanced algorithms.
vuSmartMaps Insights can be accessed from the left navigation menu (Configure Observability > RCA Workspace).
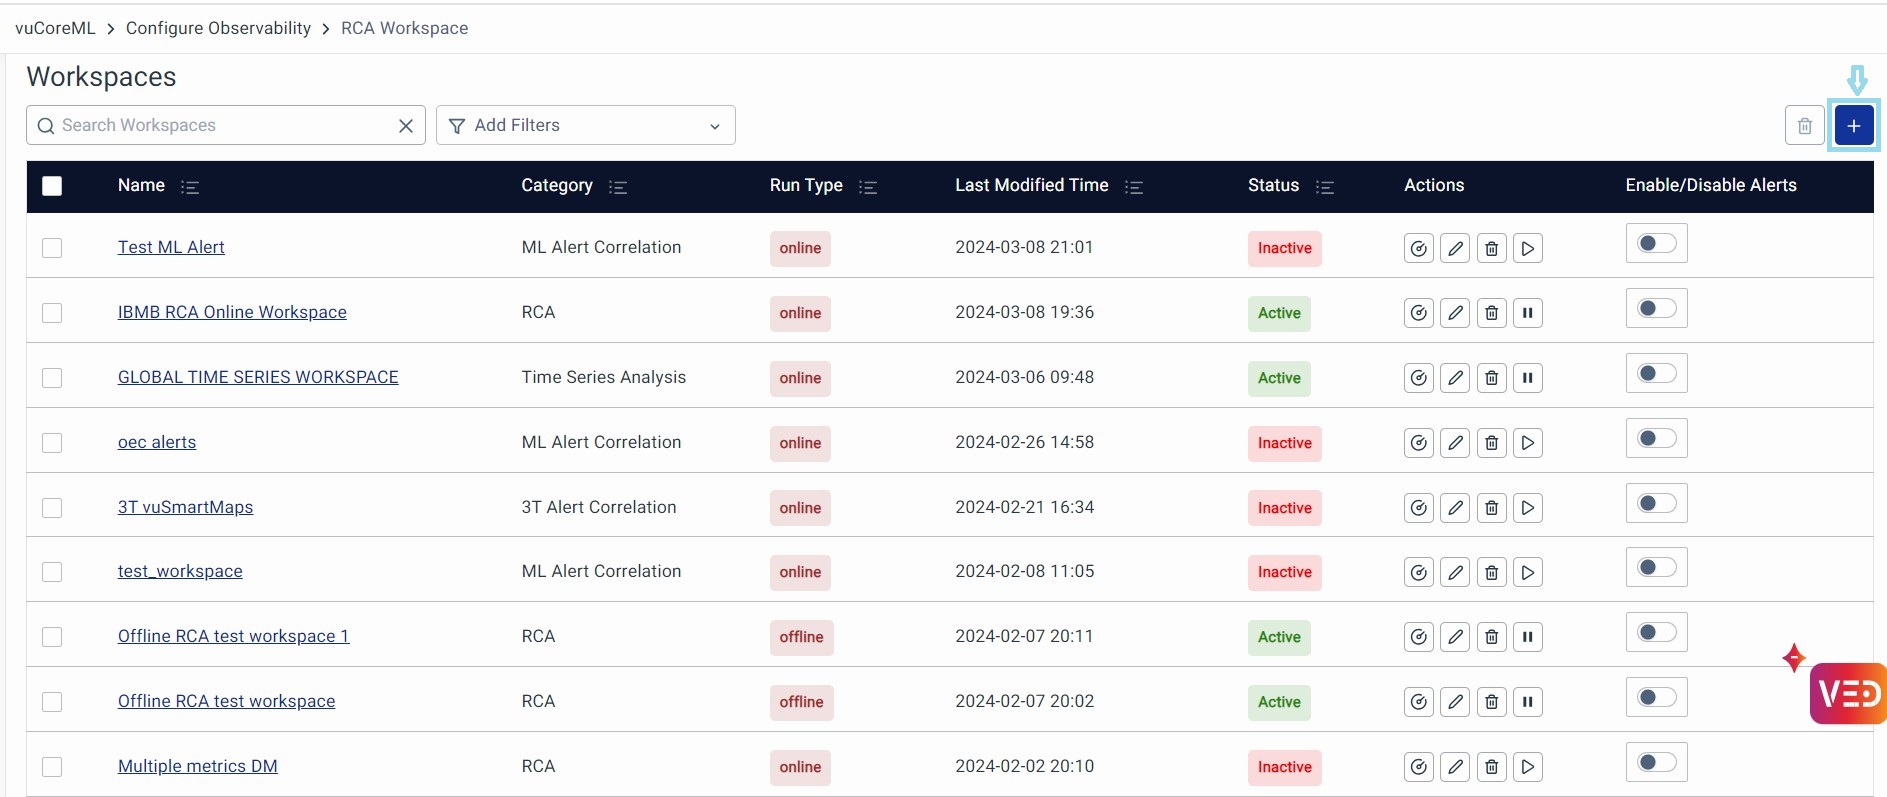
- Name: Indicates the name of the workspace, typically clickable for configuration viewing.
- Category: Indicates the selected category among RCA, Time Series Analysis, 3T Correlation, or ML Correlation.
- Run Type: Specifies whether the workspace processes online or offline data, displaying either 'Online' or 'Offline'.
- Last Modified time: Displays the timestamp of the last modification made to the workspace.
- Status: Indicates whether the workspace is active or inactive.
- Actions: Provides options to View Incidents, Edit Workspace, Delete Workspace, and Activate or Deactivate the Workspace.
- Click View Incidents to navigate to the RCA Incidents page for detailed insights.
- Select Edit Workspace to make necessary adjustments.
- Use Delete Workspace to remove the workspace.
- Toggle Activate or Deactivate to enable or disable the workspace
- Enable/Disable Alerts: Toggle to enable or disable alert notifications for the respective workspace.
Create Workspace: The workspaces page shows a list of previously configured Workspaces. Click on the + icon to create a new Workspace.
You can now configure the workspace; the workspace comprises 5 major sections
- Basic Details
- Schema
- Signalizers
- Bot Settings
- Storyboard
Basic Details
Enter the Workspace Name, Description, and choose the Category as RCA, and choose the Run Type as Online or Offline based on the requirement.
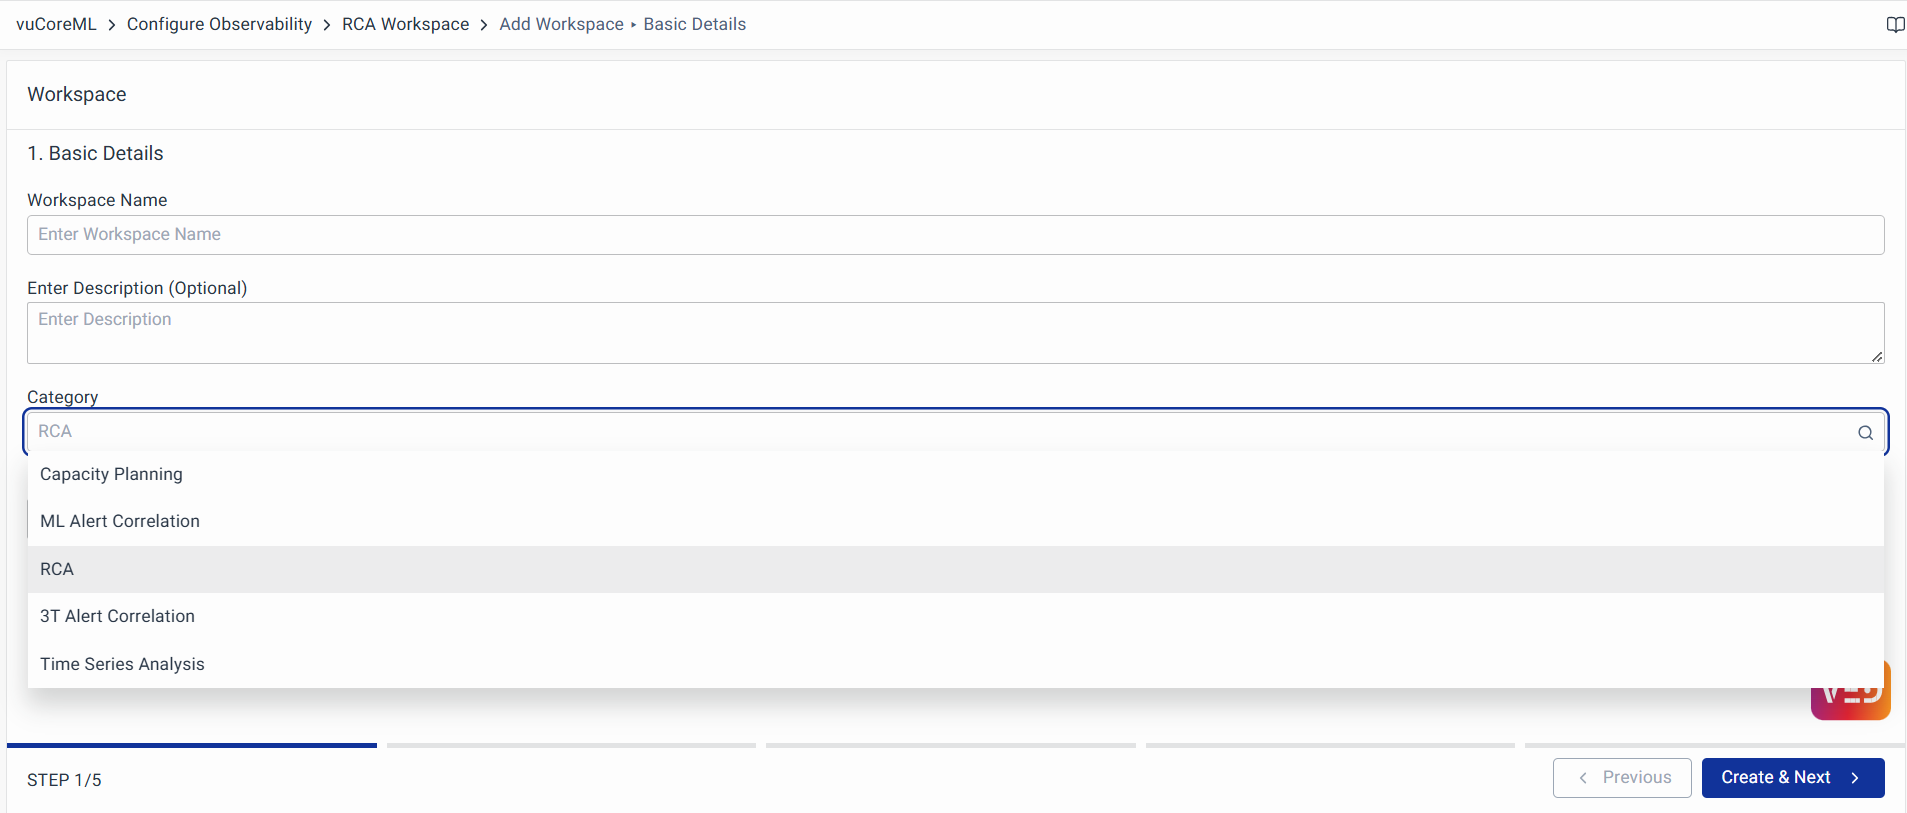
Choose Run Type as Online for live data and Offline for third-party systems or data in CSV files. For the Offline data use the data imported using Import Data.
Click on Create to create your Workspace.
Schema
Once Workspace is created, you will be directed to the Schema page, where you can configure the schema which comprises the Journey, Components, and Graphs section. The schema is the place where you’ll have to define the business journey and its metrics.
Metrics can be categorized into three types,
- Lead Indicators (Business impacting metrics)
- Operational Indicators (Application/Infra/Underlying metrics)
- External Indicators (External metrics like holiday or maintenance window)
You must categorize the metrics accurately because the incidents will be detected primarily based on the lead indicators.
Journey
The journey will be the super-set of all metrics and components (i.e. you can think of this as a business journey). You can categorize the metrics at the journey level if they don’t specifically come under any particular component.
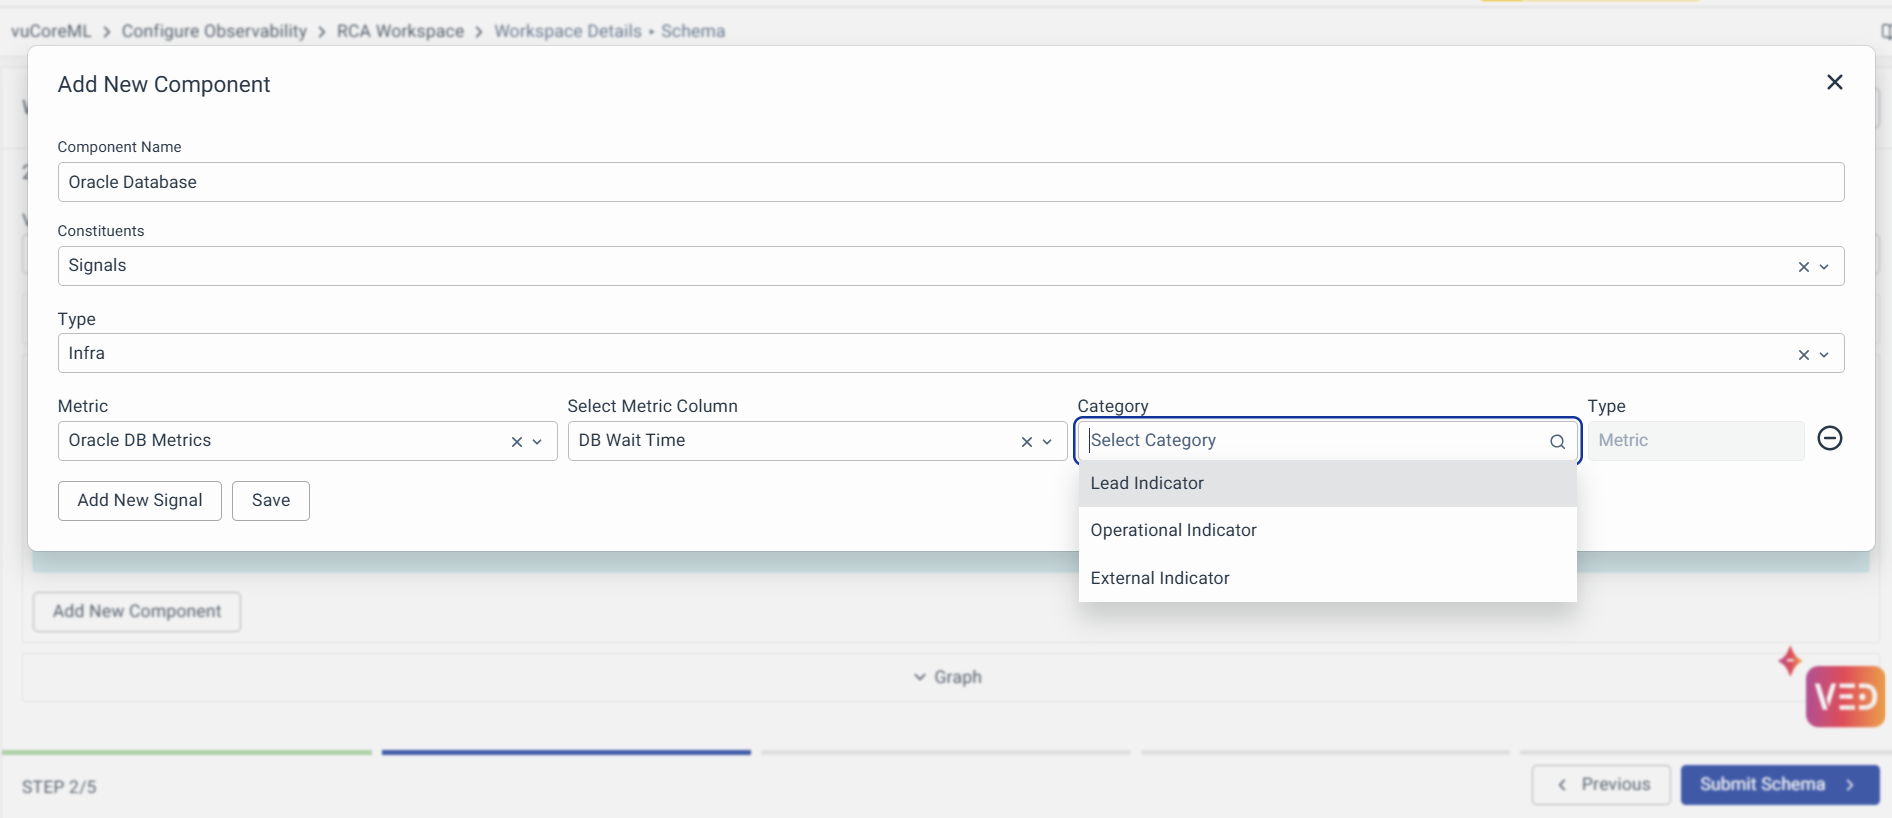
You can now click Journey, and add a new signal
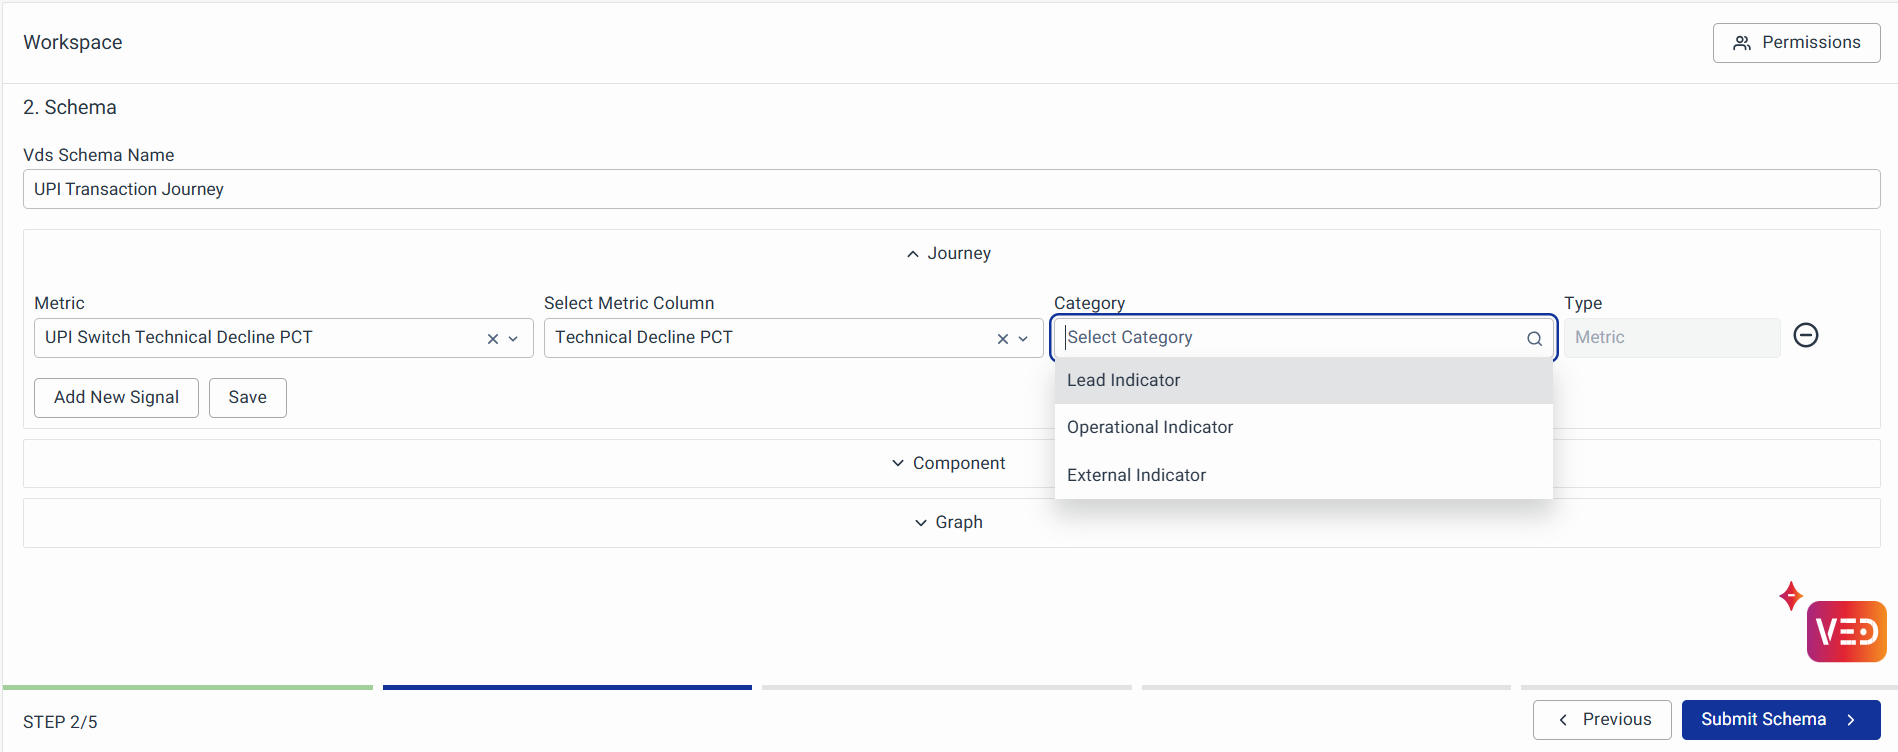
- Signal: Refers to the chosen data model within the system.
- Metric Column: Represents the metric to be chosen from the selected data model
- Category: Denotes the classification as either a Lead or Operational Indicator
- Type: Denotes the type of signal chosen.
For each signal you will be adding, you’ll have to specify the data model and metric column in that model for this signal. Only metric columns in a data model are eligible to be indicators.
You can use the listing option to specify the data model and respective metric column and then categorize that metric using the category listing option. Similarly, you can add other signals.
Components
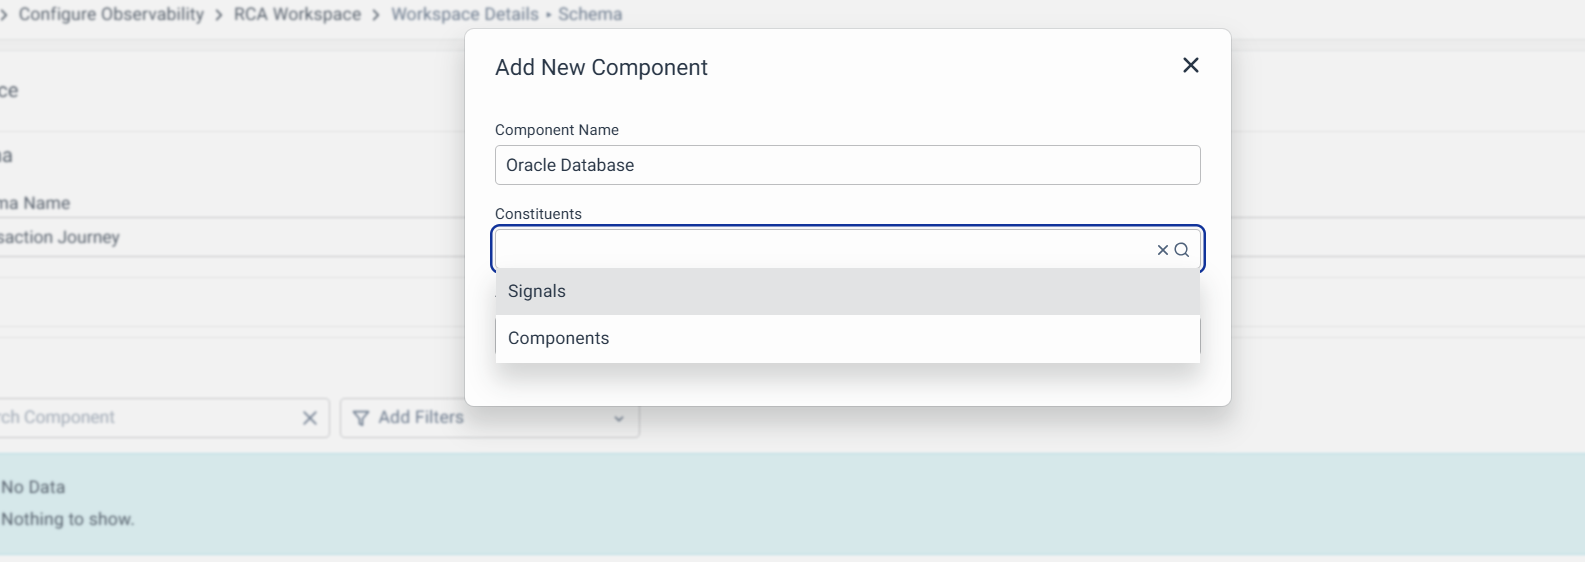
Usually, in a business journey, most of the metrics will be defined at the touchpoints/component level. In such cases, you can use the components section to categorize the metrics. You can now add a new component
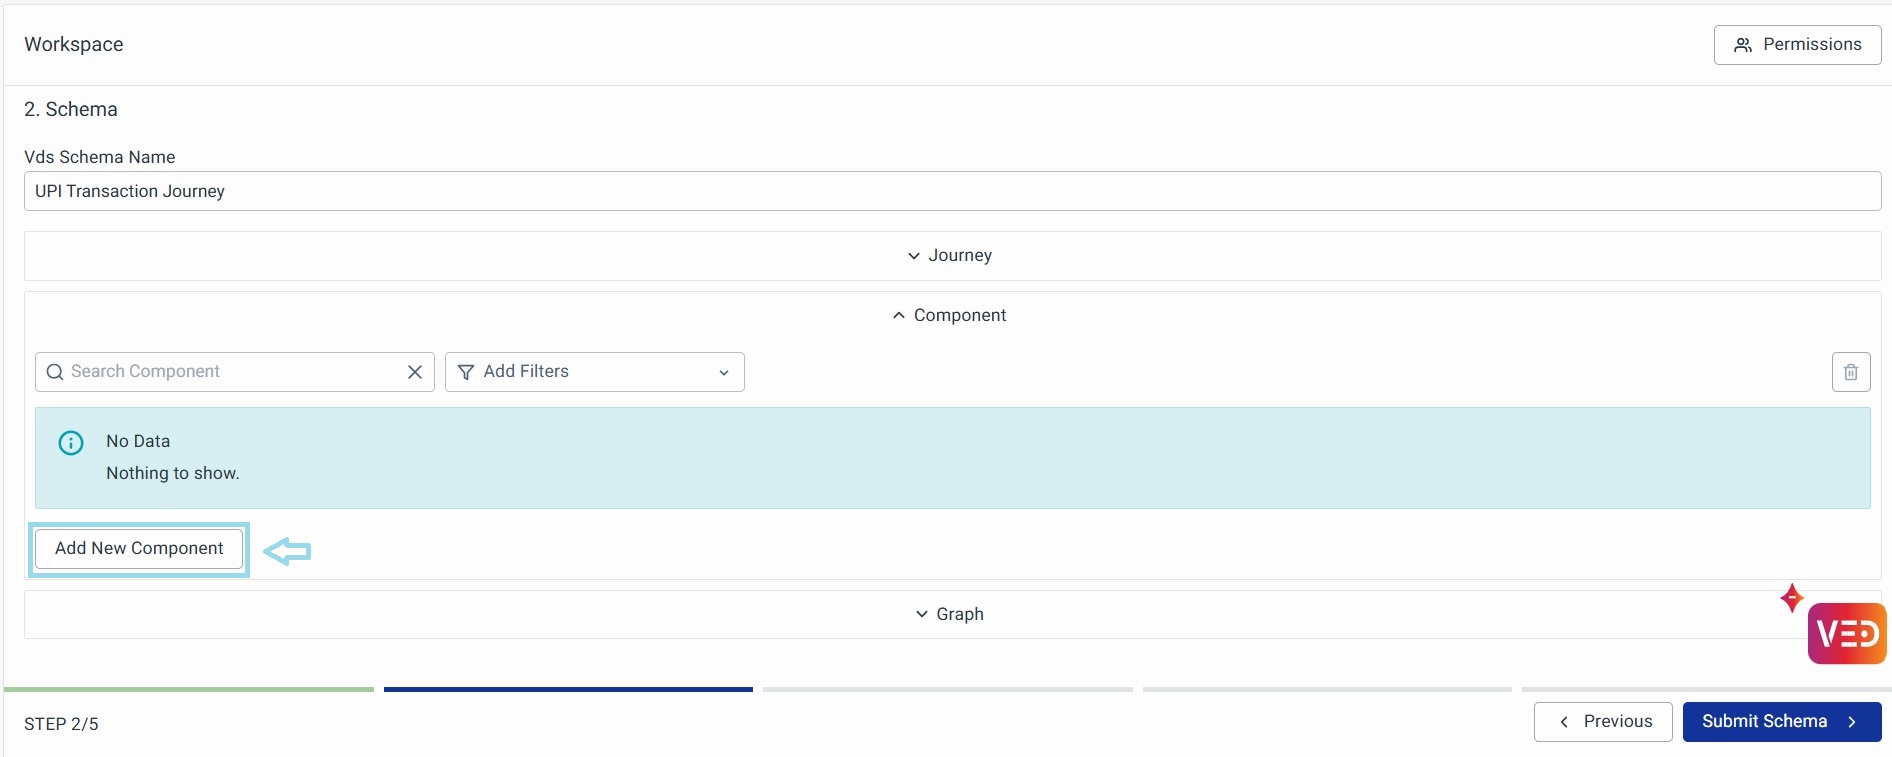
Then you can specify the component name. A Component can have two constituents.
- Signals as a Constituent: Signals/Metrics will be present inside this component
- Components as a Constituent: Only components will be present inside this. Note that only those components that are already created before this section can be added here.
1. Signals as a Constituent
In the case of signals as constituents, you can now add a signal and follow the same procedure as you did for Journey signals to Categorize them
A particular signal (i.e., a unique metric for a data model) can be defined only once in the whole schema. It can either be defined as the journey or inside a component.
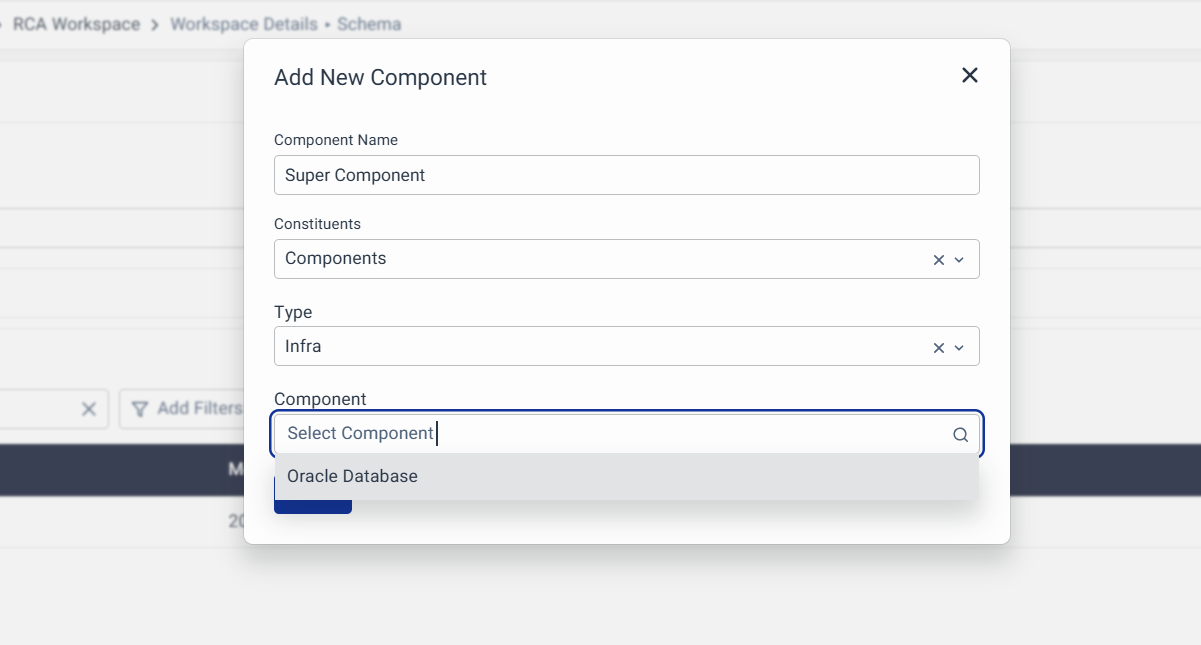
2. Components as Constituent
For Components as constituents, you can add a new component and select the component as a constituent.
Then in the components listing, all the components that we previously created will be shown, you can select them based on the requirement and save them.
Components as Constituents are useful when you want to create sub-graphs.
For example: Say your graph is:
A ->  C1_big

where,

C1_big = [C11 -> C12 -> C13],

C11 = [M111, M112] (metrics)

C12 = [M121, M122] (metrics)

C13 = [M131, M132] (metrics)
Graphs
The Graphs are another important part of the Workspace Schema. It is used to define the topology of the business journey/system after metrics categorization. Graphs can be specified at two levels,
- A journey-level graph (A graph defining all the components of a business journey)
- A component-level graph (A graph defining all the components inside a specific component. This can be used for components with constituents as components)
For e.g.: Say your graph is:
A -> C1_big

where,

C1_big = [C11 -> C12 -> C13],

C11 = [M111, M112] metrics

C12 = [M121, M122] metrics

C13 = [M131, M132] metrics
Journey-level graph: A -> C1_big
Component-level graph: C1_big = [C11 -> C12 -> C13]
You can click Add New Graph, and select the graph type:
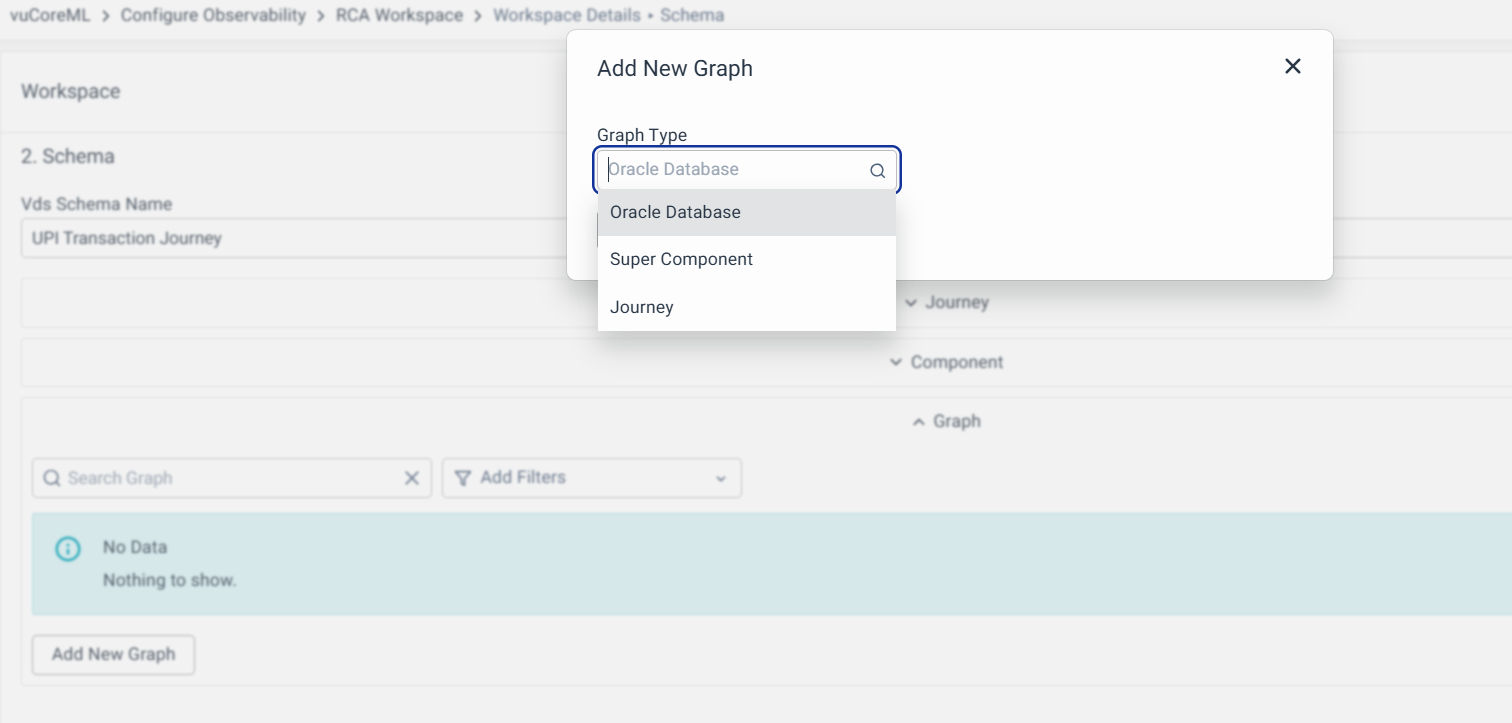
After selecting the graph type, you can create connections. Each connection acts like a link between two touchpoints/components. For each connection, now you’ll have to specify the following
- From - The component where it is coming from
- Here, you're adding an edge representing the direction of data flow between nodes in the graph. The To and From correspond to this data flow: data flows from "From" to "To."
- To - The component where it is going to
- Direction - It could be UniDirectional/BiDirectional
- Example 1: Communication between App server and DB server may be bidirectional because, App Servers fetch data from DB server and may also push data into DB server.
- Example 2: Communication between Web server and App server may be unidirectional in the case where the Web server only displays dashboards. The data for the dashboards will always come from App server (which, in turn, will get it from DB server).
- Strength - The strength talks about how strong the relationship between two components i.e. how much impact would a problem in one component affect the other. The listing contains High/Medium/Low.
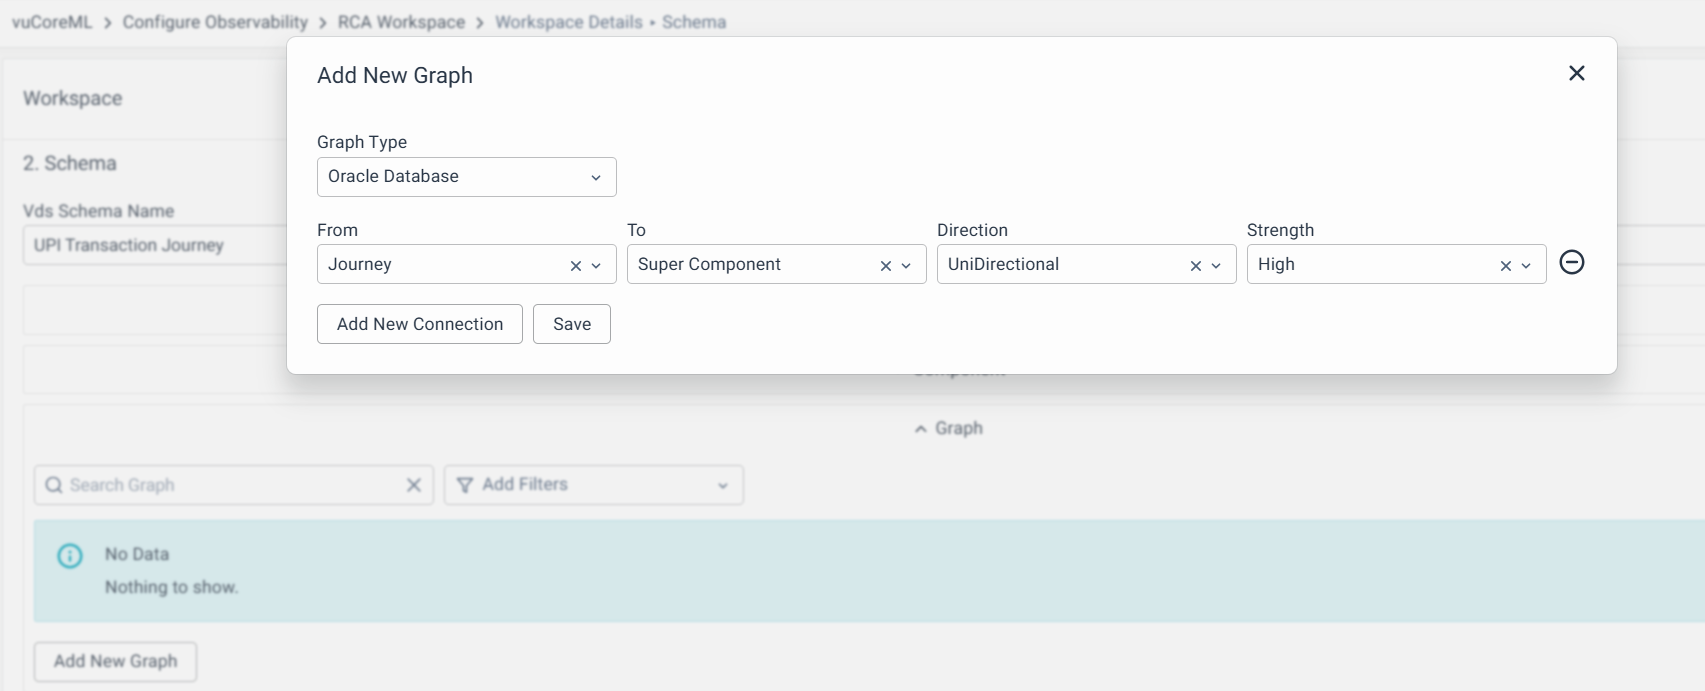
And save the connection for that graph type. Similarly, if you want to create a connection for a particular component, you can follow the same approach.
Signalizers
After successfully submitting the Schema, you will be directed to the Signalizers page. The signalizers page gets automatically populated with the list of metrics configured in the Schema page along with information on ML techniques that will be running for the respective metrics
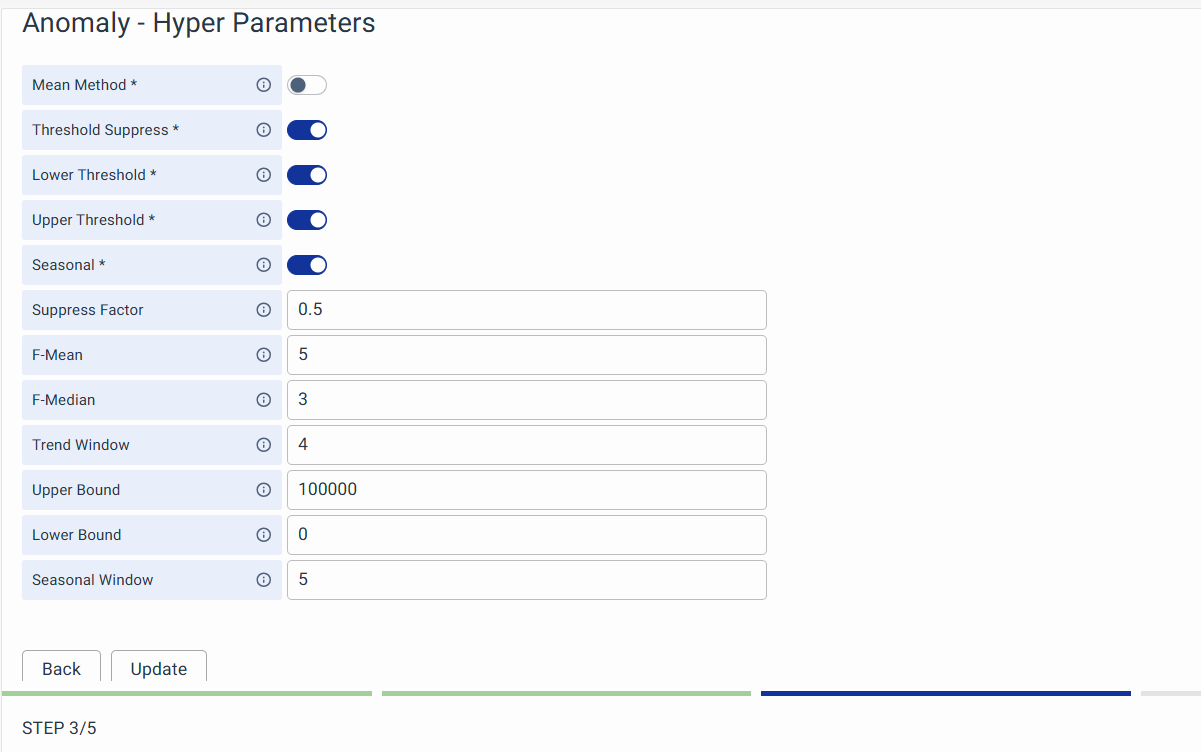
If you want to change the hyper-parameters for a particular metrics ML method, such as Anomaly Detection, CHI, OPI, etc., advanced users or ML Engineers can click the edit button of the metrics ML method.
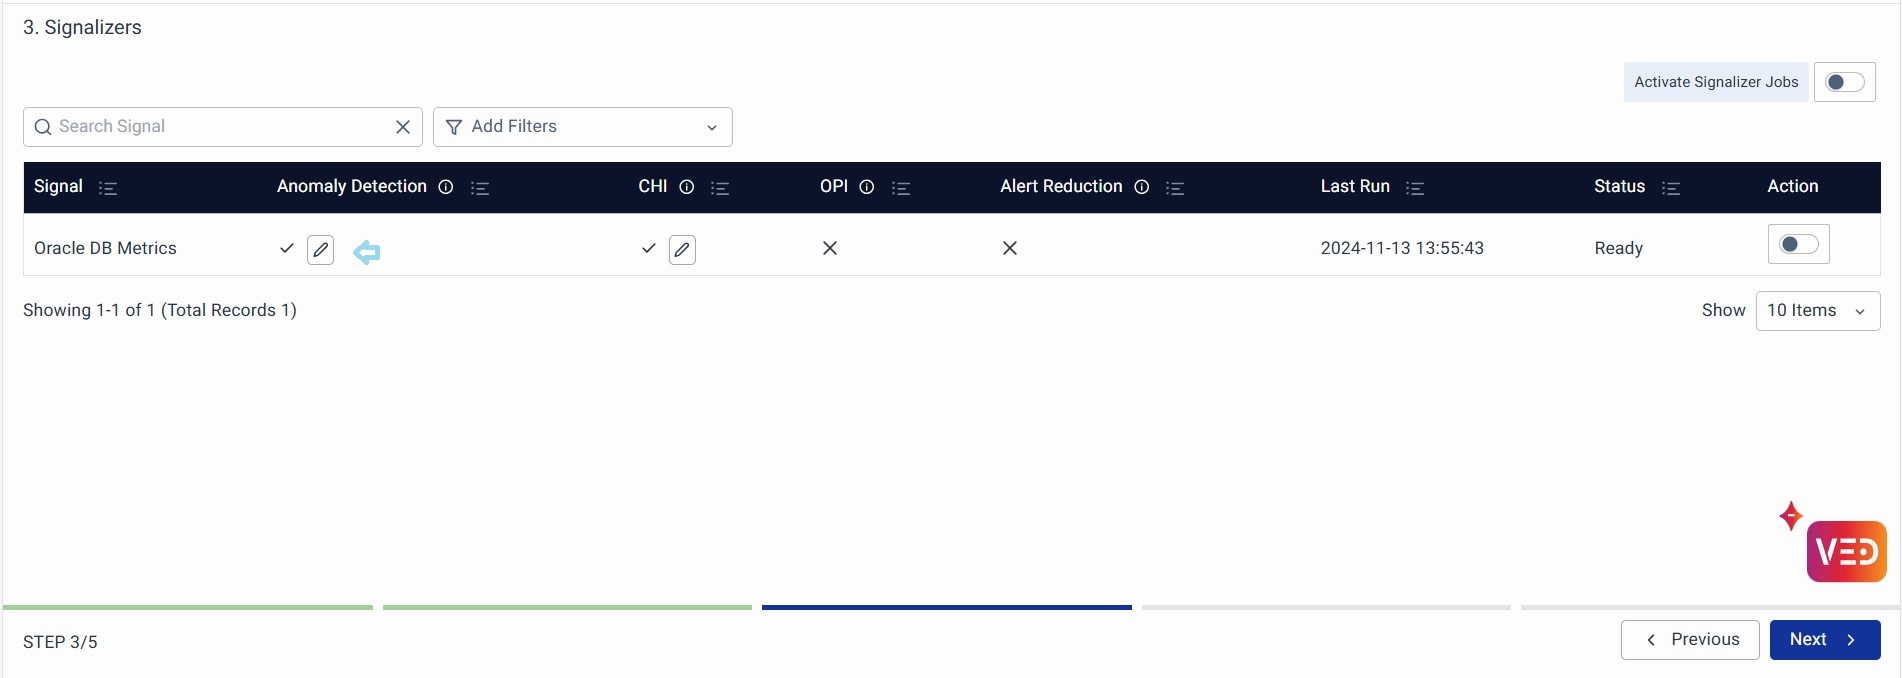
It will direct you to the hyper-parameter editing page. On completion of editing, you can click the Update button to override the default parameters.
Now you can either globally activate the signalizers or activate only specific metric signalizers as per requirement locally (at the action section of each metric listed on this page)
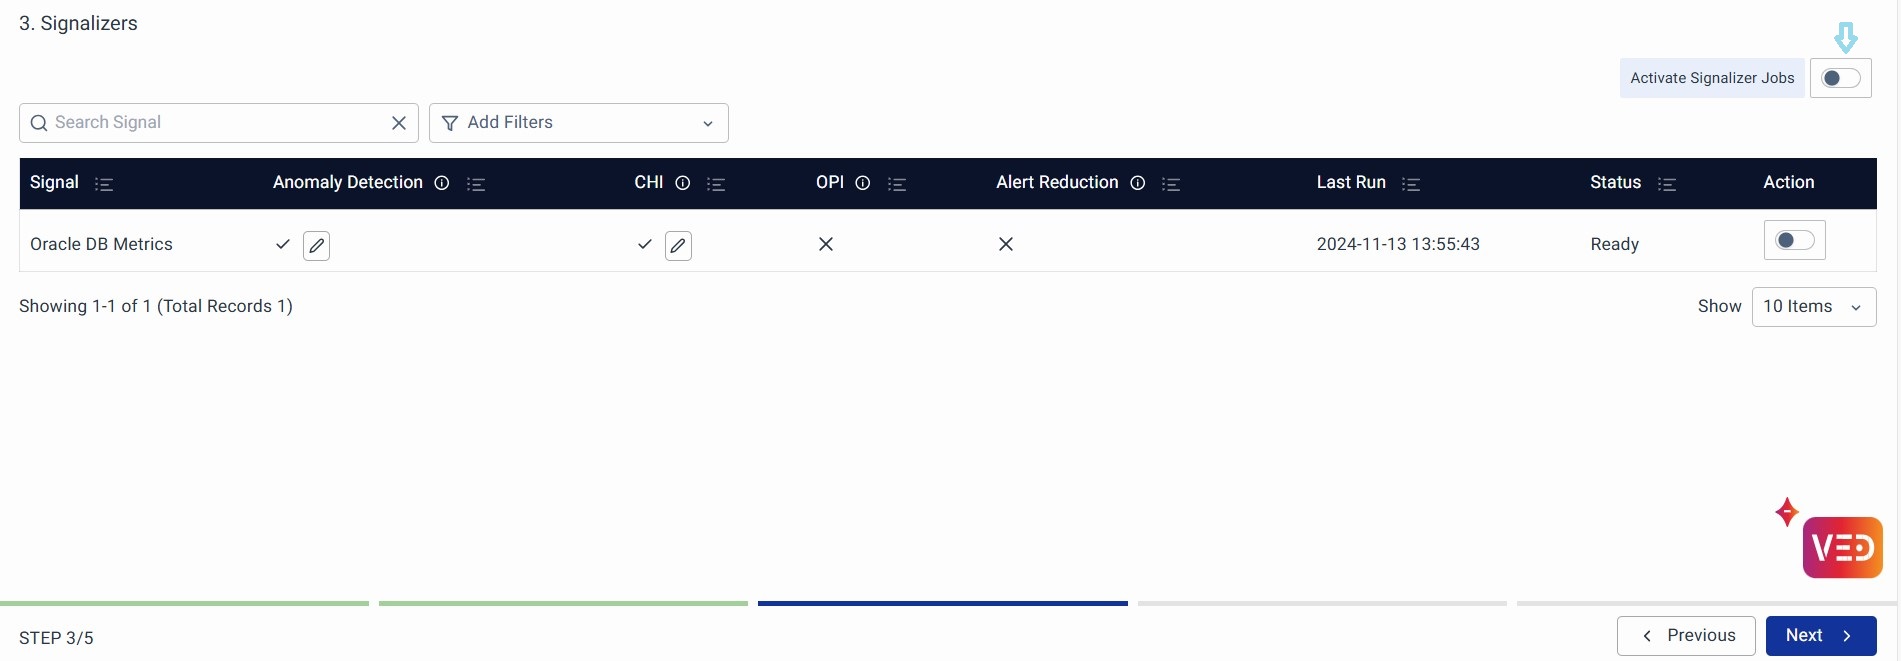
After activation, a pop-up will come up where you can click the Activate button. After clicking, the vuRCABot will start creating the required pipelines. Once the pipelines are created, all the signals configured in the workspace activation buttons will be switched on.
You can click on the Next button at the bottom right to go to the next section, Bot Settings.
Bot Settings
The Bot Settings page allows users to configure key parameters that govern the behavior, analysis, and response capabilities of their automated Root Cause Analysis (RCA) bots. These settings help fine-tune how incidents are identified, correlated, and resolved, enabling efficient and precise incident management.
Key parameters include options for controlling how and when the RCA bot checks for system abnormalities, such as setting schedule frequencies and defining validation intervals. Hierarchical and signal correlation settings allow for deeper insights into incidents by filtering metrics and correlating indicators to identify root causes more effectively. Timeout configurations, like Incident Blacklist Timeout and Incident Clear Timeout, ensure incidents are managed appropriately over time, either by suppressing noise or marking them as resolved based on inactivity.
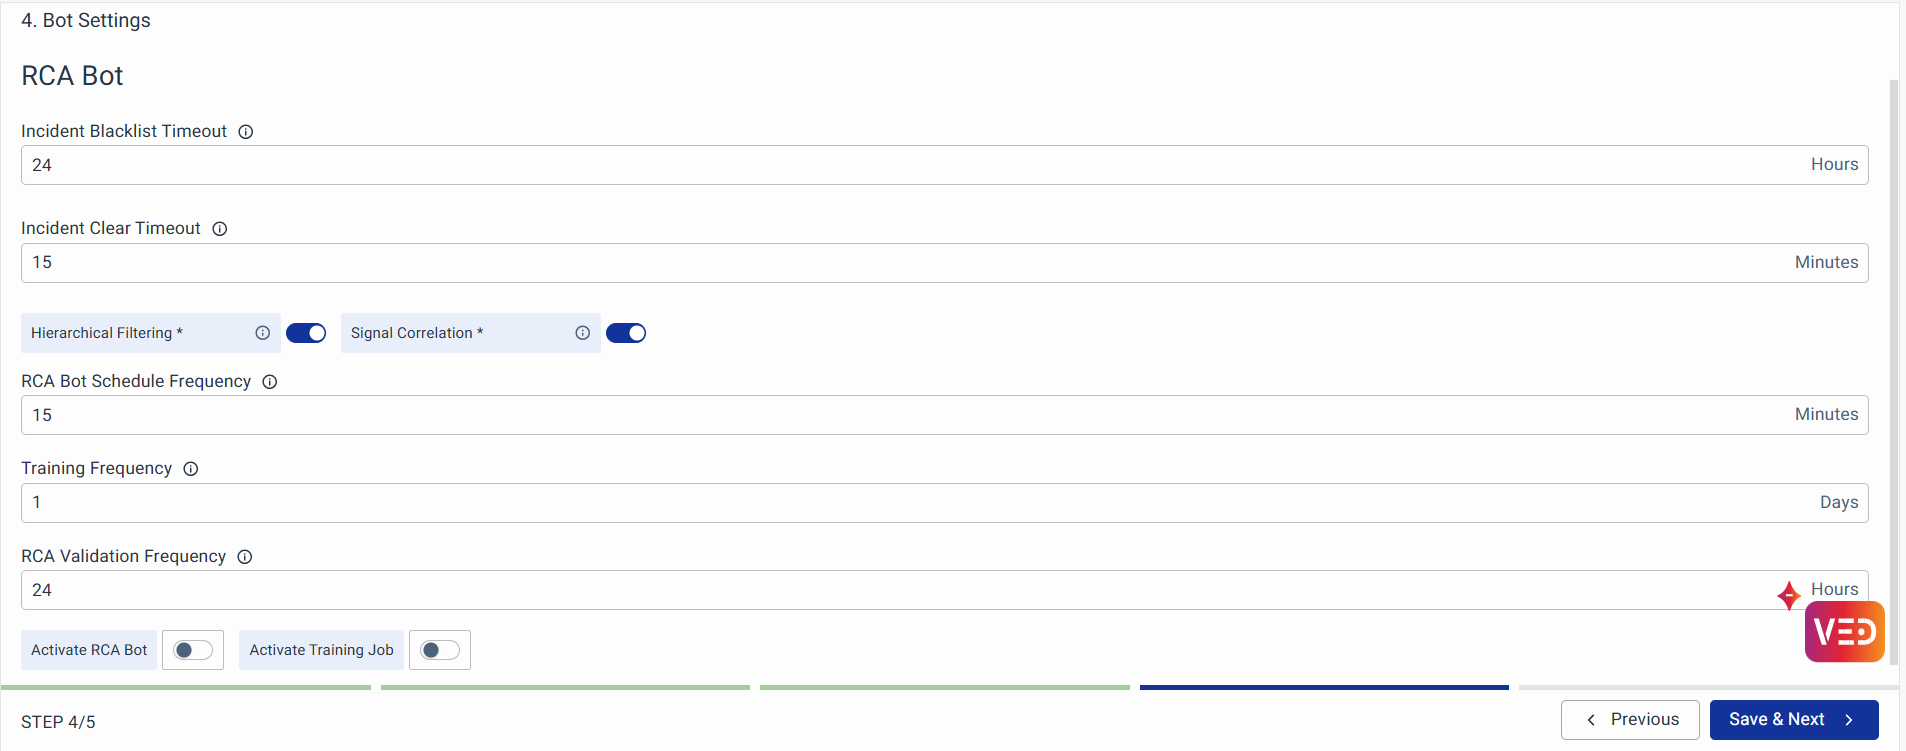
- Hierarchical Filtering: It removes metrics from distant abnormal nodes relative to the node with abnormal lead indicators. This helps in narrowing down the probable root cause by focusing on the most relevant metrics. If turned off, all abnormal operational indicators are considered for root cause analysis.
- Incident Blacklist Timeout: Defines how long an incident marked as 'NOT AN INCIDENT' remains in the blacklist. Once the specified timeout period expires, the incident is removed from the blacklist and treated as a new incident if it reoccurs.
- Incident Clear Timeout: Specifies the duration an incident must remain inactive to be marked as 'clear'.
- RCA Bot Schedule Frequency: Sets the time intervals at which the RCA bot runs to detect abnormalities or incidents.
- RCA Validation Frequency: Determines the frequency at which the model is trained to validate the probable root cause of incidents based on internal analysis and user feedback.
- Signal Correlation: Identifies correlated operational indicators during an incident to aid in finding the probable root cause.
- Training Frequency: Specifies how often the ML model is trained to determine the probable root cause of incidents within the given workspace.
You can specify the Topological Correlation Frequency (in minutes) and Training Frequency (in Days).
Again, you need to activate the pop-up, If vuRCABot is successfully configured, you’ll get the activation message. After this step, you can expect incidents on the incidents page if any real incidents occur in the system/journey for respective times.
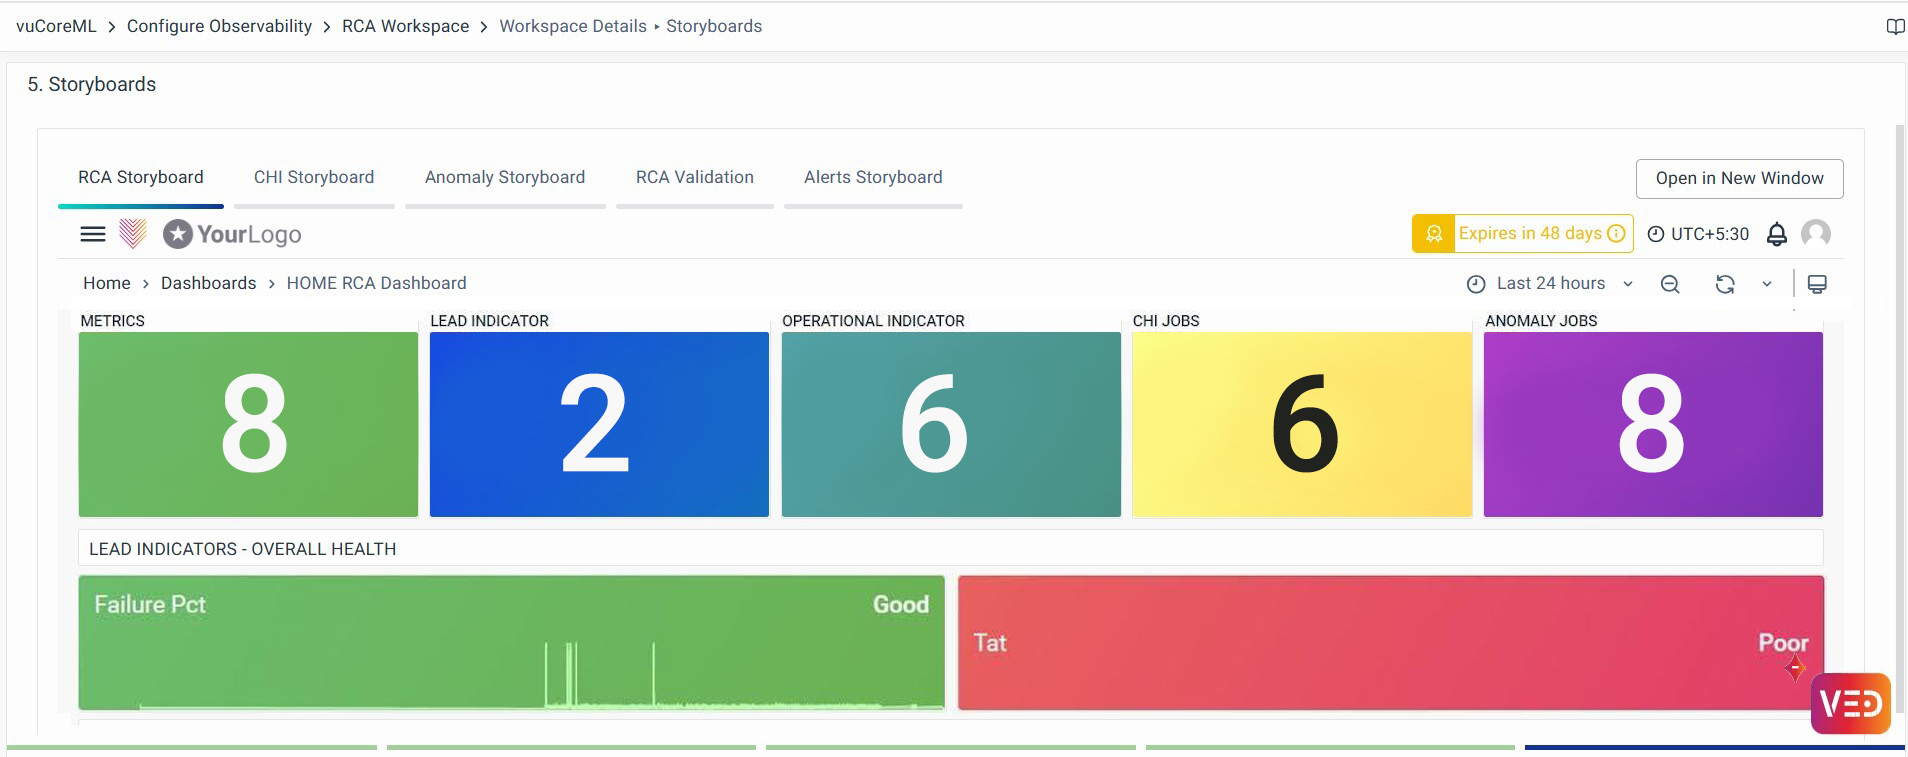
Storyboards
The storyboard contains insights into a workspace. The initial section gives an overview of the list of metrics configured and their roles and health.
The Storyboards can be viewed in a separate browser window for ease of navigation and better user experience. To do this, users need to click the Open New Window button which will open the respective storyboard group in a separate window.
RCA Storyboard:
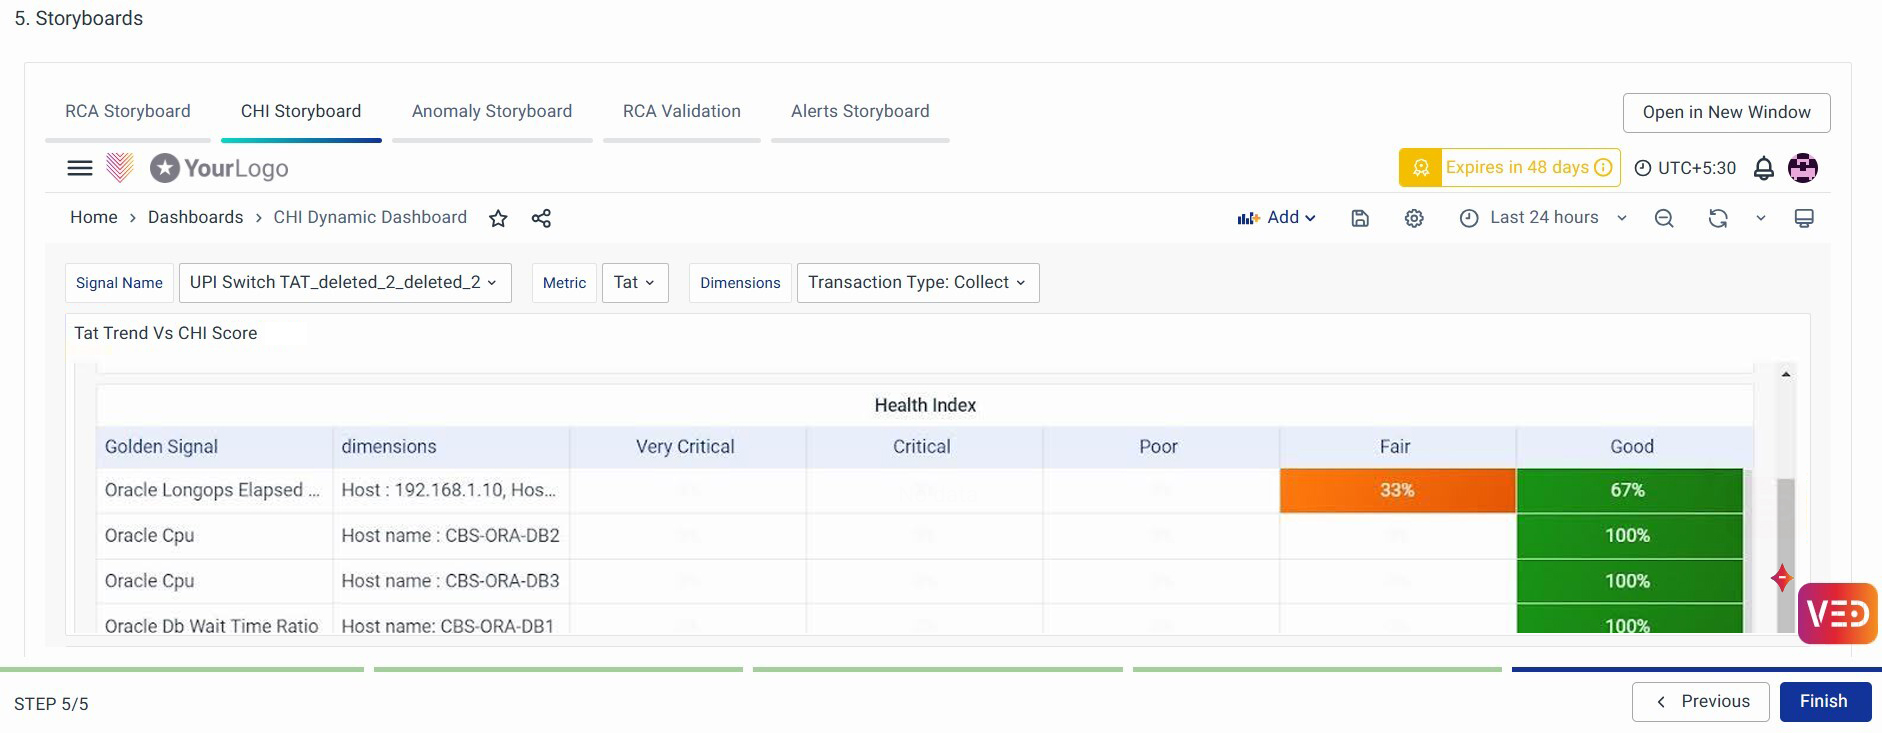
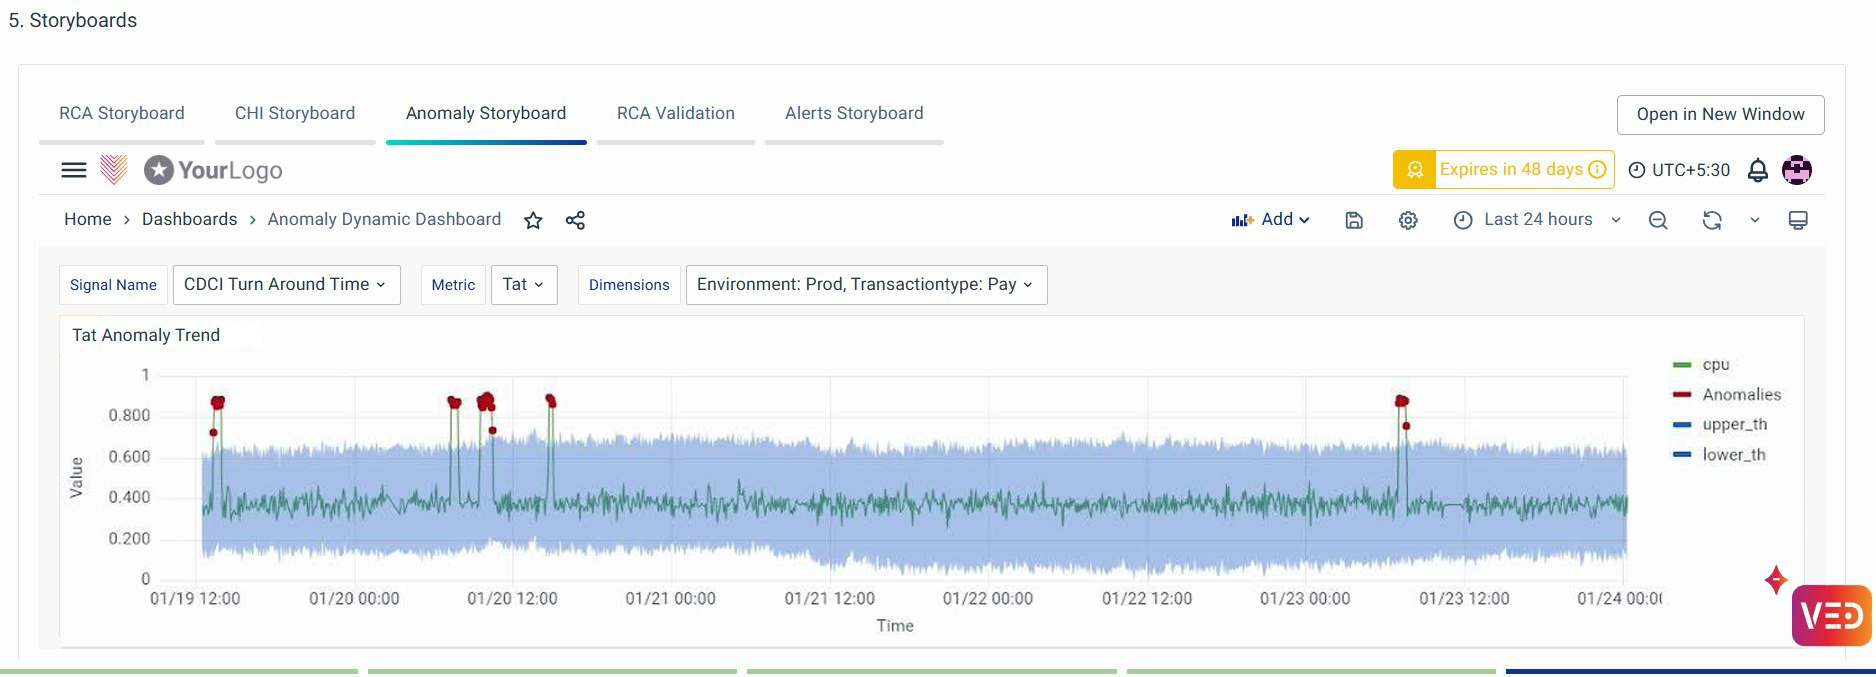
If you want to get insights on configured ML methods for these metrics, you can further select the CHI Storyboard, and Anomaly Storyboard as follows.
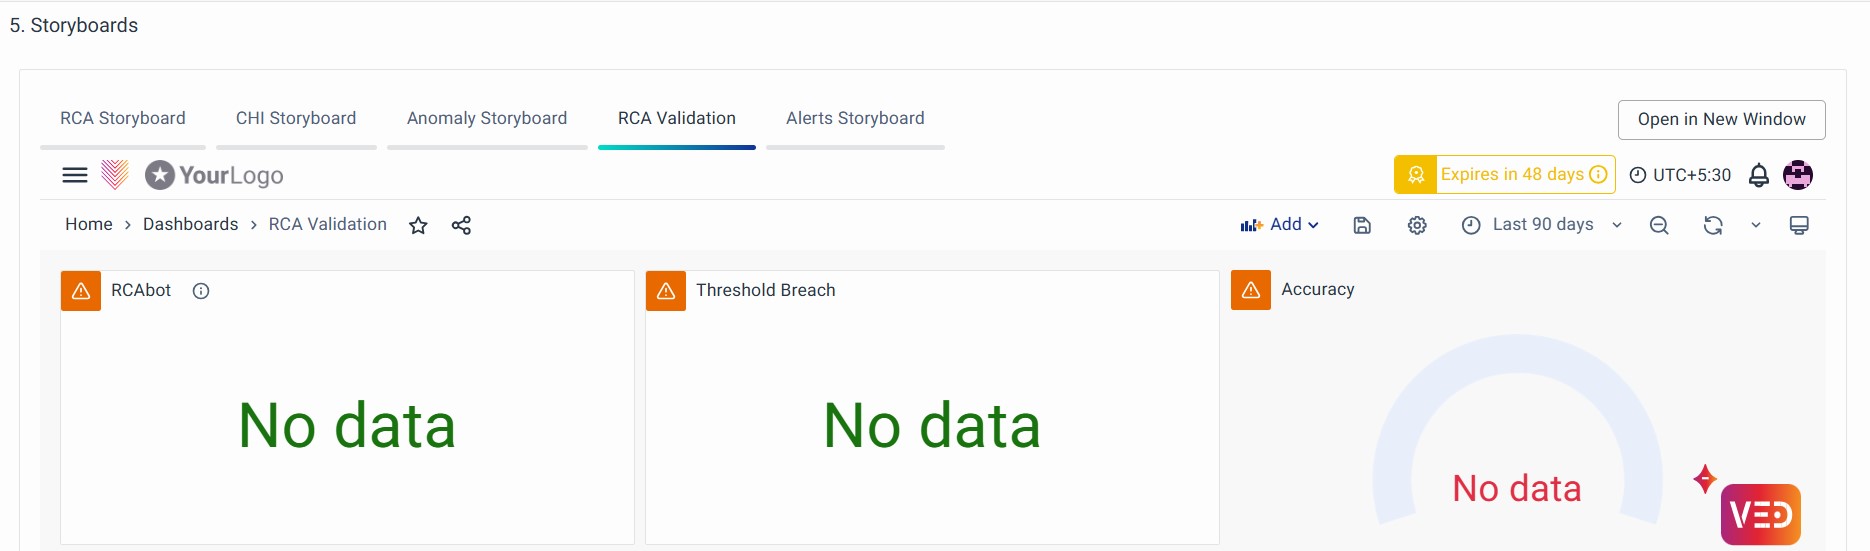
RCA Validation
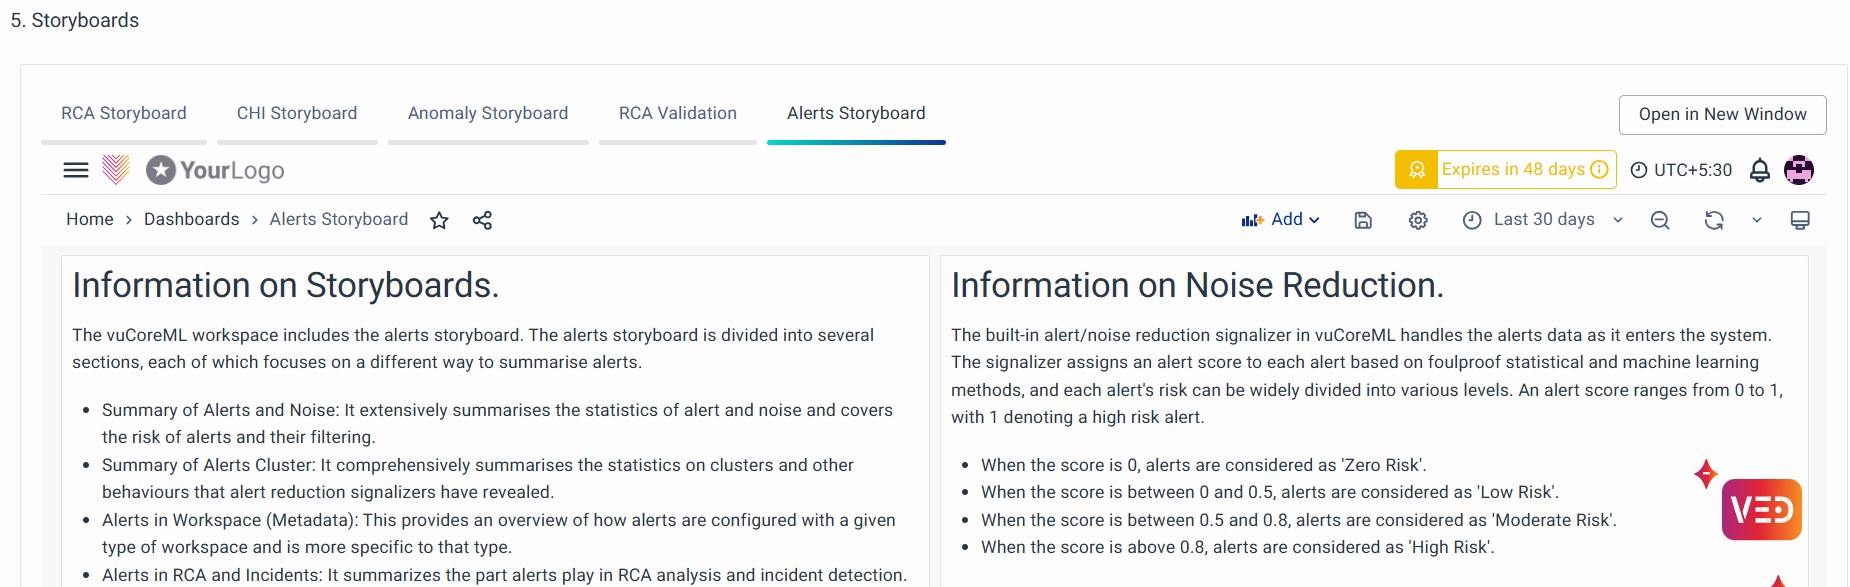
Alerts Storyboards: The Alert Storyboard offers actionable insights and recommendations to help reduce the volume of alerts and improve overall alert management.
Once done, click on Finish to head back to the listing page and find your newly created RCA workspace.
Under the Action column, click the View Incidents button to navigate to the RCA Incidents page for detailed insights.
