Time Series Analysis
It is an anomaly detection technique based on forecasting. We perform forecasting based on time series decomposition (signal=trend+seasonality+residual).
Classical decomposition is used here making it computationally fast and extremely lightweight compared to other methods.
Add Workspace
vuSmartMaps Insights can be accessed from the left navigation menu (Configure Observability > RCA Workspace).
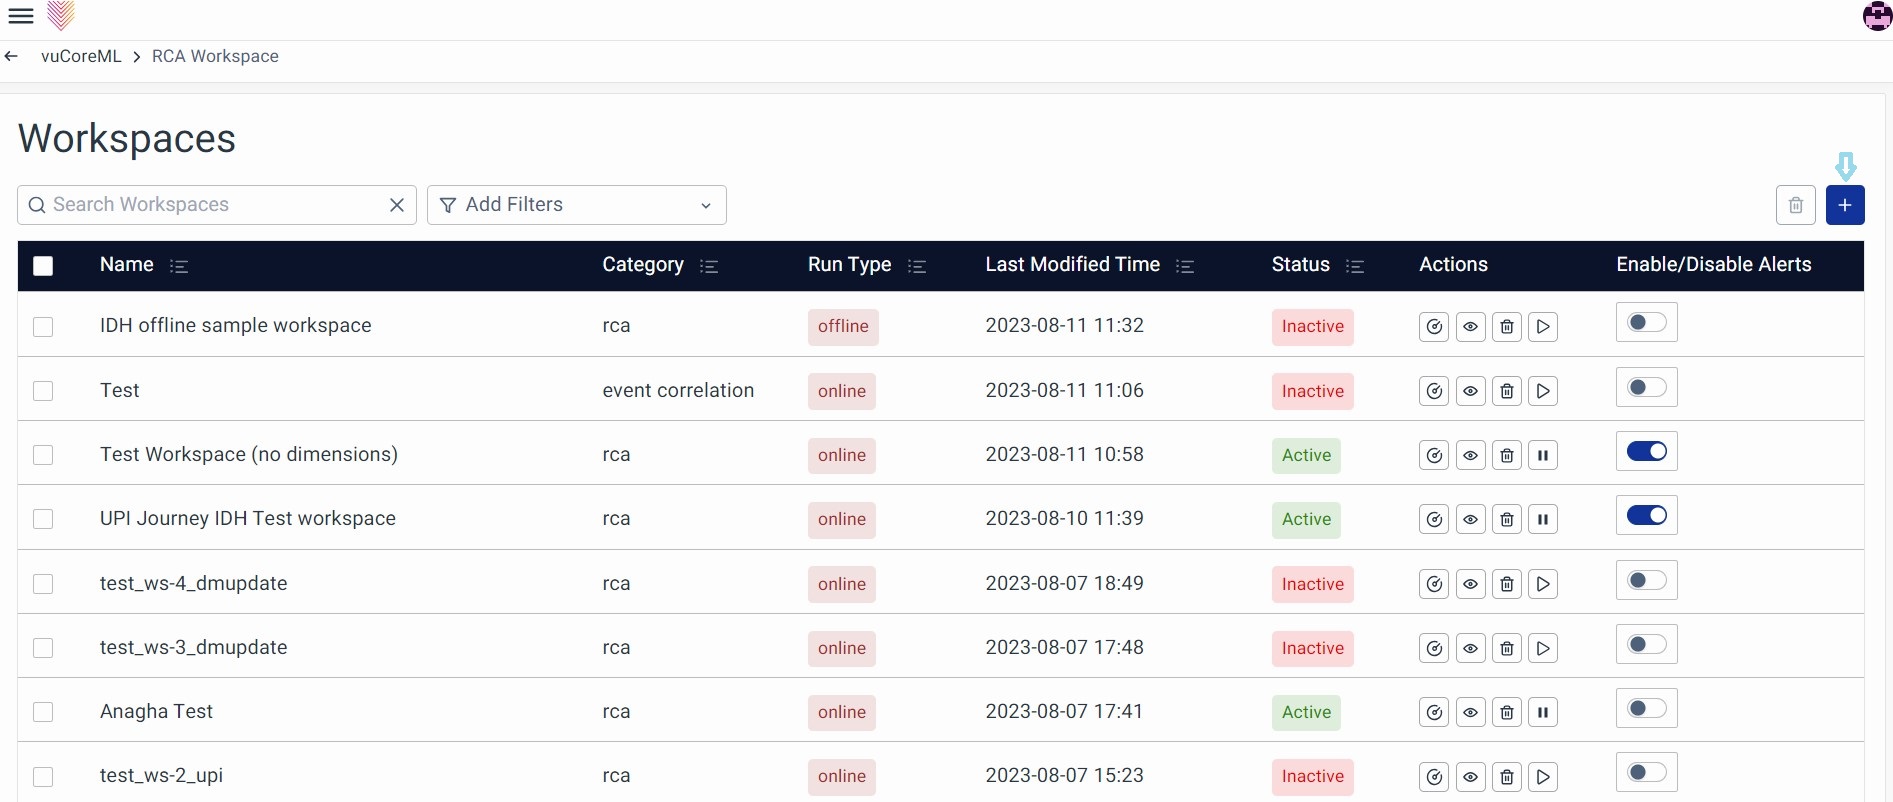
- Name: Identifies the name of the workspace, typically clickable for configuration viewing.
- Category: Indicates the selected category among RCA, Time Series Analysis, 3T Correlation, or ML Correlation.
- Run Type: Specifies whether the workspace processes online or offline data, displaying either 'Online' or 'Offline'.
- Last Modified time: Displays the timestamp of the last modification made to the workspace.
- Status: Indicates whether the workspace is active or inactive.
- Actions: Provides options to View Incidents, Edit Workspace, Delete Workspace, and Activate or Deactivate the Workspace.
- Click View Incidents to navigate to the RCA Incidents page for detailed insights.
- Select Edit Workspace to make necessary adjustments.
- Use Delete Workspace to remove the workspace.
- Toggle Activate or Deactivate to enable or disable the workspace
- Enable/Disable Alerts: Toggle to enable or disable alert notifications for the respective workspace.
Create Workspace: The workspaces page shows a list of previously configured Workspaces. Click on the + icon to create a new Workspace.
You can now configure the workspace; the workspace comprises 4 major sections
- Details
- Sources & Schema
- Signalizers
- Storyboard
Details
Enter the Workspace Name, Description, and choose the Category as Time Series Analysis and choose the Run Type as Online or Offline as per the requirement.
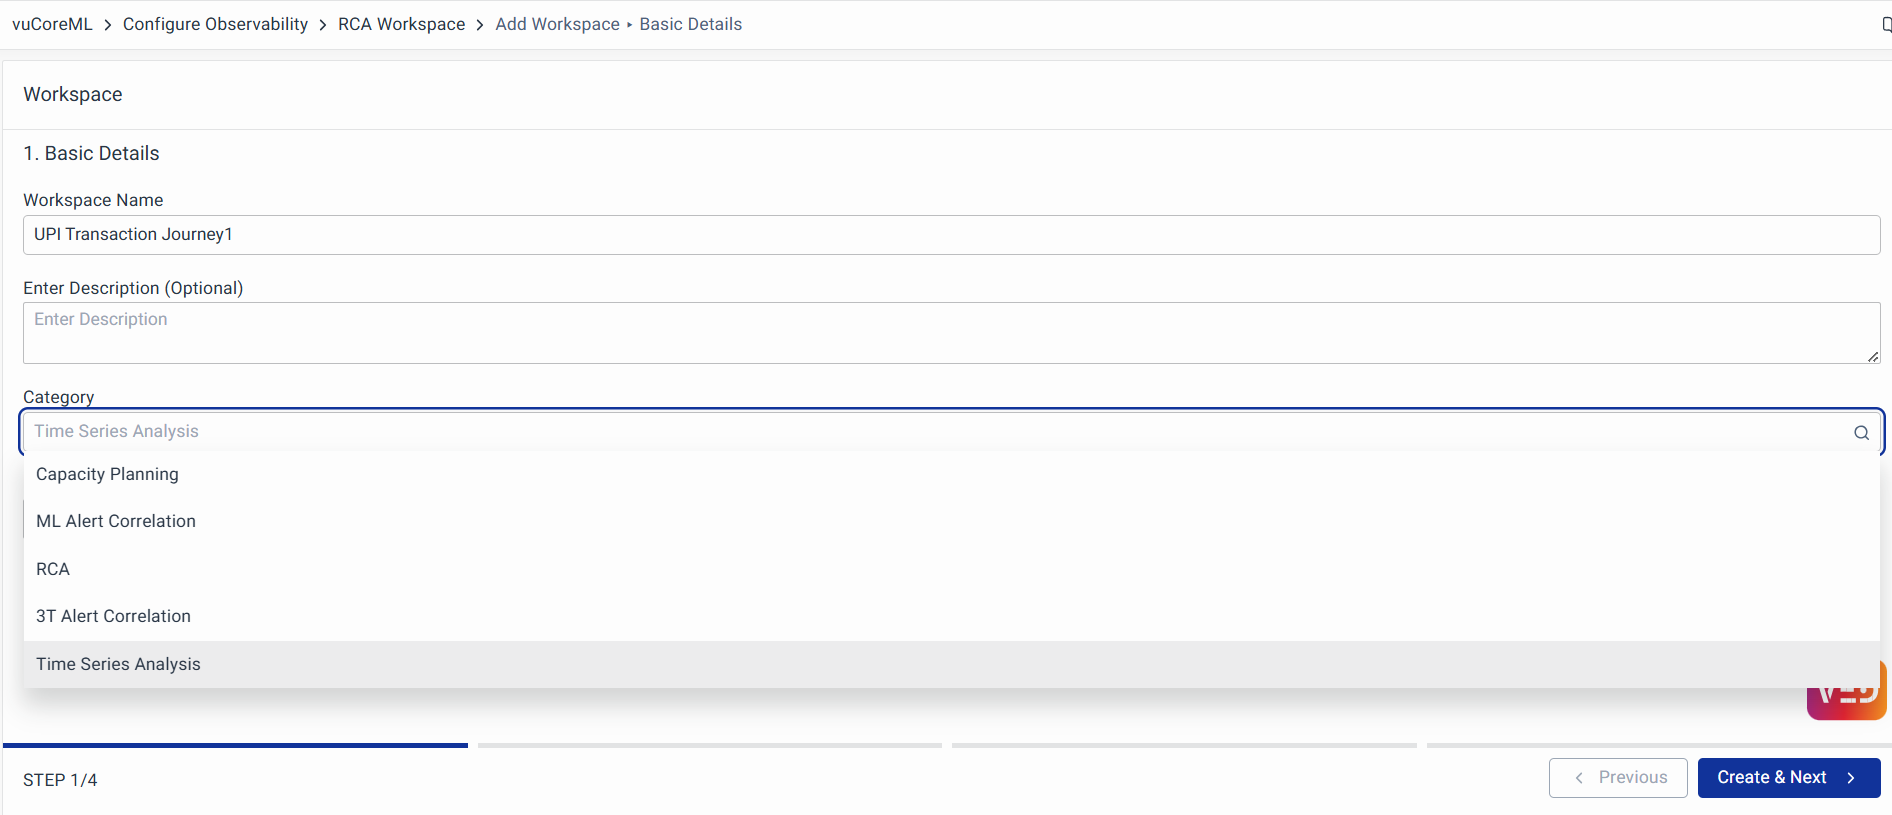
Choose Run Type as Online for live data and Offline for third-party systems or files.
Click on Create and Next at the bottom right to create the Workspace.
Sources & Schema
Once Workspace is created, you will be directed to the Schema page, where you can configure the schema which comprises of Journey, Components and Graphs. The schema is the place where you’ll have to define the business journey and its metrics.
Metrics can be categorized into three types,
- Lead Indicators (Business impacting metrics)
- Operational Indicators (Application/Infra/Underlying metrics)
- External Indicators (External metrics)
You must categorize the metrics accurately because the incidents will be detected only for the lead indicators.
Journey
The journey will be the super-set of all metrics and components (i.e. you can think of this as a business journey). You can categorize the metrics at the journey level if they don’t specifically come under any particular component.
You can now click Journey and add a new signal.
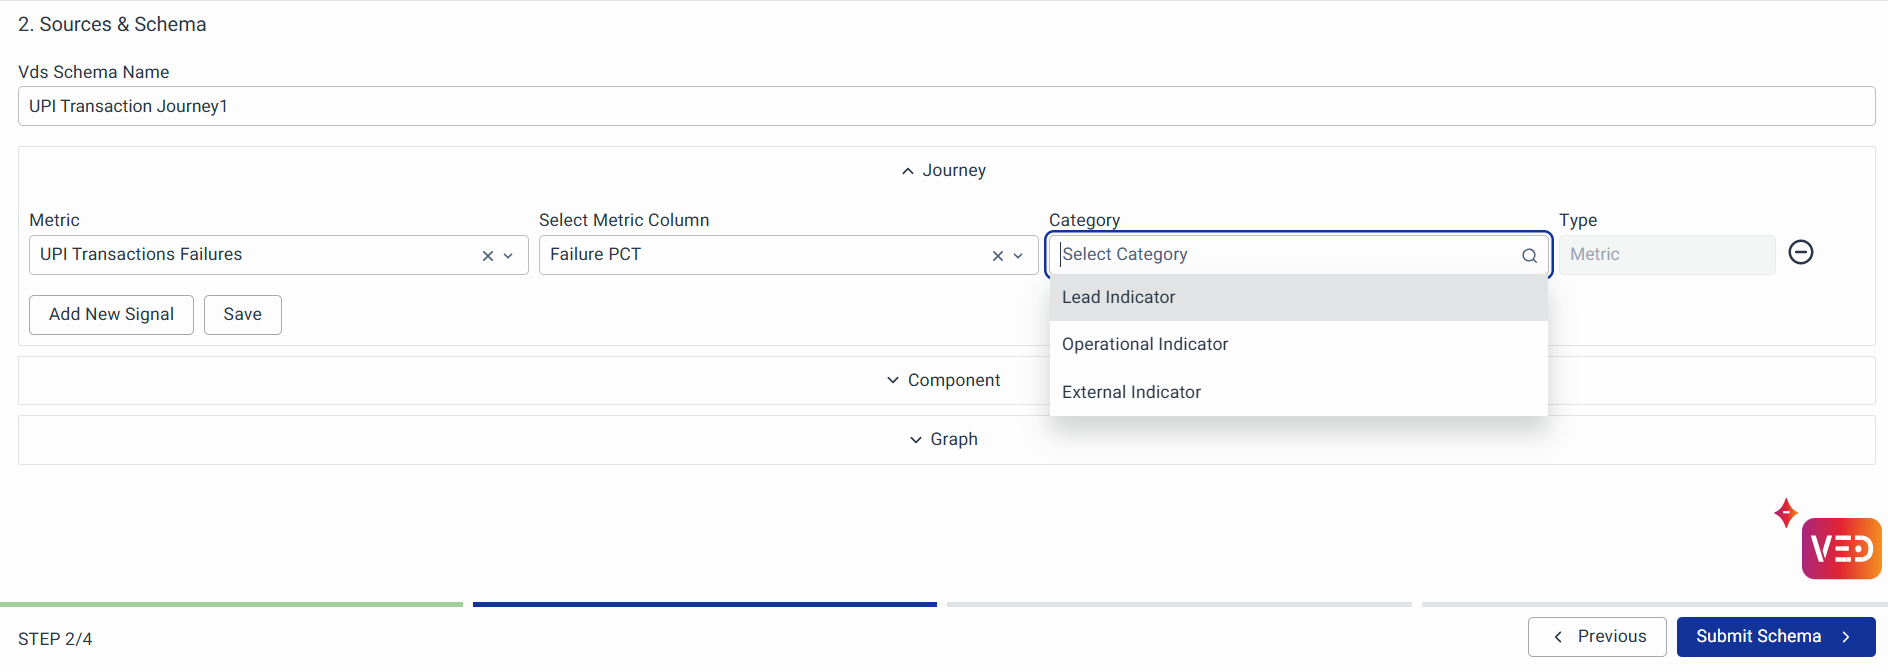
For each signal you will be adding, you’ll have to specify the data model and metric column in that model for this signal. Only metric columns in a data model are eligible to be indicators.
You can use the listing option to specify the data model and respective metric column and then categorize that metric using the category listing option. Similarly, you can add other signals. Click on Save.
Components and Graphs
This is similar to steps explained in Schema of RCA Workspace Once the configuration is completed click on Submit Schema at the bottom right.
Signalizers
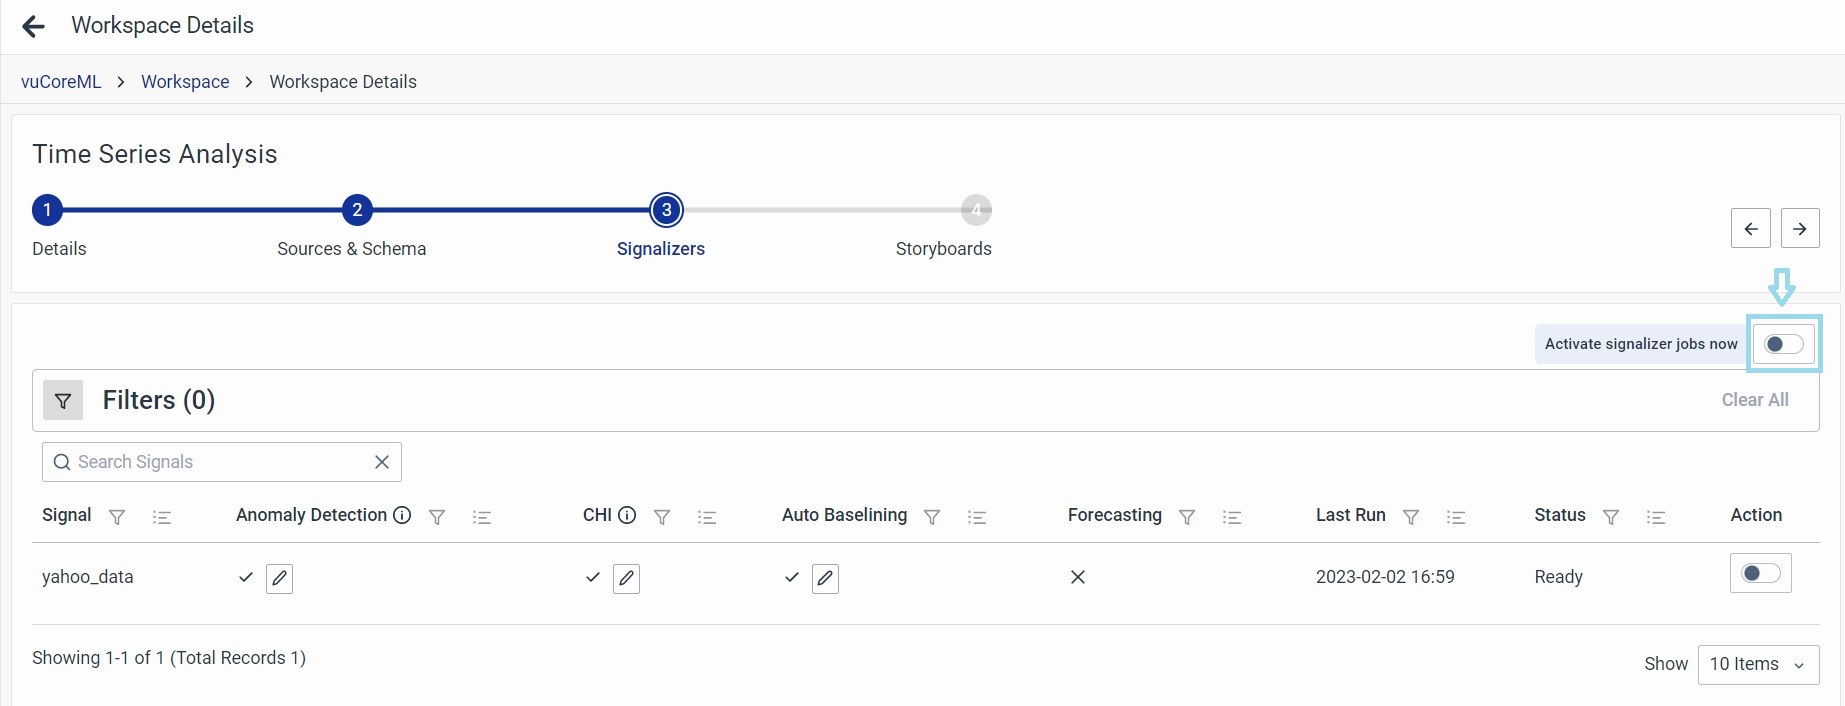
After successfully submitting the Schema, click on the right arrow mark at the top right and you will be directed to the Signalizers page. The signalizers page contains the list of metrics configured in the Schema page along with information on ML methods that will be running for the respective metrics
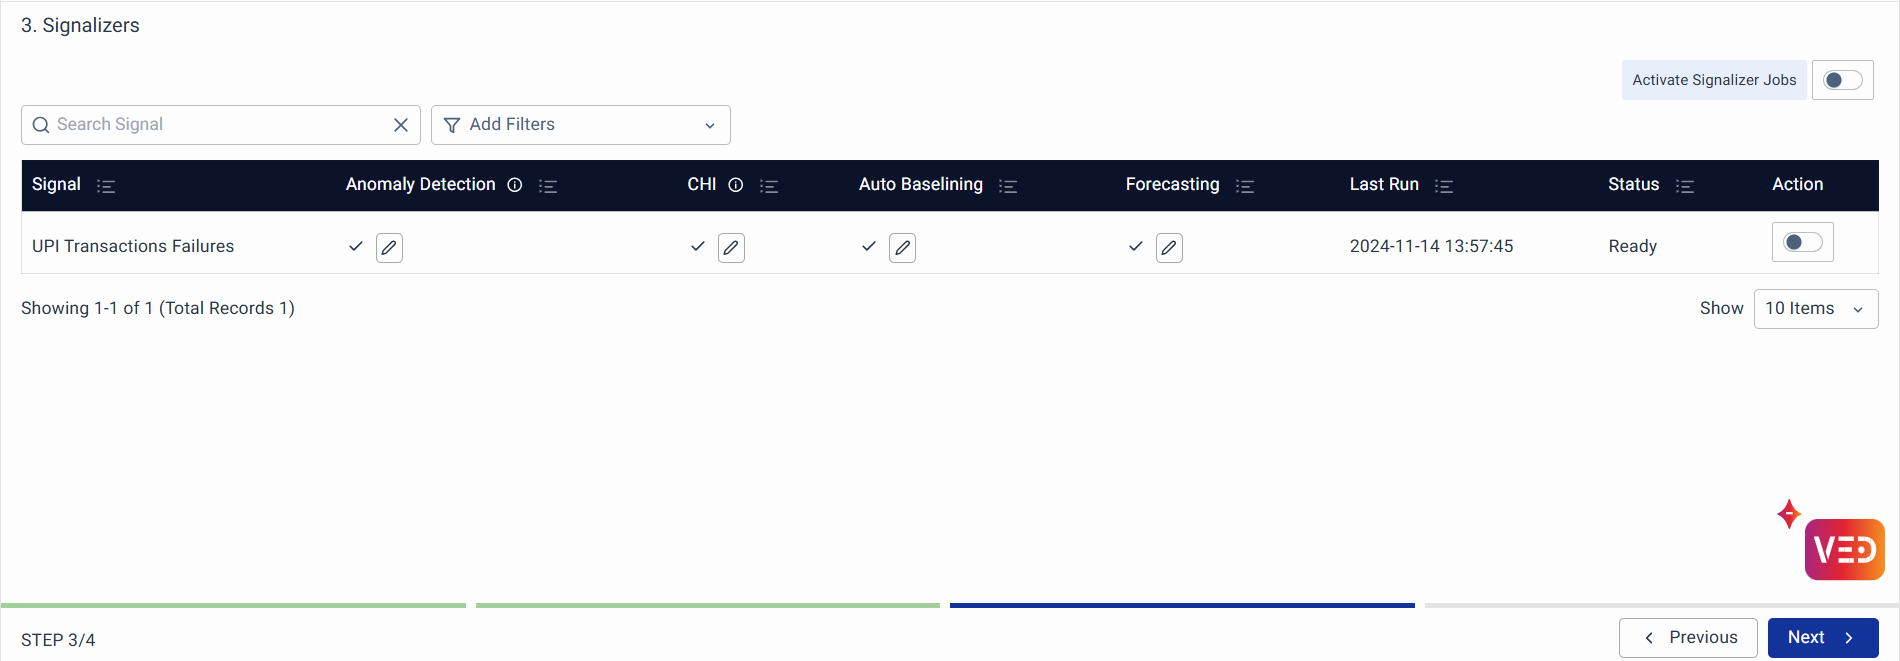
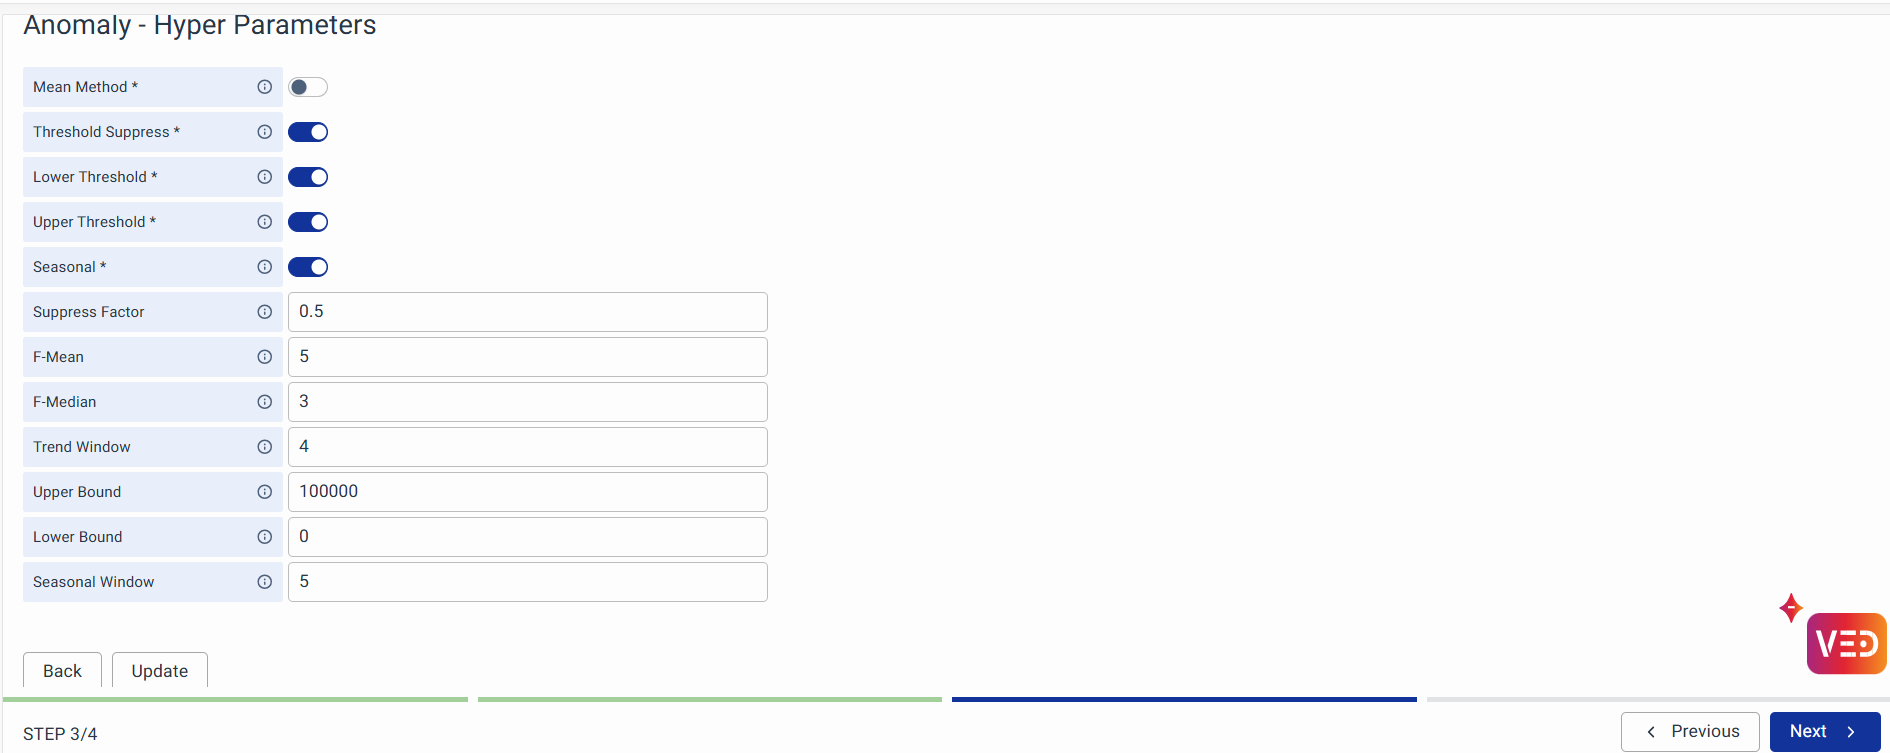
If you want to change the hyper-parameters for a particular metrics ML method, you can click the Edit button of the metrics ML method. It will direct you to the hyper-parameter editing page. After editing, you can click the Update button to override the default parameters.
Now you can either globally activate the signalizers or activate only specific metric signalizers as per requirement locally (at the action section of each metric listed on this page)
After activation, a pop-up will come up where you can click the Activate button at the top right. After clicking, the Time Series Analyser will start creating the required pipelines. Once the pipelines are created.
Click the Next button at the bottom right and go to the next section.
Storyboards
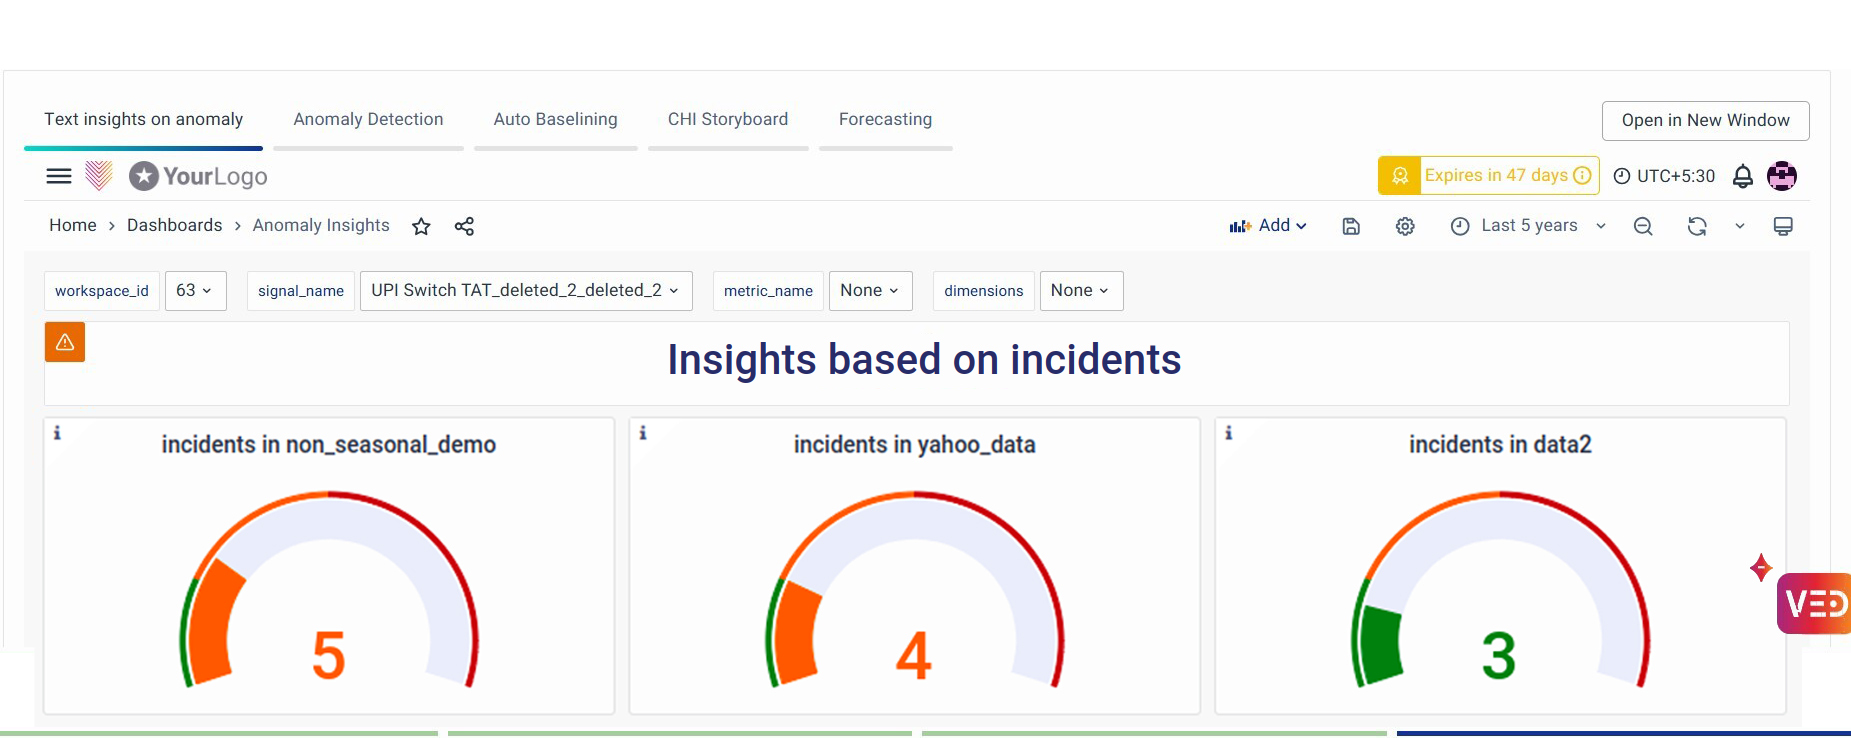
The storyboard contains insights into a Workspace.
- Anomaly Scoring: Every anomaly detected is scored between 0 to 1. A higher score implies the point is very far from the prediction, hence bad.
- Anomaly Masking: When the model detects an anomaly, the model knows that it's an anomaly and will mask it during further training. So predictions are not affected by past anomalies in the data.
Text Insights on Anamoly: The initial section gives an overview of the list of metrics configured and their roles and health.
Anomaly Detection:
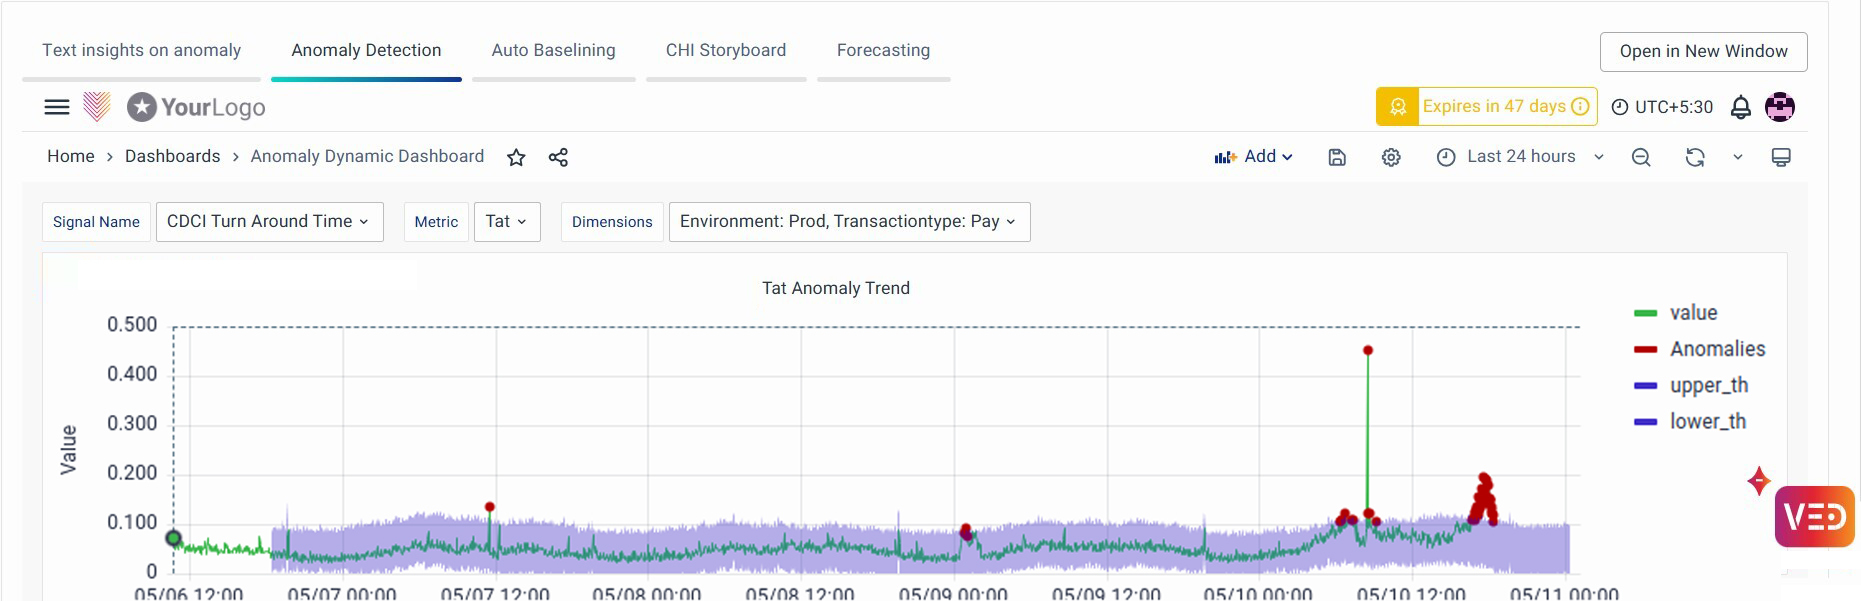
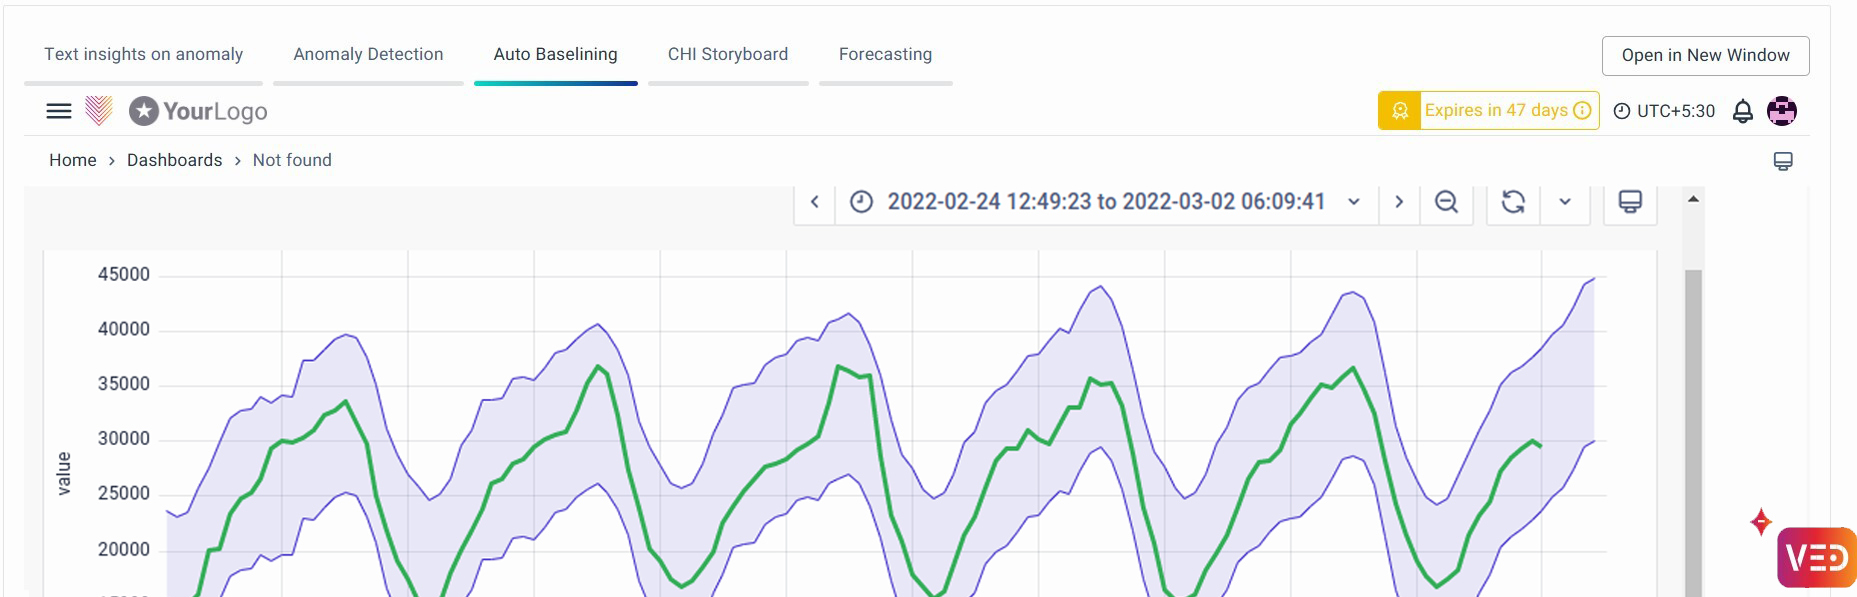
Auto Baselining: Provides the upper and lower threshold for a signal.
CHI Dashboard:

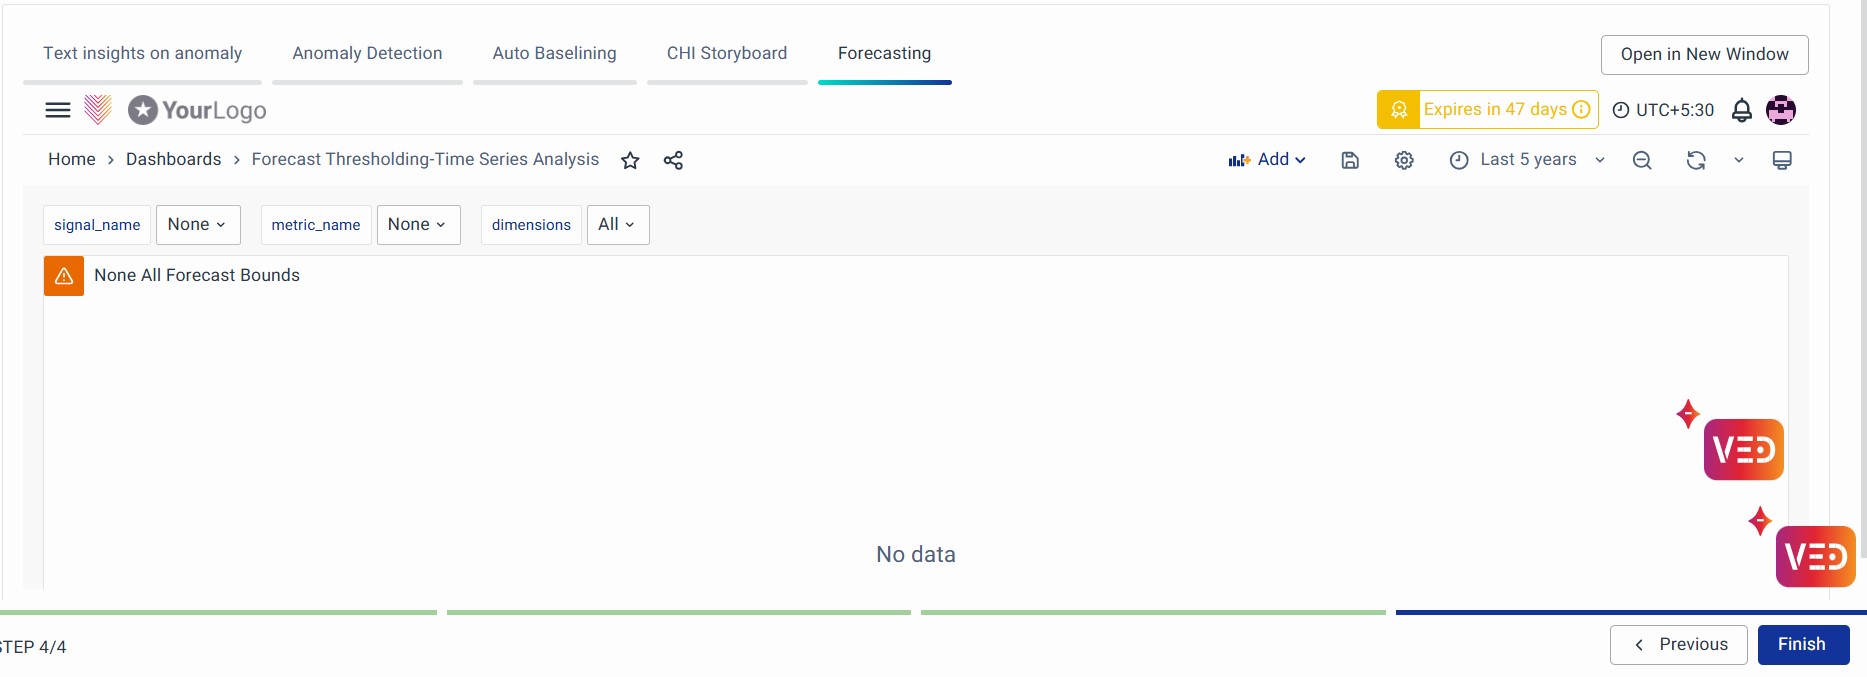
Forecasting:
Click on the Finish button at the bottom right to complete the configuration. Under the Action column, click the View Incidents button to navigate to the RCA Incidents page for detailed insights.
