Alert Console
Introduction
Alert Console is where you can find all the information about issues that may be impacting your business performance. By paying attention to the active alert severity, you can assess how external users perceive your system. Critical alerts can result in a negative experience for your customers who rely on services like fund transfers, login access, and more to meet their needs. Let's navigate through this guide to ensure you have the insights you need for smooth operations
Navigating through Alert Console
Alert Console comprises the following sections:
-
Accessing Alert Console
This section helps you to access the Alert Console from the home page. It provides a list of all alerts triggered within a specified time frame. Associated and Correlated alert sections (future releases) will also be available, offering a comprehensive view of the system's alert activities. -
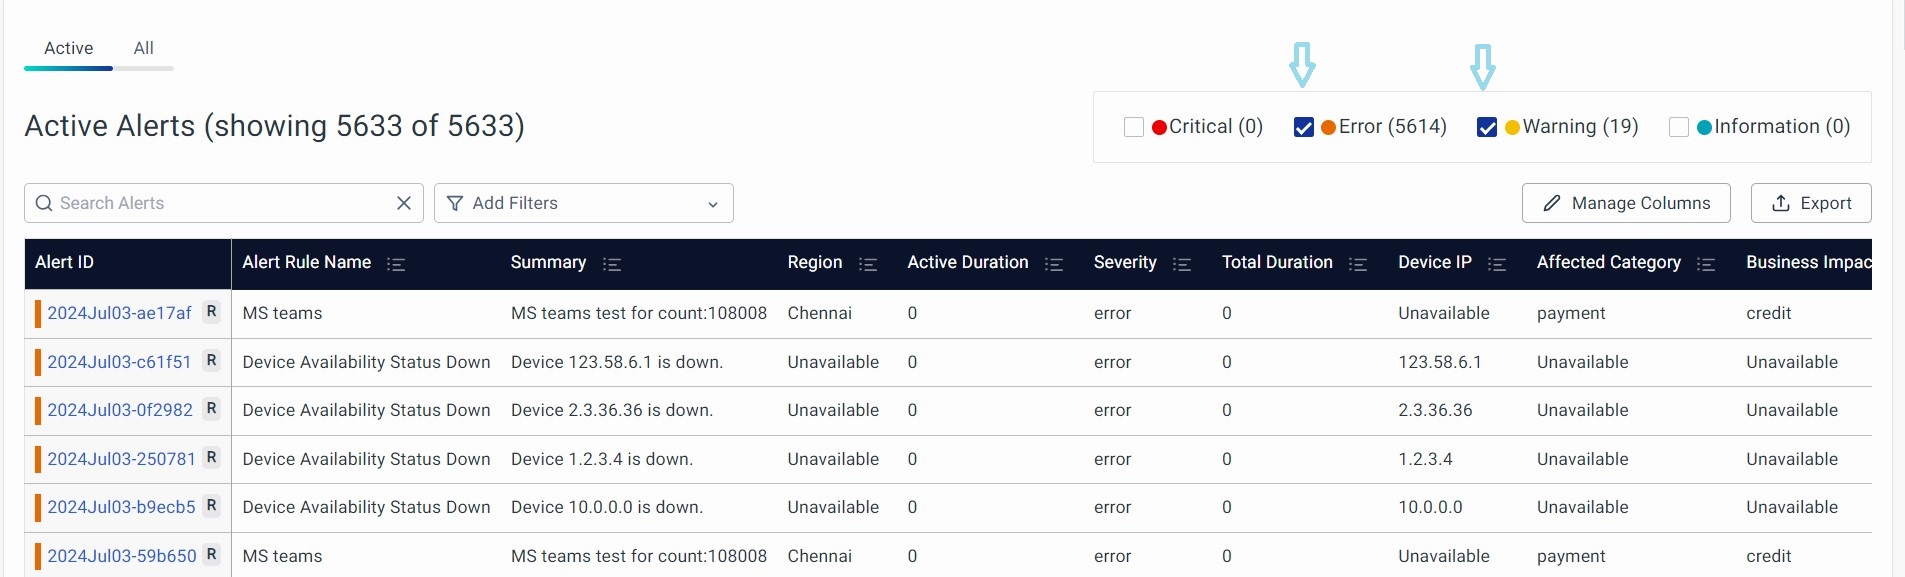
Alerts Based on Severity
In the Alert Console, widgets categorize Alerts by severity, providing a summary of each category. These widgets display the total Alert count for different severities - Critical, Error, Warning, and Information. -
Alert Details
Alert Details provide a detailed view of specific Alerts in the Alert table. It further provides a comprehensive source of insights under key sections namely Overview, User Feedback, Contextual Metrics, and Information Table. -
Operations On The Alerts Listed
In the Alert Listing table, you can perform various operations to streamline your experience such as Search, Filter, and Sort. -
Configurations
On the Alert Console page, you can personalize your experience with configurations such as Configure Displayed Fields and Adjust Alert Display.
Accessing Alert Console
vuSmartMaps Alert Console can be accessed by navigating from the left navigation menu (Observability > Alert Console).
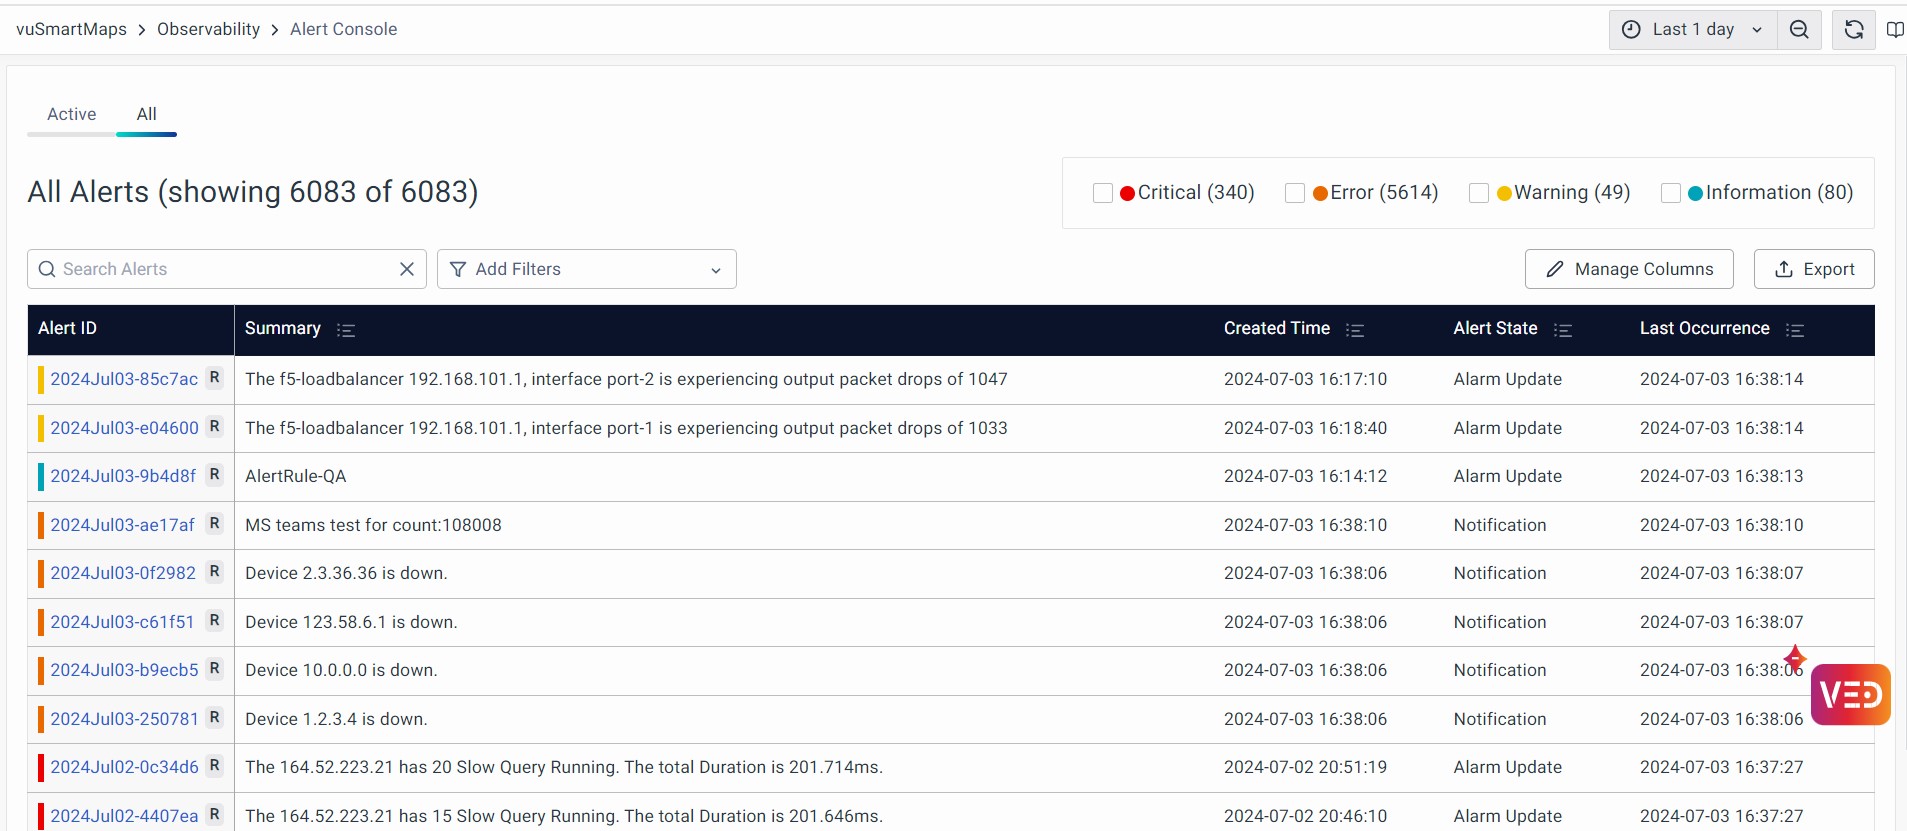
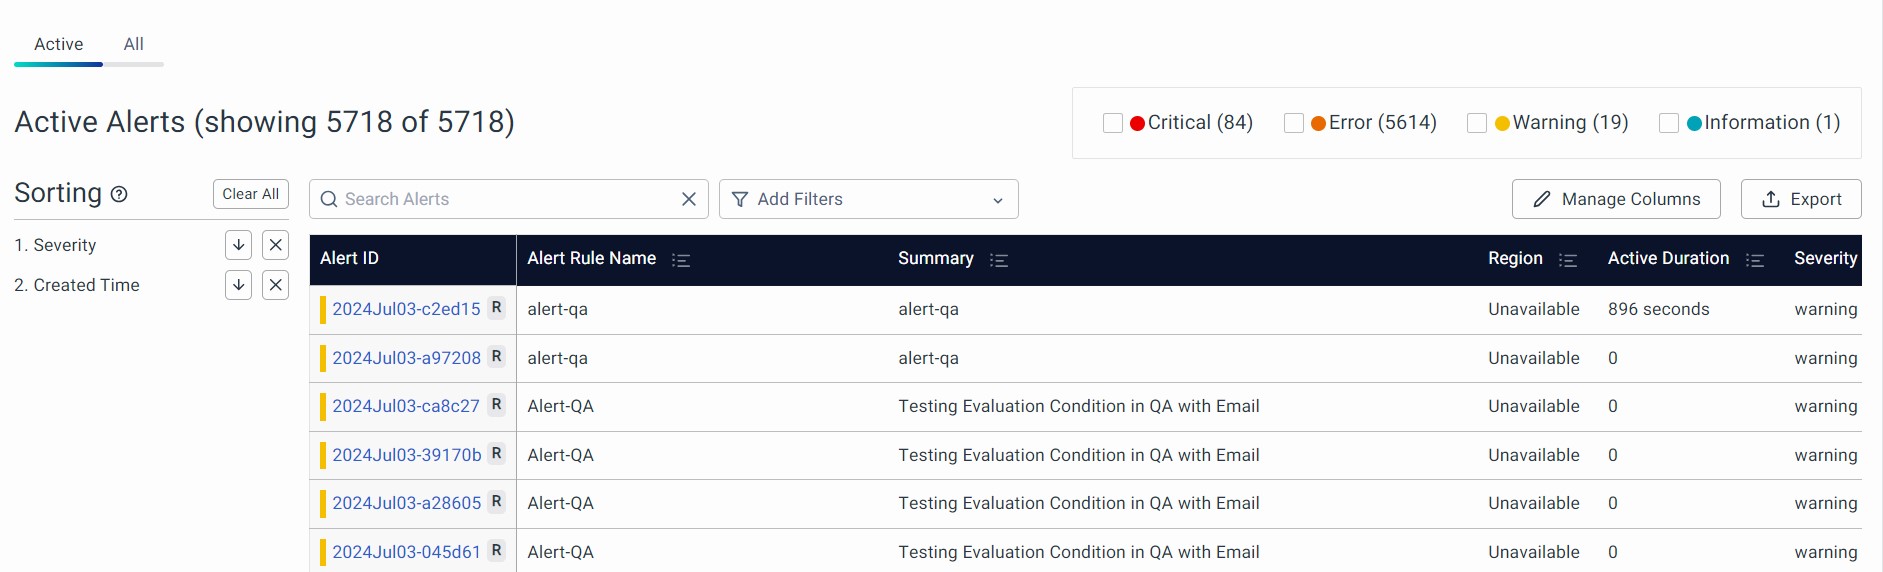
Alert Listing
This tab lists the detailed view of ‘Active Alerts’ and ‘All Alerts’ triggered during the specified period.

-
Active Alerts: This tab lists the detailed view of ‘Currently Active Alerts’ that were triggered during the specified period.
- Alert ID: The unique ID for the alert. You'll notice a thick colored line at the start of each row, indicating the Alert's severity.
- Alert Rule Name: The name of the rule that triggered the alert, helping to identify the specific condition or set of conditions that were met to generate this alert.
- Summary: It provides a summary of the Alert, highlighting crucial details.
- Location: The region or location where the alert was generated.
- Active Duration: How long the alert has been active.
- Severity: The severity level of the alert.
- Total Duration: The combined duration of the alert being active and inactive.
- Device IP: The IP address of the device where the alert originated.
- Affected Category: The category of the affected component or system, such as Network, Application, or Database, that helps in quickly identifying the impacted area. Example: Payment
- Business Impact: Information on the business impact of the alert. Example: Credit, Debit.
- Source: The source of where the alert was generated.
- Created Time: The timestamp of when the alert was created.
- Correlation ID: A unique identifier used to correlate this alert with other related alerts, helping in identifying patterns or related incidents.
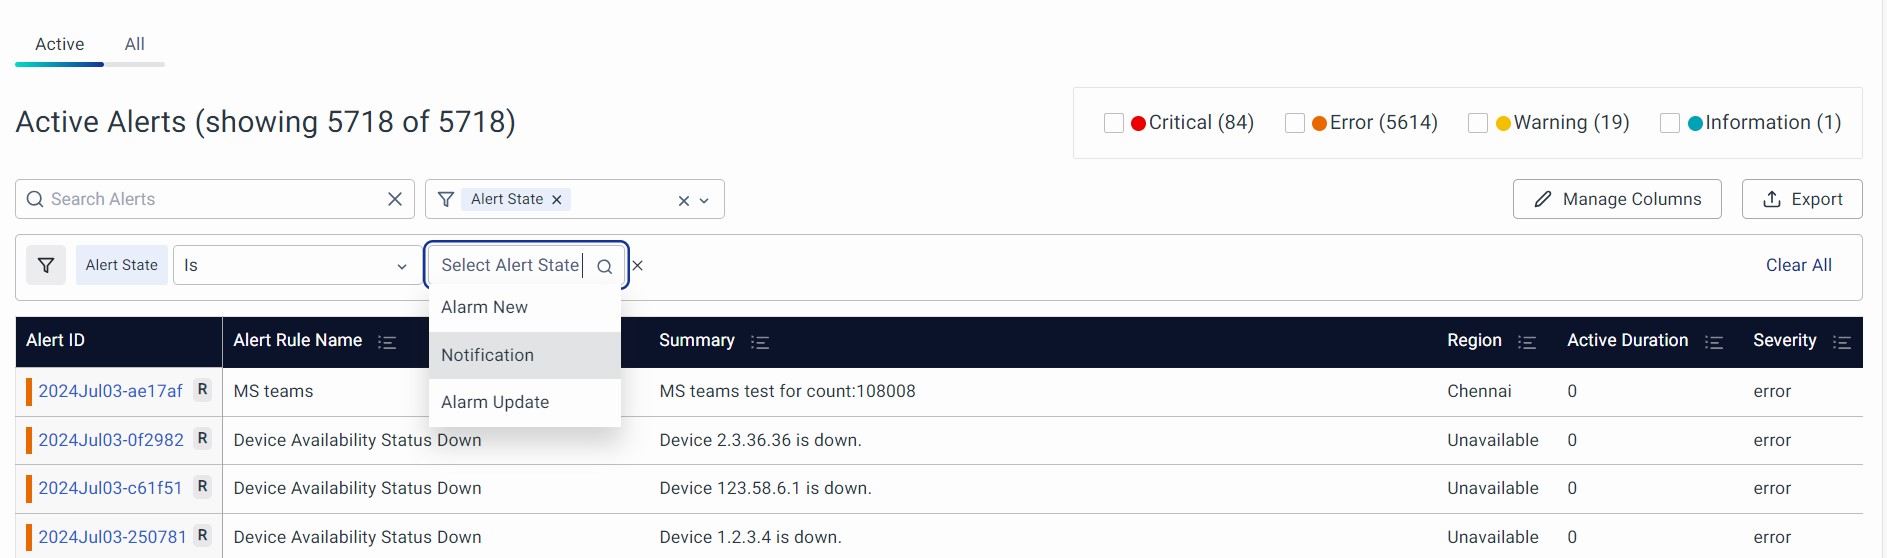
- Alert State: The current state of the alert, with possible values - Notification, Alarm New, Alarm Update, or Alarm Clear.
- Ticket ID: The ID of the ticket created in the incident management system for this alert.
- Actions: The tickets can be managed by creating a new one or viewing an existing one. For more details, refer to Managing Alert Page Tickets.
- Ticket Creation Time: The timestamp of when the ticket associated with this alert was created.
- Last Modified Time: When the alert was last edited.
- Last Occurrence: The most recent time the conditions for the alert were met, indicating the latest instance of the issue.
- Likes: User feedback indicating approval or usefulness of the alert.
- Dislikes: User feedback indicating disapproval or lack of usefulness of the alert.
- Related Events Count: The number of related events linked to this alert,
- Status: The current status of the alert, with possible values - Unassigned, In Progress, or Cleared.
- User Reaction: The reaction or feedback provided by users regarding the alert. Example: Like.
- AppName: The application that is affected by the alert, providing context on which part of the system is experiencing issues. Example: CBS Main
- Business Journey: The specific business process or journey impacted by the alert. Example: UPI.
- Component: The specific component or part of the system that triggered the alert, such as a server, database, or application module. Example: CBS Component
- ServerName: The name of the server that is experiencing issues.
-
All Alerts: This tab lists the detailed view of ‘All Alerts’ triggered during the specified period.
Rule-Based Alert Correlation
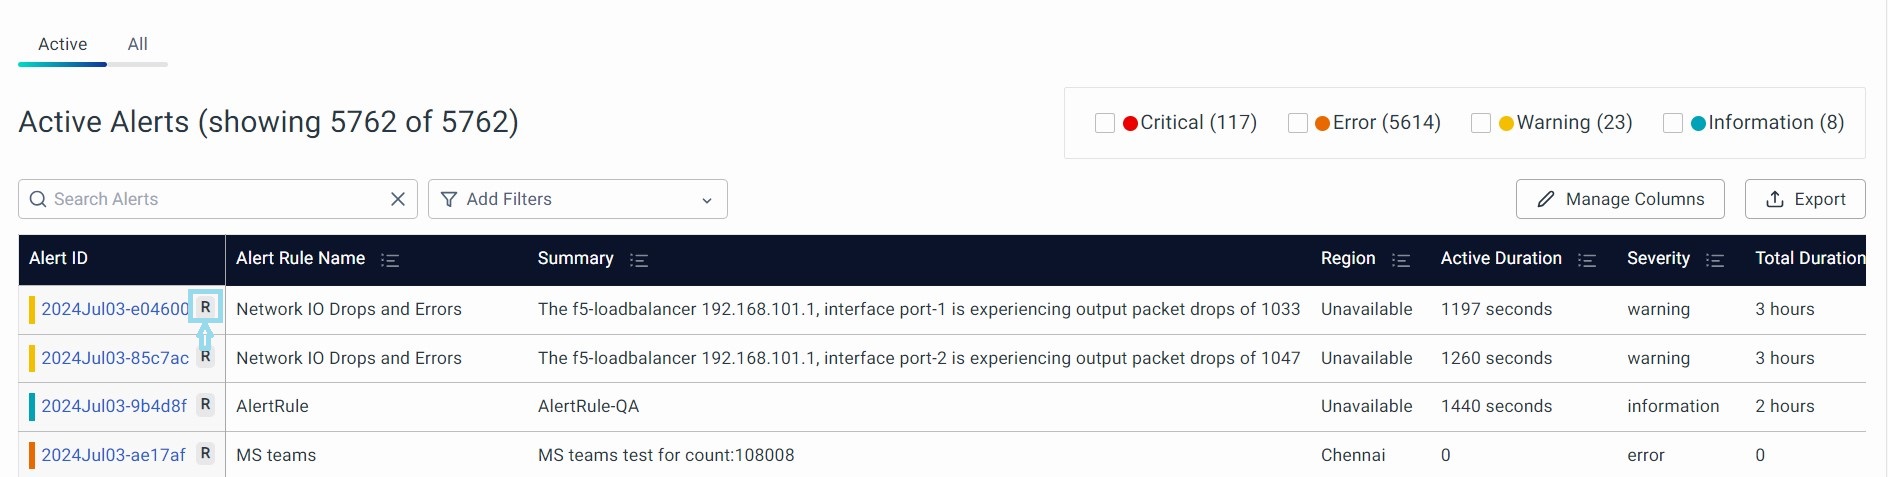
The tag ‘R’, which is present next to the Alert ID, indicates Rules-Based Correlated Alerts. The correlation helps by analyzing many alert streams from different sources, correlating them by various factors, including data and domain, and reducing the noise.
The columns displayed here can be personalized based on your requirements. You can look up the instructions under Configurations.
Auto Refresh
The Auto Refresh option in the Alert Console allows you to automatically update the list of alerts at regular intervals. This feature ensures that you always have the most recent alert information without needing to manually refresh the page.
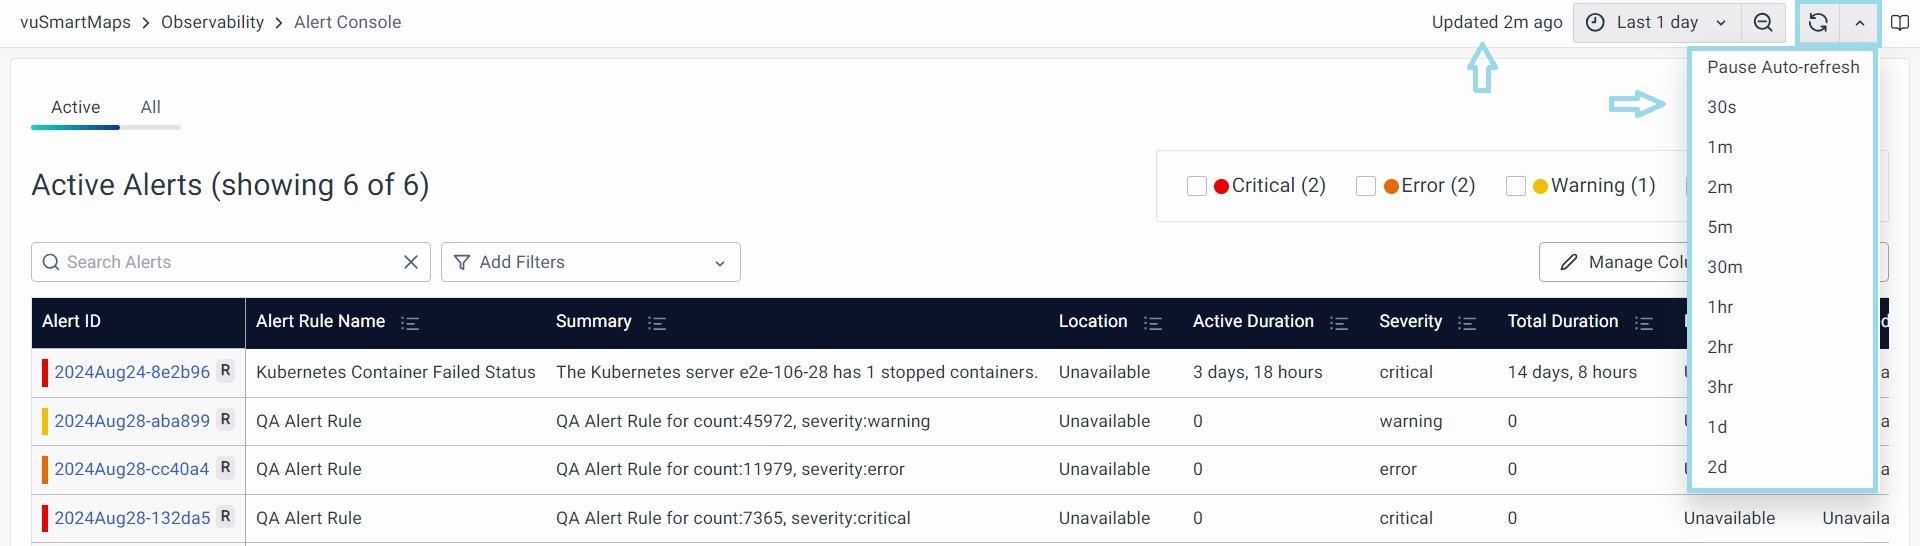
- The dropdown menu provides various time intervals (e.g., 30 seconds, 1 minute, 2 minutes, etc.) for auto-refreshing the alert list. You can select any of these intervals based on how frequently you want the data to update.
- The Pause Auto-Refresh option allows you to temporarily stop the automatic refreshing. This can be useful if you want to analyze the current data without it changing.
- “Updated 2m ago” - This auto-populated status indicates how recently the alert list was last updated, helping you know if the displayed data is the latest or if a refresh might be needed.
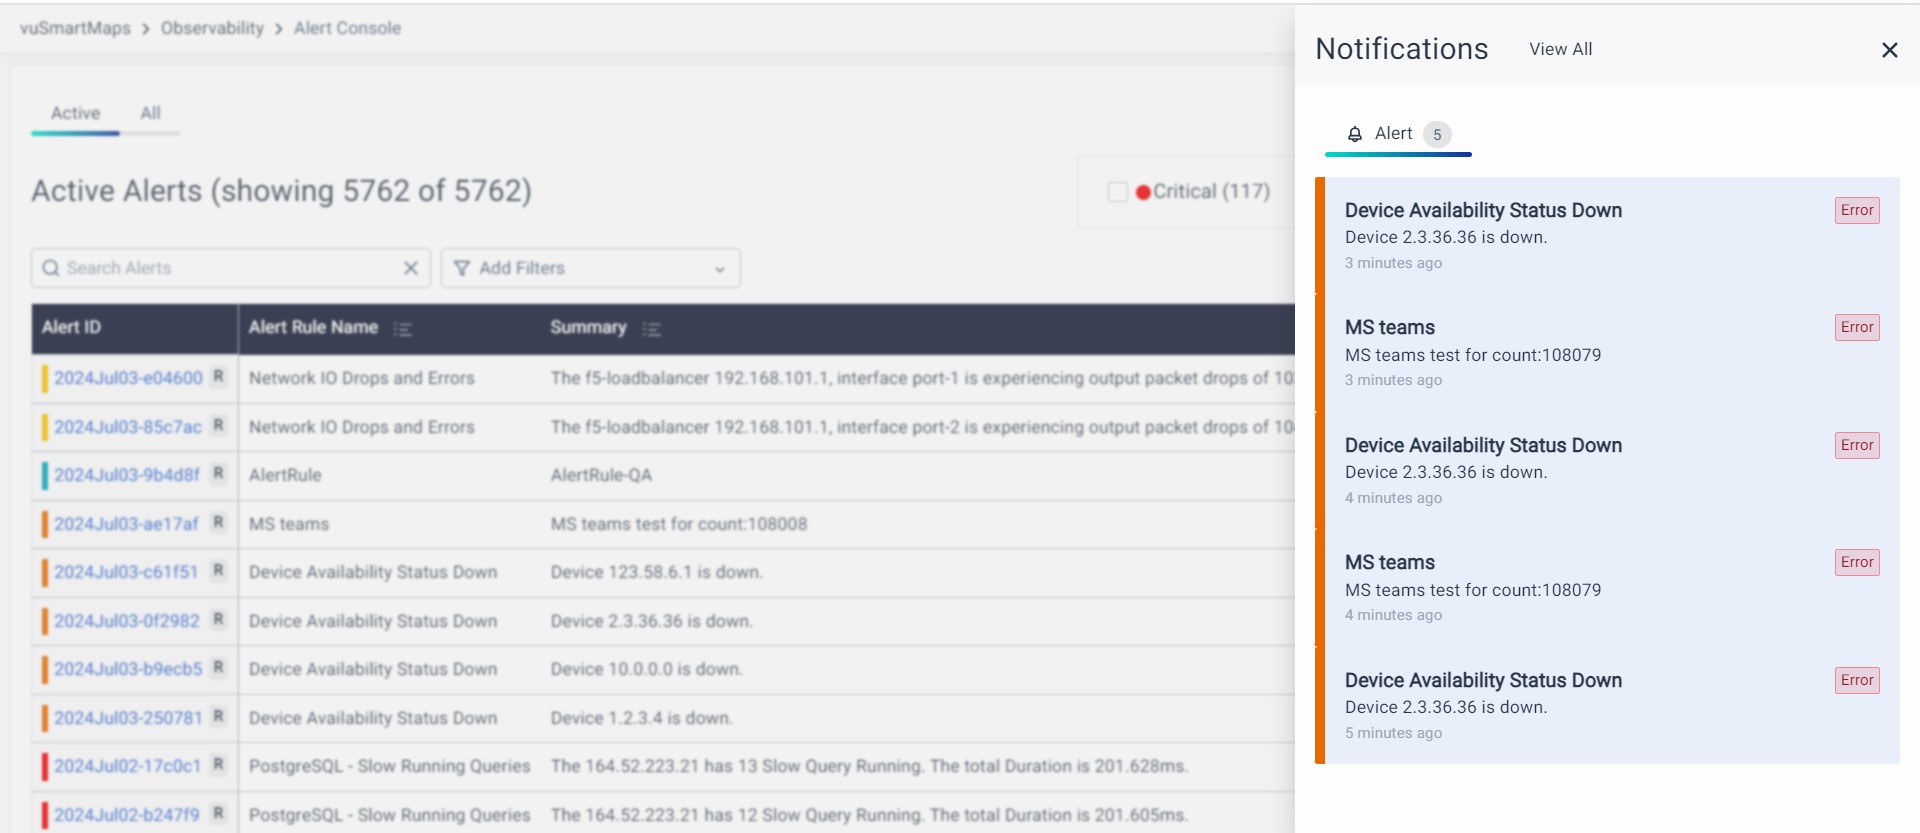
Notifications
Users receive instant notifications as Alerts occur. You can check these notifications in the Notification bar under the Alerts section, as shown in the screenshot below. We show the most recent 5 alerts. You can go to Alert Console upon clicking 'View all'. You can go to “Alert details” of the Alert Console by clicking an alert.
Managing Alert Page Tickets
In the Alert Listing page, users can manage tickets for each alert through the Icon in the "Actions" column.
Creating a Ticket:
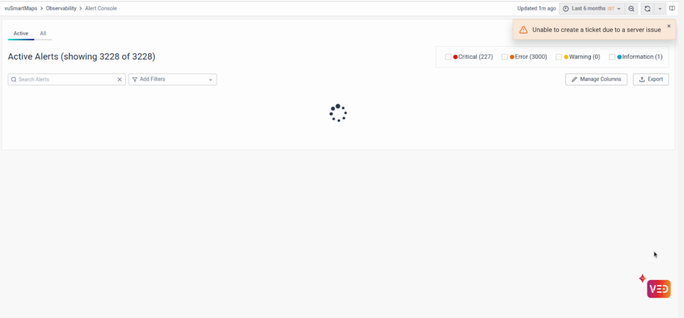
Select the Create New Ticket icon to initiate ticket creation in the Configured ITSM tool. A toast message will appear, indicating that the “Ticket creation is in progress...”.
-
Success: If the ticket is successfully created, a toast message will appear with "Ticket
<number>has been successfully created!".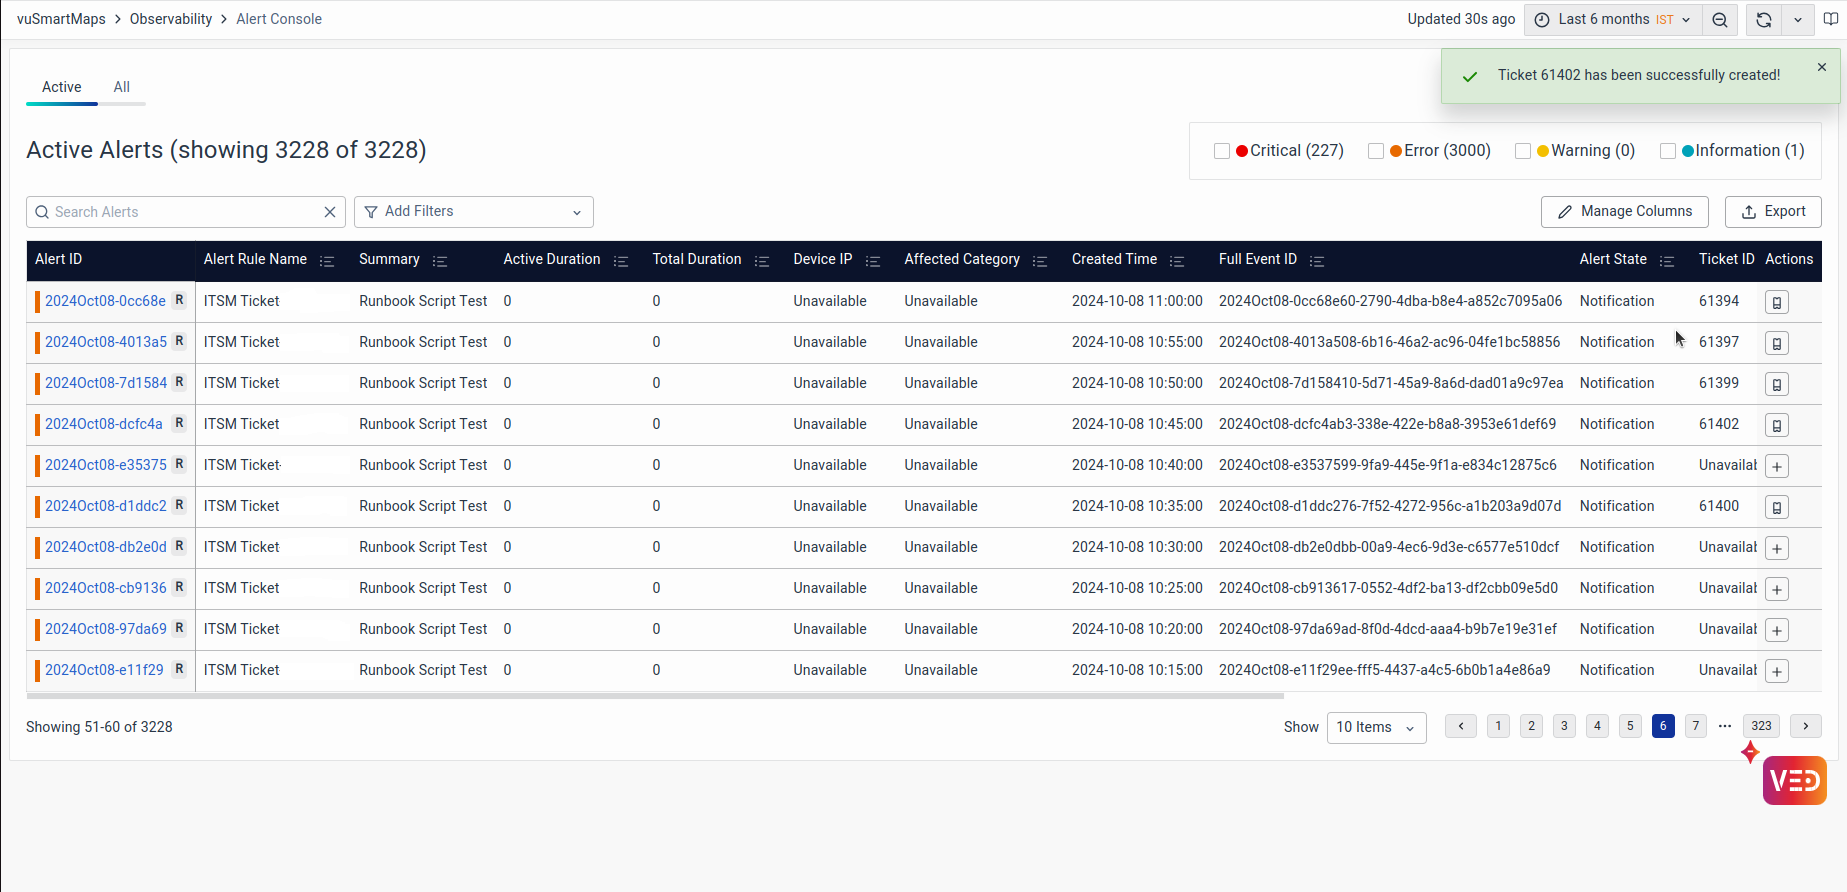
-
Failure: If ticket creation fails, a toast message will display "Unable to create a ticket due to a server issue".
After successful ticket creation, the Create new Ticket icon will automatically update to allow users to View ticket.
Viewing an Existing Ticket:
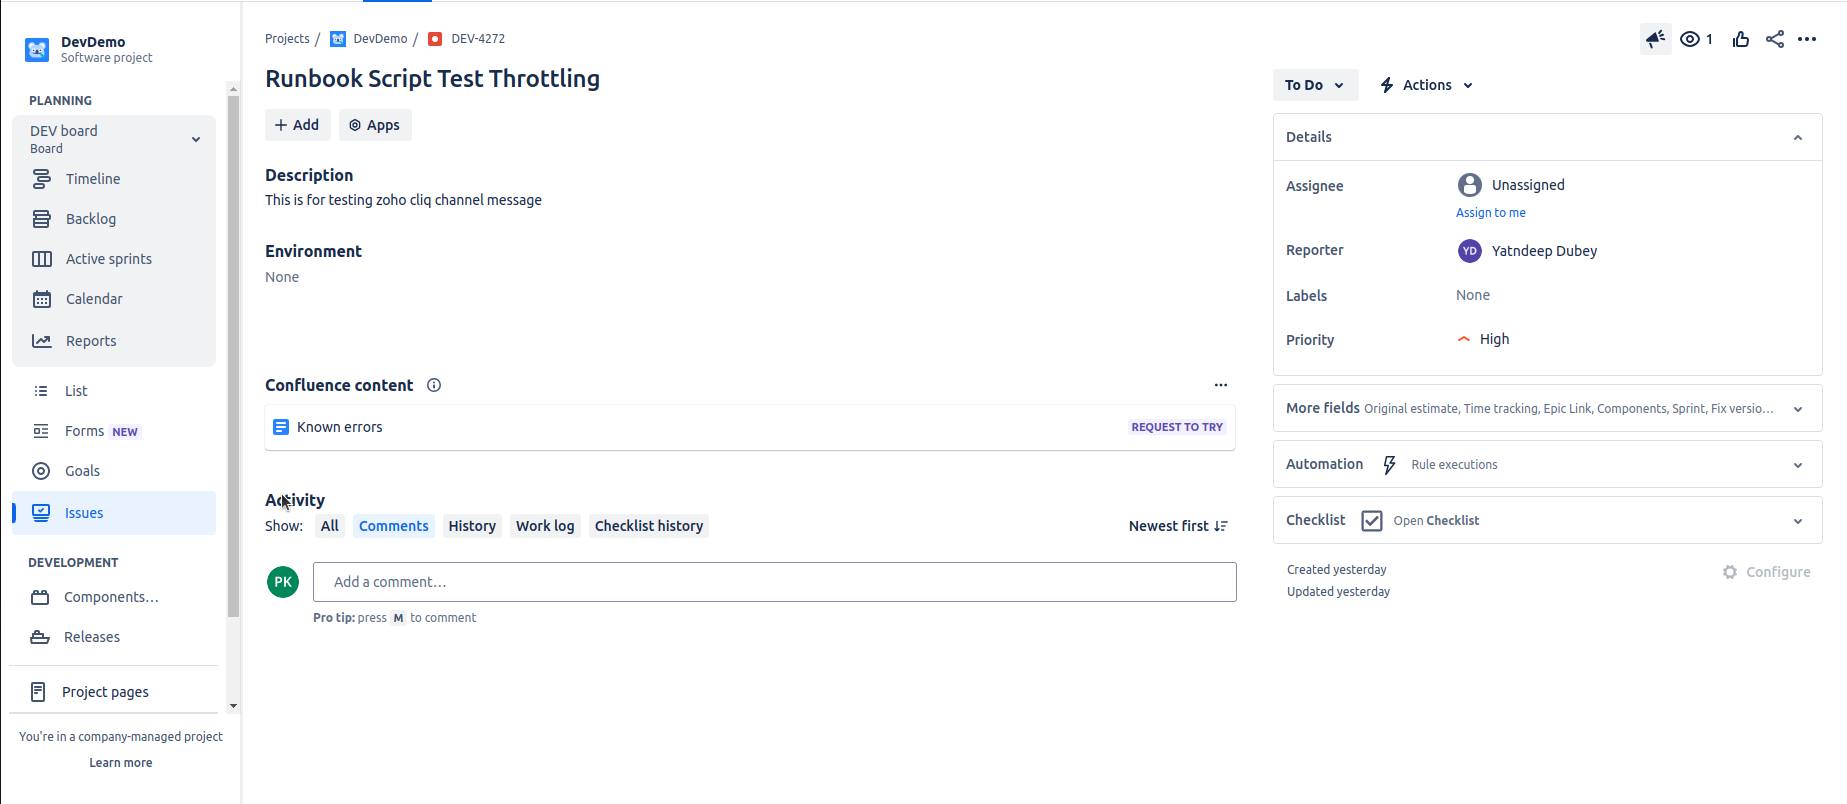
Select the View Ticket Icon to open the ticket in the Configured ITSM Tool in a new tab, allowing direct access to view the ticket details. You can review the full details of the ticket, including status, history, and any updates, directly from the ITSM tool interface.
Example:

-
When attempting to create or view a ticket without proper ITSM configuration, you will receive a toggle message and error response stating, "Please configure your ITSM tool to create a ticket."
-
Ensure that the ITSM tool is configured correctly in the Preference Section to proceed with ticket creation.
Alerts Based on Severity
The Alert Console page provides widgets summarizing Alerts categorized by their severity.

These widgets offer the following insights: The total count of Alerts grouped by severities:
- Critical: Displays all the critical Alerts.
- Error: Displays all error Alerts.
- Warning: Displays all warning Alerts.
- Information: Displays all information Alerts.
Filters
To filter the Alert Console for a specific severity, like Error, click the Error widget. Click the Error widget again to remove the filter and see all Alerts.
You can apply multiple filters in the Alert Console by clicking on multiple widgets. For example, to view both Error and Warning Alerts, click on both Error and Warning widgets, and the page will filter accordingly.
Operations on the Listed Alerts
Within the Alert Listing table, you have several operations at your disposal:
-
Search: Utilize the search bar to find specific Alerts that match your search string.
-
Sort: You can arrange the Alerts list in ascending or descending order by clicking on the sort button next to the field headers. Multi-level sorting is supported by up to 3 field headers.
- Filter: Filter the Alert list based on filter options accessible under the filter button. Selected filters will be displayed at the top, and you can choose their values.
Configurations
On the Alert Console page, you can tailor the view to your specific needs by configuring the following:
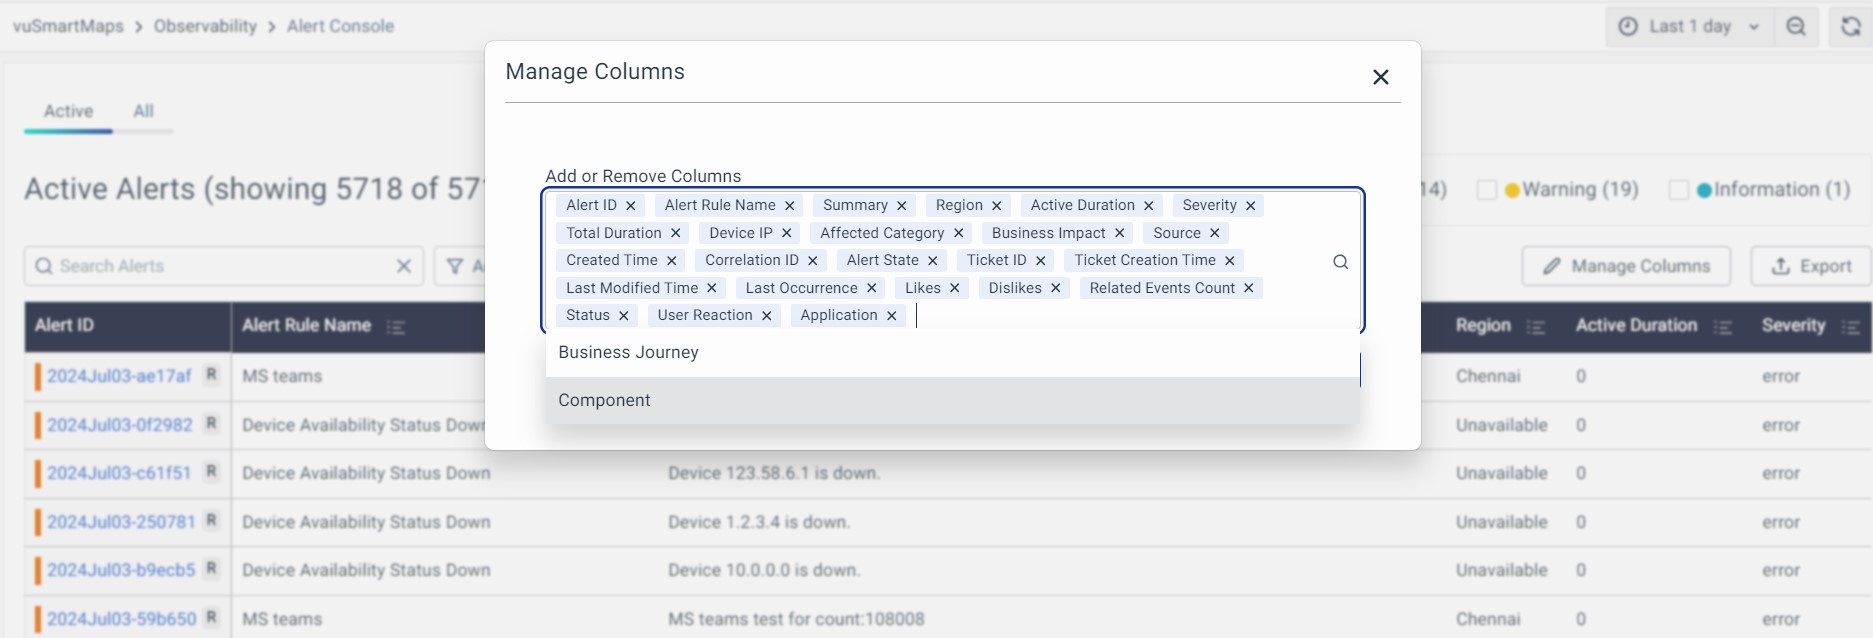
- Manage Columns: Click the Manage Columns button on the right side of the table. A dialog box will appear with a list of available fields for the Alert summary. Select the fields you want to see and save your configuration. Your chosen fields will remain the same each time you log in. Disabled fields are listed at the bottom in the "Manage Columns" dropdown as shown below.
- Export: Click the Export button on the right side of the Alert listing table next to the “Manage Columns” button and a CSV file will be exported and saved to your device. The columns that are displayed in the table will be exported. You can add or remove fields before exporting as explained in the Manage Columns section.
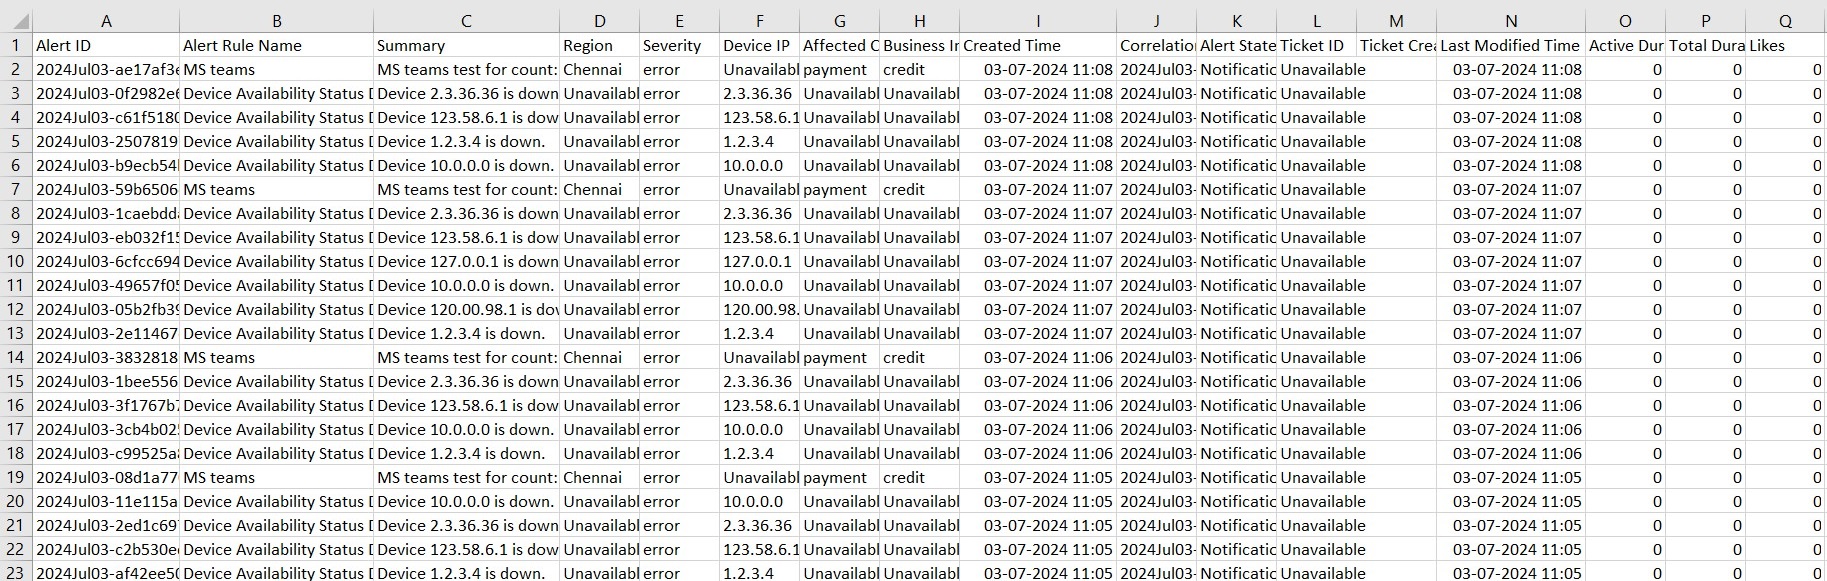
Sample CSV file:
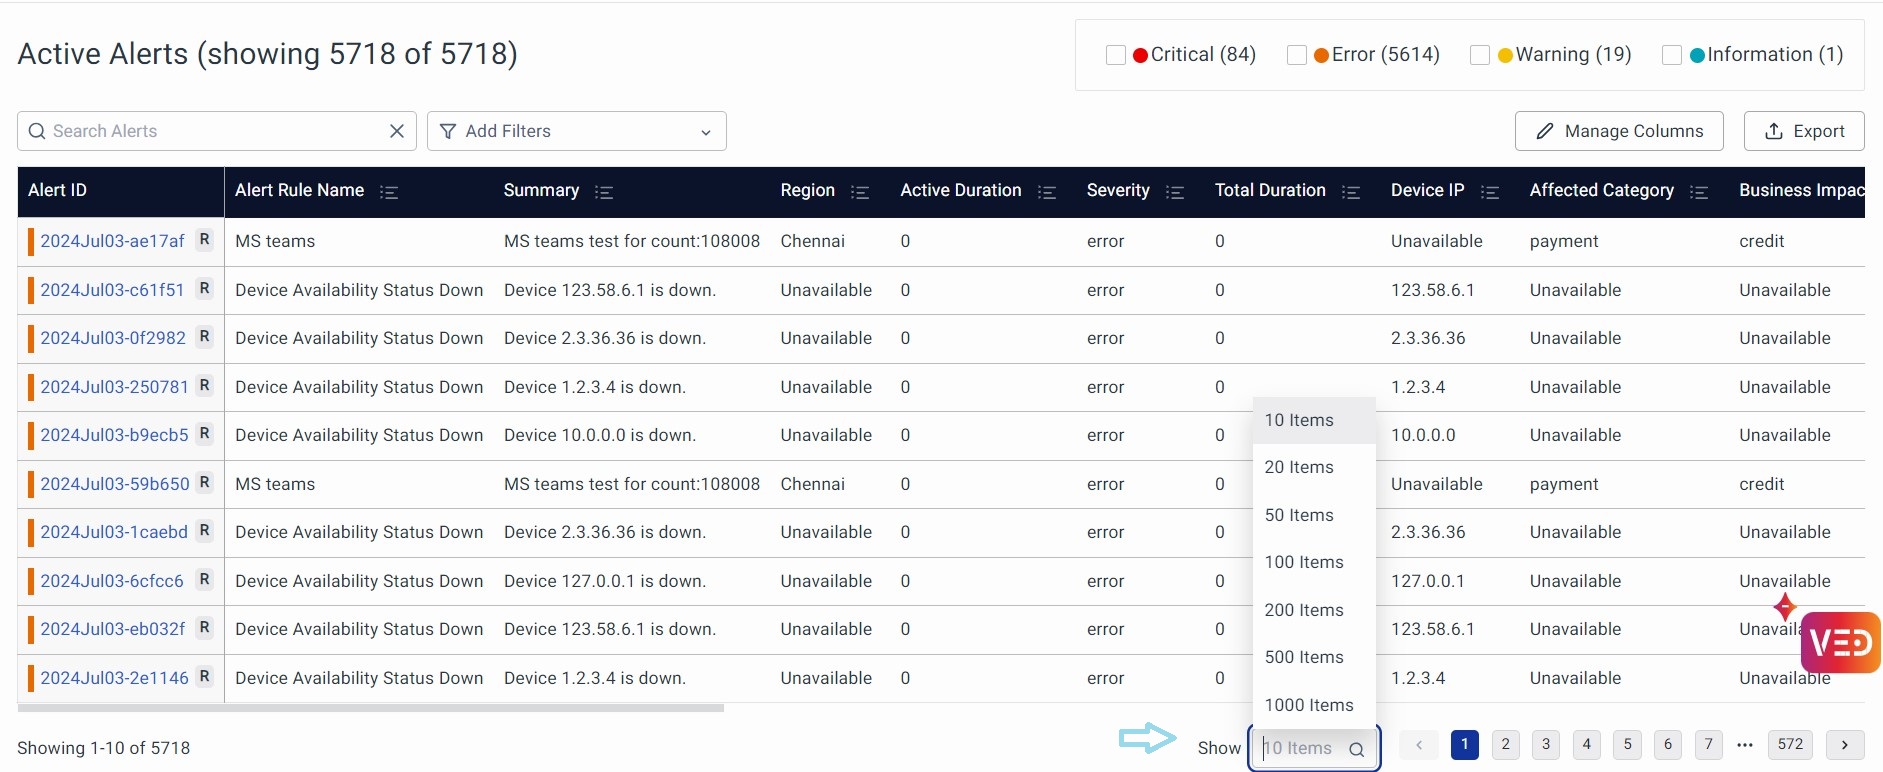
- Adjust Alerts Display: You can use the dropdown selector at the bottom right of the page to choose the number of Alerts to display in the listing table.