O11ySources
Introduction
Welcome to the O11ySources User Guide! This guide is your essential resource for mastering Observability Sources (referred to as O11ySources hereafter) within the vuSmartMapsTM platform. With O11ySources, you can effortlessly set up data sources, storyboards, and alert rules, streamlining your data pipeline and ETL process.
In today's tech-driven world, O11ySources serves as your gateway to understanding your system's performance, providing actionable insights into various critical aspects. O11ySources allows you to monitor a wide array of essential data sources, such as databases, network devices, applications, web servers, and more.
By collecting and analyzing data from these sources, O11ySources empowers you to optimize the performance of your systems. For example, it helps you track the response times of your applications, ensuring they run smoothly and efficiently. It also enables you to monitor server resource utilization, identifying potential bottlenecks that may impact your system's responsiveness.
Whether you're evaluating the health of your servers, tracking network performance, analyzing application behavior, or diving into the performance of your database queries, O11ySources provides you with the specific tools and insights needed to ensure the efficiency and effectiveness of the systems.
Data Onboarding with O11ySources
O11ySources, such as 'Linux Monitor' and 'Apache', seamlessly integrate with your existing setup. They consolidate data from multiple sources, creating a unified data flow that empowers your analysis and reporting systems. This integration streamlines data onboarding from target systems to enhance business observability with vuSmartMaps.
Data Flow Journey
Explore how data flows within the system by examining the key stages of the data journey:
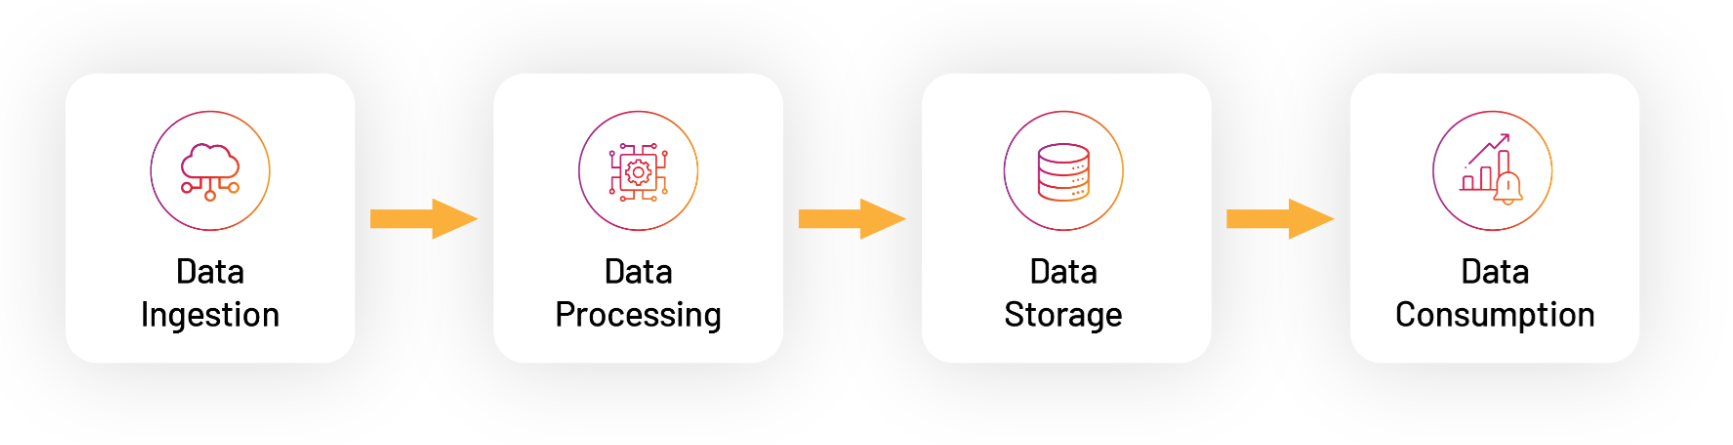
- Data Ingestion: Agents like Healtheat, Logbeat, and Telegraf collect data from various sources using mechanisms like push or pull.
- Data Processing: The data undergoes transformations and enrichments, gaining context and domain knowledge. This phase involves components like I/O streams and pipelines, ensuring efficient data processing.
- Data Storage: The processed data finds its home in stores like Elasticsearch (ES), TSDB, or other databases. These data stores form the basis for user functionalities such as alerts and dashboards, providing actionable insights.
- Data Consumption: The final stage is where the processed data is utilized through visualizations, dashboards, alerts, and reports. This is where users interact with the data, deriving meaningful insights, making informed decisions, and taking necessary actions based on real-time data analysis and historical trends.
To fully utilize the O11ySource framework, your journey starts with configuring data sources by enabling O11ySources. This guide will be your trusted companion, guiding you through these essential steps. As you delve deeper, you'll gain a profound understanding of the vital components that keep your data flowing smoothly within your system.
Working with O11ySources
Accessing and managing O11ySources in vuSmartMaps is a simple process. Here's how you can do it:
- vuSmartMaps O11ySources can be accessed by navigating from the left navigation menu (Data Ingestion > O11ySources).
- You will be directed to the O11ySources page, displaying a complete list of available O11ySources.
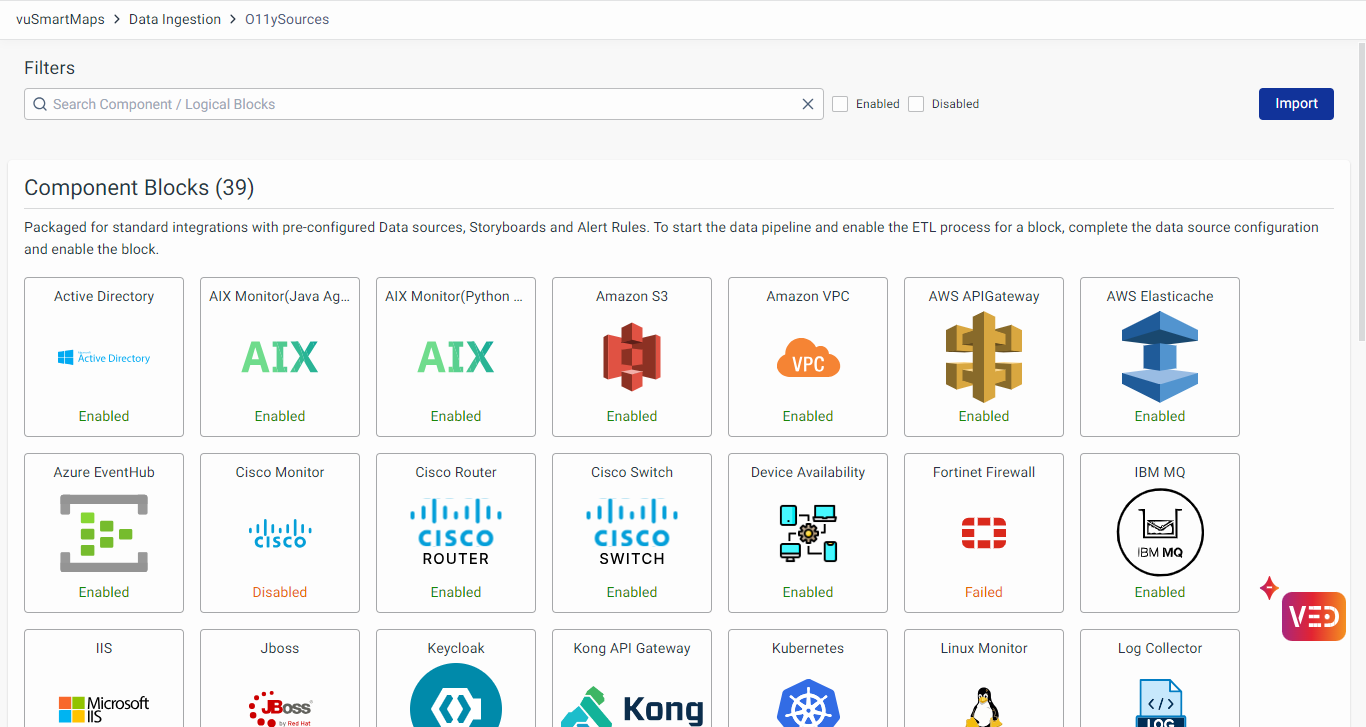
- Use the checkbox (Enabled/ Disabled) to filter the list, showing only enabled/ disabled O11ySources.
- By default, all O11ySources are disabled initially.
- Click on the O11ySource name you want to configure, such as "Apache."
- Click the Enable button for the desired O11ySource. For example, we enable Apache as below:
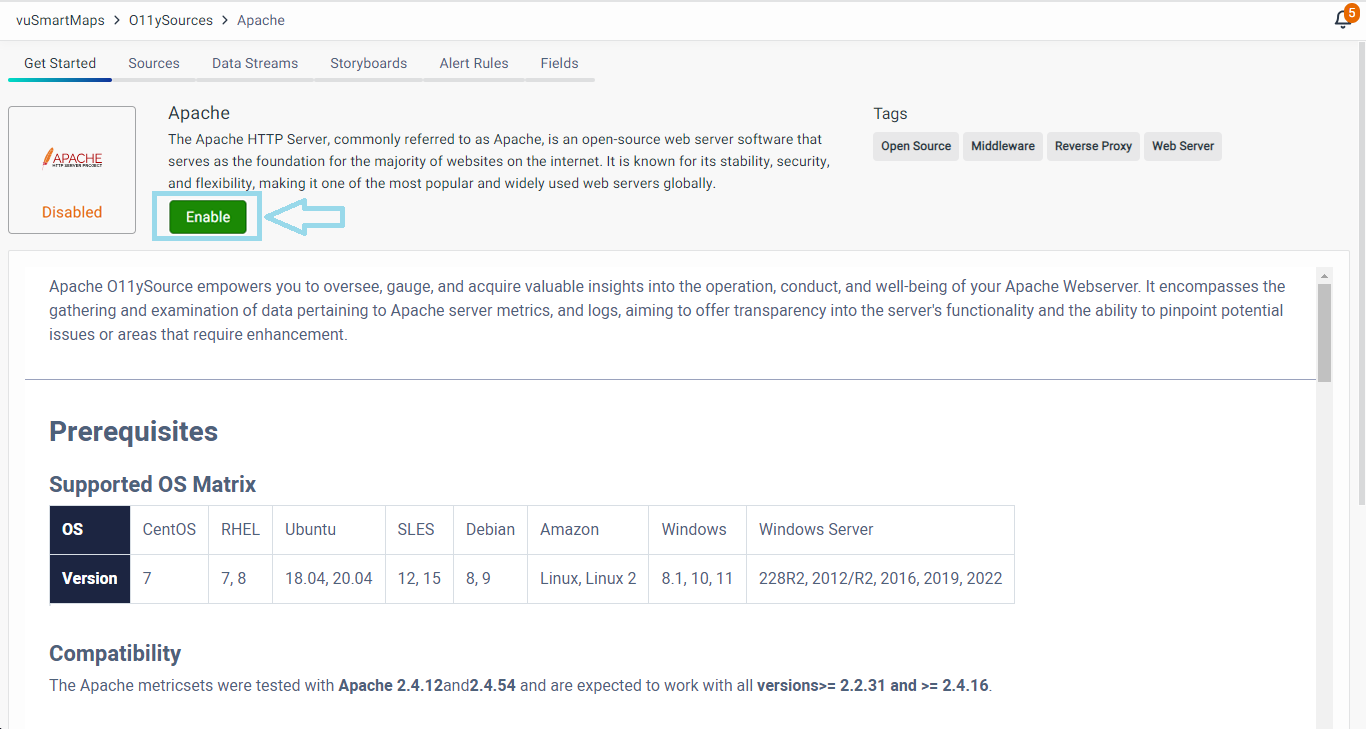
When O11ySources is enabled, it shows the Alert Rules and Storyboards linked to the displayed sources. If it is disabled, it hides them. Ensure that you've followed all the instructions in the Get Started section to enable data onboarding for seamless operations.
Importing O11ySources
The "Import O11ySources" feature allows users to upload new O11ySources or upgrade existing ones via a tar.gz file. This feature streamlines integrating new O11ySources or enhancing current ones, ensuring your observability framework remains up-to-date.
- Access the Import Feature: Navigate to the O11ySources landing page, and click the Import button.
- Upload the O11ySource File:
- A dialog box will appear prompting you to upload a tar.gz file.
- Select the tar.gz file of the O11ySource you wish to import (maximum file size: 0.29 MB).
- The Upload button will be enabled once a valid file is selected.
- Import Process:
- Click the Upload button to initiate the import.
- If the uploaded file is a new O11ySource, it will be added in a disabled state.
- If the file corresponds to an existing O11ySource, the current state (enabled/disabled) will be retained, and the upgrades will be applied.
- New O11ySource: Upon import, new O11ySources will be added in a disabled state. You need to enable them manually after ensuring all configurations are correctly set.
- Existing O11ySource: If importing an upgrade for an existing O11ySource, it will retain its current state (enabled or disabled).
- Sources Configuration Changes: If the upgrade involves changes in the Source configuration, the import may fail due to potential backward incompatibilities. In such cases, contact the VuNet support team to confirm whether the upgrade can be performed using the import button. If not, the upgrade will be done through a product release update.
Navigating through O11ySources
Each O11ySource comprises the following sections:
- Get Started
This section provides specific details about the O11ySource and guides you through the process of configuring it and initiating data onboarding from your system into vuSmartMaps. Follow these instructions to kickstart the setup of your O11ySource and establish a seamless data flow. - Sources
Discover and manage data sources linked to the O11ySource. Configure various data collection methods and even connect to other O11ySources. This tab is enabled with O11ySources Diagnostics for streamlined configuration and troubleshooting, allowing you to improve data visualization and decision-making. Observe source status with color-coded indicators and diagnostics. - ContextStreams
This section offers a visual representation of data flow within an O11ySource, illustrating the journey of data through input streams, pipelines, output streams, enrichments, and connectors. It empowers users to troubleshoot issues, optimize performance, and gain insights into the data processing pipeline, enhancing overall system efficiency. - Storyboards
Explore and manage a collection of storyboards related to the O11ySource. These dashboards offer insightful visualizations for comprehensive data analysis. Filters can be applied to share dashboards across multiple O11ySources, enhancing your data analysis by tailoring the displayed information to your specific needs. This flexibility allows you to fine-tune your dashboards, providing a more contextually rich view of your data. - Alert Rules
Organize and maintain alert rules for effective real-time monitoring. This section offers a structured approach to configure and manage alerts, ensuring proactive issue resolution and system stability. Aligns with the concept of Storyboards for streamlined project management. - Fields
Access a comprehensive list of fields captured by the O11ySource, providing valuable insights into the available data and facilitating in-depth analysis and customization.
Each of these sections plays a crucial role in configuring and managing your O11ySource effectively. Follow along with this guide to harness the full potential of O11ySources and gain valuable observability into your systems.
O11ySources Diagnostics
Welcome to the O11ySources Diagnostics feature, a powerful addition to the O11ySources framework. This feature empowers you with the ability to seamlessly configure your O11ySources integration while effortlessly diagnosing potential data-related issues. By gaining insights into the data collection process, you'll be equipped to enhance data visualization and decision-making.
As an end user with the privilege to configure sources for O11ySources integration, the O11ySources Diagnostics feature is designed to offer you an intuitive configuration process coupled with swift troubleshooting capabilities. This empowers you to not only set up your data sources seamlessly but also to swiftly identify and resolve any data-related challenges. Ultimately, this feature enhances your control over data and enriches your user experience.
Purpose and User Benefits
The O11ySources Diagnostics feature serves the following purposes and brings corresponding benefits to users:
- Root Cause Identification: Understand configuration issues hindering data collection.
- Time-Saving: Swift diagnostics pinpoint the stage of data loss.
- Simplified Experience: Minimal technical knowledge required for efficient use.
- Visual Clarity: Simple UI showcases data transfer status at each stage.
- Proactive Issue Resolution: Clear insights lead to faster troubleshooting.
Performance and Scalability
The O11ySources Diagnostics feature effortlessly handles multiple diagnostics instances, ensuring minimal interference with other O11ySources. Even when dealing with an extensive number of data sources (~1000) and multiple agents, this feature continues to function robustly.
Understanding the Need for O11ySources Diagnostics
O11ySources simplifies source configuration but can pose challenges when data doesn't appear as expected on dashboards. This complexity arises from the intricate data flow journey involving data ingestion, processing, and storage. Users often struggle to diagnose issues due to this complexity.
O11ySources Diagnostics steps in to bridge this gap, helping users understand the journey and troubleshoot effectively. This feature offers insights into the intricate data flow, making it easier to identify and resolve data-related issues. It ensures smoother operations and reliable data visualization, enhancing overall system efficiency.
This feature is an initial release of O11ySources Diagnostics, focusing on data presence in specific stages. Service and connection status information will be incorporated in subsequent phases.
