ContextStreams Dashboard
ContextStreams Dashboard
The ContextStreams monitoring dashboard gives an overall view of the health of the ContextStream pipelines running in the system. It provides an overview of all the ContextStreams applications and a detailed view of the application-wise metrics to help pinpoint the source of an issue, if any.
It provides various information like the number of applications and instances running or failing, CPU and memory usage by each application, the latency and lag of polling from or committing to Kafka, the total number of records processed or dropped, and the count of exceptions encountered.
The ContextStreams monitoring dashboard provides a crucial tool for solutioning engineers to troubleshoot and maintain the health of the ContextStream pipelines within the system. It offers an overarching view of all ContextStreams applications and delves into detailed application-specific metrics to facilitate the identification and resolution of potential issues.
Accessing ContextStreams Dashboard
To access the ContextStreams Dashboard:
- Navigate to the left navigation menu and click on Dashboards.
- Run a search for the ContextStreams Dashboard.
- Click on the ContextStreams Dashboard to access it.
Dashboard’s Panels
The ContextStreams Dashboard is divided into the following sections:
- Stream Apps Overview
Gain insights into the health of ContextStream pipelines with metrics on running and failed applications, exceptions, and latency, facilitating quick identification of potential issues. - Resource Usage Metrics
Monitor memory and CPU usage per instance to ensure efficient resource allocation and detect abnormalities, aiding in proactive resource management and optimization. - Stream Metrics
Track processed records, poll rates, and latency to assess data processing efficiency, while monitoring running app instances for insights into pipeline health and performance. - Plugin Metrics
Dive into plugin-level metrics to pinpoint bottlenecks and errors within the processing pipeline, with detailed insights into exception counts and record processing efficiency. - Consumer Metrics
Monitor consumer lag and consumption rates to ensure timely data ingestion and processing, with visualizations of fetch rates and records consumed aiding in performance optimization. - JVM Metrics
Keep an eye on JVM health with metrics on heap memory usage and garbage collection times, enabling proactive management to prevent performance degradation and outages.
At the top of the dashboard, you can apply filters to select specific App IDs and Instance IDs. These filters allow you to focus on particular ContextStream pipelines or instances, aiding in targeted analysis and troubleshooting.
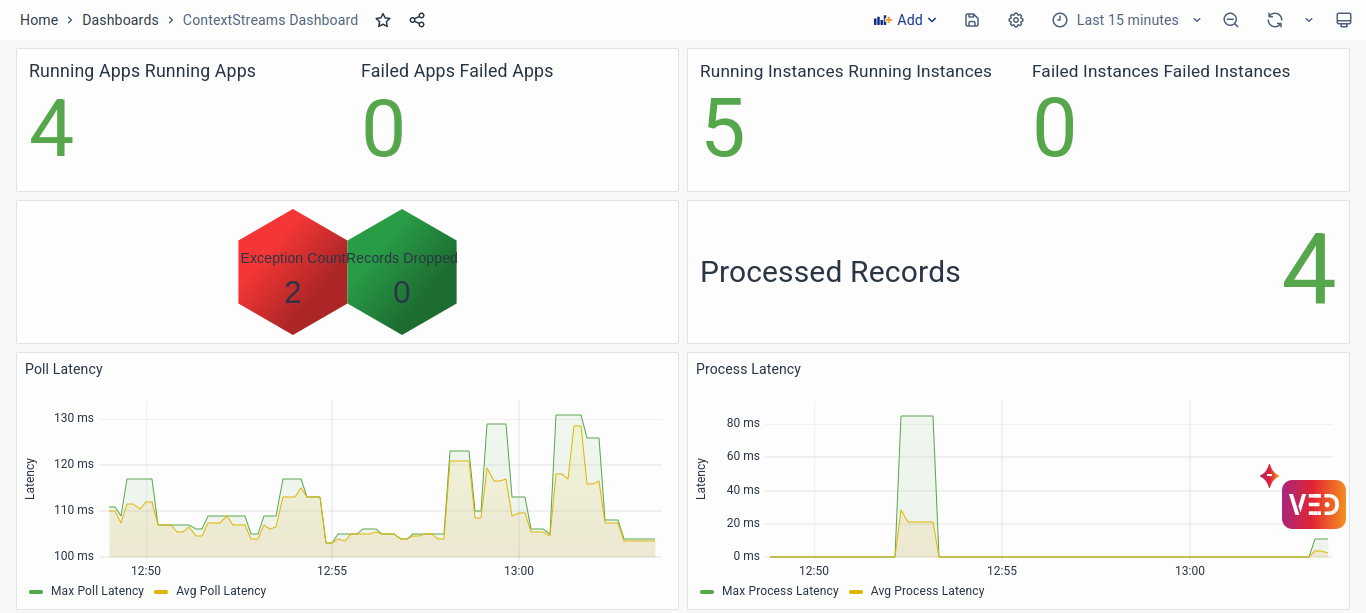
Stream Apps Overview
This section gives an overview of the comprehensive ContextStreams architecture.
- Running Apps and Instances: Monitoring the number of running and failed applications and instances provides immediate visibility into any potential system-wide issues. An unexpected drop in the number of running apps or instances could indicate failures or bottlenecks within the system. Details of the Failed Apps and Instances can be checked from the Stream Metrics section.
- Exception Count and Record Metrics: Tracking exceptions and the number of dropped records helps pinpoint specific areas of concern within the pipeline. A sudden increase in exception counts or dropped records may indicate issues with data integrity, processing logic, or resource constraints. Plugin-wise Exception details can be found in the Plugin Metrics section.
- Latency Visualization: Visualizing poll and process latency allows engineers to identify any delays in data processing. High latency values may indicate performance bottlenecks, network issues, or resource contention, enabling engineers to prioritize troubleshooting efforts accordingly. Poll latency represents the time taken for the pipeline to retrieve records from Kafka, while process latency represents the time taken to process these records.
Resource Usage Metrics
This section gives an overview of the Memory and CPU usage per instance of the selected Stream App.
- Memory and CPU Usage: Monitoring memory and CPU usage per instance provides insights into resource utilization patterns. Spikes or sustained high usage levels may indicate memory leaks, inefficient processing logic, or inadequate resource allocation, prompting further investigation and optimization.
- Time Series Visualization: Analyzing trends in memory and CPU usage over time enables engineers to detect gradual increases or sudden spikes, facilitating proactive resource management and capacity planning to prevent performance degradation or outages.
Stream Metrics
- Processed Records and Polls: Tracking the number of processed records and polling activities helps gauge the efficiency of data ingestion and processing. Discrepancies between expected and actual processing rates may signal issues with data availability, processing logic, or resource constraints.
- Running App Instances: Monitoring the status of running app instances provides insights into the health and availability of individual pipelines. Instances experiencing errors or failures may require immediate attention to prevent data loss or service disruptions.
- Latency and Rate Visualization: Visualizing end-to-end latency, poll rates, process rates, and commit latency enables engineers to identify performance bottlenecks and optimize data processing workflows. Deviations from expected latency or throughput levels may indicate underlying issues requiring investigation and remediation.
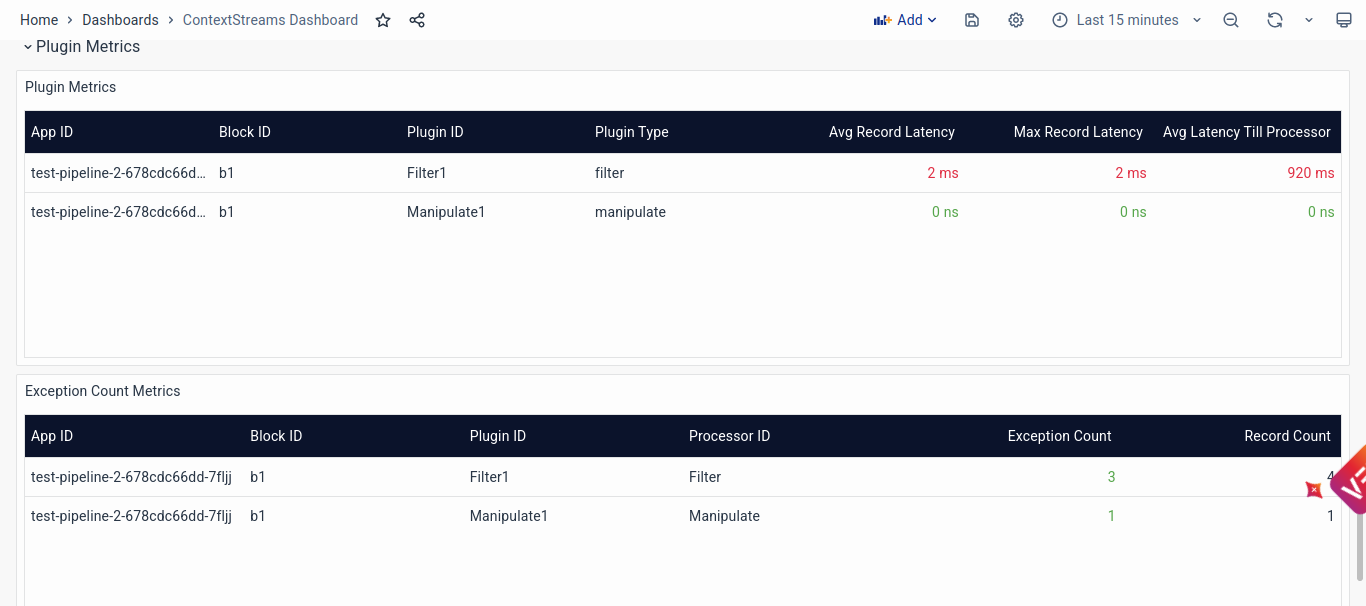
Plugin Metrics
- Plugin-Level Monitoring: Monitoring plugin metrics allows engineers to pinpoint specific components or stages within the data processing pipeline experiencing performance issues or errors. Identifying plugins with high latency, exception counts, or dropped records helps prioritize troubleshooting efforts and optimize processing logic.
- Exception Counts and Record Metrics: Tracking exception counts and record processing metrics at the plugin level provides granular insights into the health and efficiency of individual processing stages. Anomalies or discrepancies in exception counts or record processing rates may indicate plugin-specific issues requiring targeted investigation and resolution.
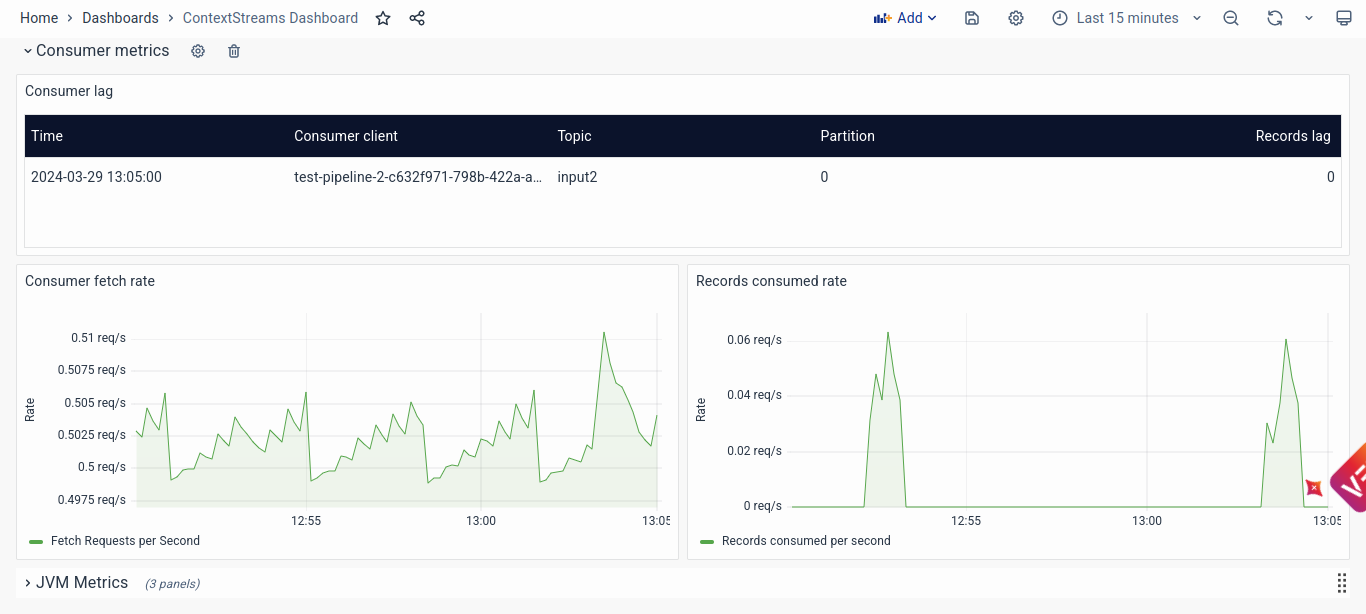
Consumer Metrics
- Consumer Lag and Consumption Rates: Monitoring consumer lag and consumption rates helps ensure timely data ingestion and processing. Detecting spikes in consumer lag or fluctuations in consumption rates allows engineers to identify potential bottlenecks, resource constraints, or data availability issues impacting pipeline performance.
- Fetch and Consumption Rate Visualization: Visualizing fetch rates and records consumed rates over time enables engineers to assess the efficiency of data retrieval and consumption processes. Deviations from expected fetch or consumption rates may indicate network issues, resource contention, or inefficient data processing workflows requiring optimization.
JVM Metrics
- Heap Memory Usage and Garbage Collection: Monitoring JVM metrics such as heap memory usage and garbage collection times (Young and Old) helps ensure optimal resource utilization and stability. Sudden increases in memory usage or prolonged garbage collection times may indicate memory leaks, inefficient resource management, or garbage collection tuning issues requiring attention and optimization.
- Visualization of JVM Metrics: Visualizing JVM metrics over time enables engineers to detect trends, anomalies, or patterns indicative of underlying issues impacting system performance and stability. Proactively monitoring and analyzing JVM metrics facilitates timely intervention and optimization to prevent performance degradation or outages.
Conclusion
In conclusion, the ContextStreams Dashboard serves as a comprehensive tool for the Solution Engineers to effectively monitor, troubleshoot, and optimize ContextStream pipelines within the system. By providing detailed insights into application health, resource usage, data processing metrics, plugin performance, consumer behavior, and JVM health, this dashboard equips engineers with the necessary visibility and understanding to swiftly identify and address any issues that may arise. With its user-friendly interface and rich visualizations, the ContextStreams Dashboard empowers engineers to proactively manage system performance, ensure data integrity, and maintain the reliability of ContextStream pipelines, ultimately contributing to the seamless operation of the platform.
Kafka Cluster Monitoring
The Kafka Cluster Monitoring dashboard gives an overview of the Kafka Cluster service running for vuSmartMaps. The majority of data streaming and processing depends on the smooth functioning of the Kafka cluster, hence this dashboard provides a detailed view of the performance and functionality of the cluster. It shows information about the CPU, disk, and memory utilization, and data metrics like the rate of data being read and written to Kafka.
Accessing Kafka Cluster Monitoring Dashboard
To access the Kafka Cluster Monitoring Dashboard:
- Navigate to the left navigation menu and click on Dashboards.
- Run a search for the Kafka Cluster Monitoring Dashboard.
- Click on the Kafka Cluster Monitoring Dashboard to access it.
Dashboard’s Panels
The Kafka Cluster Monitoring Dashboard is divided into the following sections:
- Kafka Emitted Metrics
The Kafka Emitted Metrics section provides essential information on various Kafka metrics emitted by the cluster, including replication status, request processing rates, and data transfer rates. End-users can monitor these metrics to assess the overall health and functionality of the Kafka cluster, enabling timely detection and resolution of potential issues impacting data streaming and processing operations. - Host Level Metrics
The Host Level Metrics section provides a detailed overview of individual Kafka cluster nodes, offering insights into memory usage, CPU utilization, disk space, and network activity. End-users can monitor these metrics to identify potential resource constraints or performance bottlenecks at the host level, enabling proactive management and optimization of Kafka cluster nodes. - JVM Metrics
The JVM Metrics section offers critical insights into the performance and behavior of Java Virtual Machine instances running on Kafka cluster nodes. End-users can monitor heap and non-heap memory usage, garbage collection times, and CPU utilization to ensure optimal JVM resource utilization and stability.
At the top of the dashboard, you can apply filters to select specific hostname and Brokers. These filters allow you to focus on particular pipeline clusters or brokers, aiding in targeted analysis and troubleshooting.
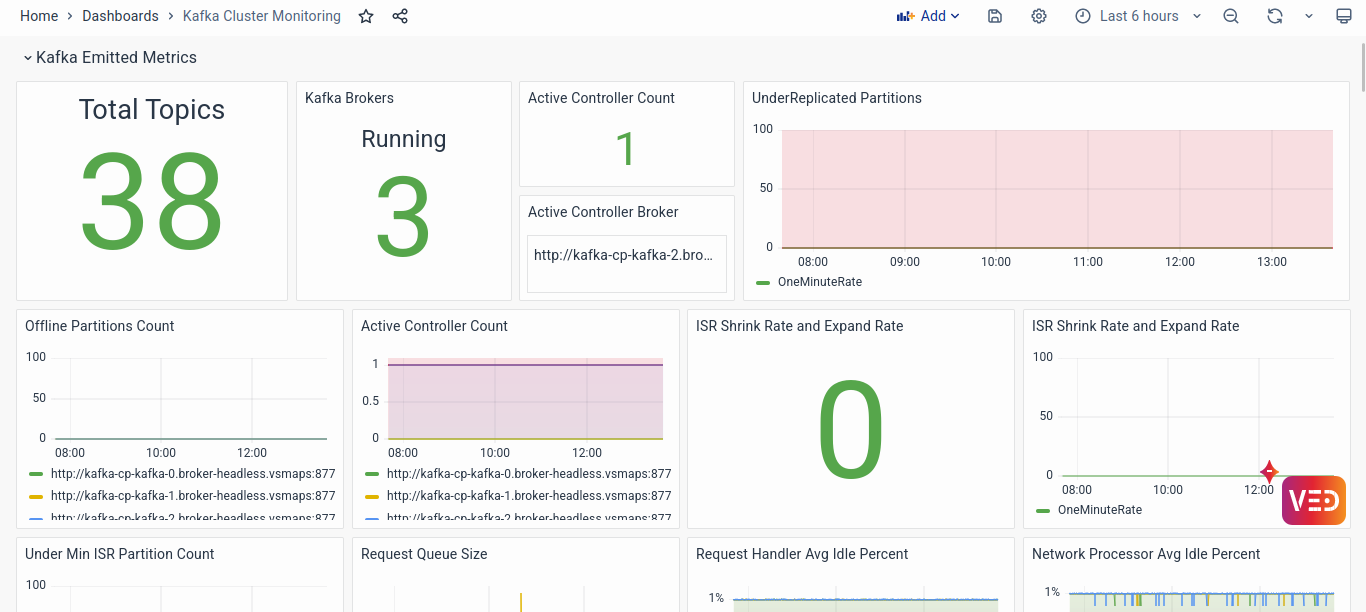
Kafka Emitted Metrics
This section of the dashboard provides a detailed insight into various metrics emitted by the Kafka cluster, offering crucial information for analysis and diagnosis:
- Number of Total Topics, Kafka Brokers, Active Controller Count, and Active Controller Broker List: Understanding the distribution of topics, brokers, and the active controller count is essential for assessing the overall health and functionality of the Kafka cluster. The active controller count should ideally be 1, indicating a properly configured cluster. Any deviation from this could signify configuration issues or potential problems with cluster management.
- Under Replicated Partitions, Offline Partitions Count, and Active Controller Count: Visualizations of under-replicated partitions and offline partitions count provide insights into replication and availability issues within the cluster. An increase in under-replicated partitions may indicate broker unresponsiveness or performance degradation, while offline partition count highlights potential cluster-wide availability issues.
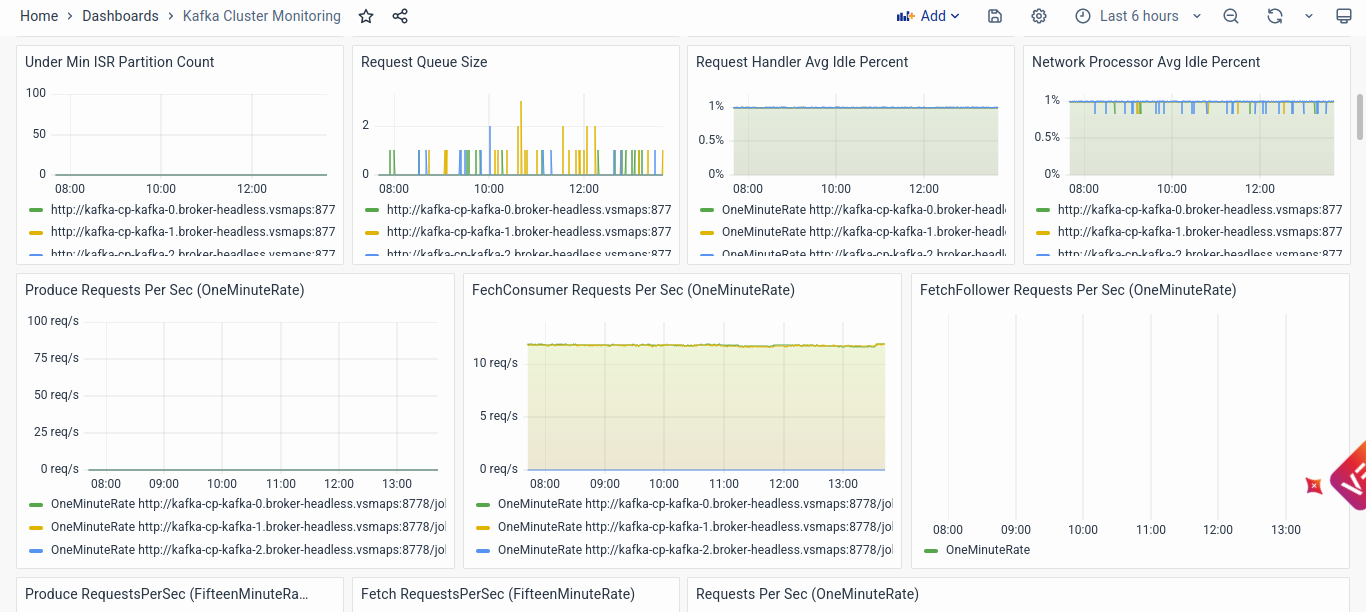
- ISR Shrink Rate and Expand Rate, Under Min ISR Partition Count: Monitoring in-sync replicas (ISR) and their synchronization rates is critical for ensuring data consistency and availability. Changes in ISR shrink and expand rates reflect fluctuations in replica synchronization, which can occur during broker failures or network disruptions. The under-min ISR partition count graph identifies partitions where replicas are out of sync, indicating potential data consistency issues.
- Request Queue Size, Request Handler Idle Percent, and Network Processor Idle Percent: Analyzing request queue size and handler idle percentages provides insights into broker processing efficiency and network utilization. High request queue sizes or idle percentages may indicate processing bottlenecks or network congestion, impacting Kafka's performance and responsiveness.
- Produce Requests Per Sec, Fetch Consumer Requests Per Sec, Fetch Follower Requests Per Sec: Monitoring request rates from producers, consumers, and followers help ensure efficient communication and data transfer within the cluster. Deviations from expected request rates may indicate imbalances in producer-consumer dynamics or potential scalability issues.
- Failed Produce and Fetch Requests Per Sec: Visualizing failed produce and fetch requests per second enables detection of potential issues such as network errors, broker unavailability, or resource constraints impacting request processing.
- Total Time in ms for Fetch Consumer, Fetch Follower, and Produce: Analyzing request processing times across percentiles provides insights into request latency and performance variability. Spike or prolonged high-percentile processing times may indicate processing bottlenecks or resource contention requiring optimization.
- Bytes In and Bytes Out Per Second: Monitoring data transfer rates enables assessment of network throughput and data ingestion/egress efficiency. Fluctuations in data transfer rates may indicate network congestion, resource limitations, or data processing bottlenecks impacting Kafka's performance.
- Messages In Per Second by Topic: Visualizing message ingestion rates by topic helps identify topic-specific data ingestion patterns and potential performance anomalies. Deviations from expected message ingestion rates may indicate issues with data producers, consumers, or topic configurations.
- Purgatory Size for Fetch and Produce: Tracking purgatory size provides insights into the number of requests awaiting processing within the Kafka broker. An increase in purgatory size may indicate processing bottlenecks or resource constraints impacting request servicing and overall cluster performance.
By leveraging the detailed insights provided by these Kafka-emitted metrics, end-users can effectively analyze and diagnose potential issues within the Kafka cluster, ensuring optimal performance, reliability, and data integrity for vuSmartMaps data streaming and processing operations.
Host Level Metrics
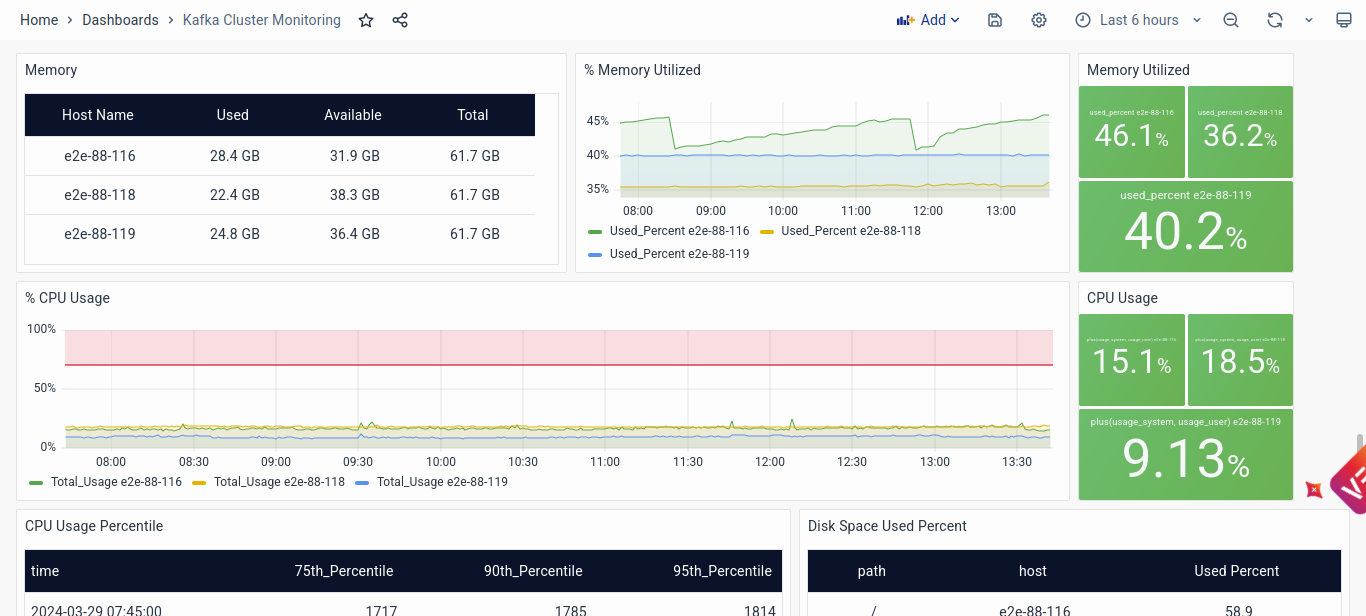
The Host Level Metrics section of the dashboard offers crucial insights into the performance and health of individual Kafka cluster nodes, enabling end-users to analyze and diagnose potential issues at the host level:
- Memory Usage: Monitoring memory usage metrics allows end-users to assess resource utilization and identify potential memory-related issues such as memory leaks or inadequate resource allocation. Visualizations of memory utilization over time help detect trends and abnormalities, facilitating proactive resource management and optimization.
- CPU Usage: Analysis of CPU usage metrics provides insights into processing load and resource utilization on individual host machines. High CPU usage percentages may indicate processing bottlenecks or resource contention, prompting further investigation and optimization to ensure optimal performance.
- Disk Space: Monitoring disk space usage enables end-users to ensure sufficient storage capacity and detect potential issues such as disk space constraints that could impact Kafka's operation. Visualizations of disk space utilization over time help identify trends and predict potential storage shortages, allowing for proactive capacity planning and management.
- Network: Analyzing network metrics provides insights into network throughput and communication efficiency between Kafka cluster nodes. Visualizations of bytes received and sent per second, along with detailed tables showing network interface metrics, help detect anomalies such as packet loss or network congestion, facilitating troubleshooting and optimization of network performance.
By leveraging the insights provided by the Host Level Metrics section, end-users can effectively monitor individual host performance and identify potential issues impacting Kafka cluster operation, ensuring optimal performance and reliability.
JVM Metrics
The JVM Metrics section of the dashboard offers critical insights into the performance and behavior of the Java Virtual Machine (JVM) instances running on Kafka cluster nodes, enabling end-users to monitor JVM health and diagnose potential issues:
- Heap & Non-heap Memory Usage and Garbage Collection: Monitoring heap and non-heap memory usage, along with garbage collection times (Young and Old), helps ensure optimal JVM resource utilization and stability. Visualizations of memory usage and garbage collection times over time enable end-users to detect trends and anomalies indicative of memory leaks, inefficient resource management, or garbage collection tuning issues requiring attention and optimization.
- Visualization of JVM Metrics: Visualizing JVM metrics such as heap memory usage, garbage collection times, and CPU utilization over time provides end-users with insights into JVM behavior and performance trends. By proactively monitoring and analyzing JVM metrics, end-users can identify and address potential performance bottlenecks or stability issues, ensuring optimal Kafka cluster operation and reliability.
By leveraging the insights provided by the JVM Metrics section, end-users can effectively monitor JVM health, diagnose potential issues, and optimize JVM performance to ensure optimal operation of the Kafka cluster.
Conclusion
In conclusion, the Kafka Cluster Monitoring dashboard serves as a vital tool for solutioning engineers to ensure the optimal performance and reliability of the Kafka cluster underlying vuSmartMaps. By providing detailed insights into key metrics such as host-level resource utilization, JVM health, and Kafka-emitted metrics, this dashboard empowers engineers to proactively identify, analyze, and address potential issues impacting data streaming and processing operations. Through continuous monitoring and analysis of these metrics, engineers can maintain the stability, scalability, and efficiency of the Kafka cluster, thereby contributing to the seamless operation of vuSmartMaps' data infrastructure.
Kafka Connect Monitoring
The Kafka Connect dashboard gives a view of the Kafka Connect cluster running in vuSmartMaps. The Kafka Connect cluster manages the connectors that either source data from different databases into Kafka or sink data from Kafka to other databases. It provides information about different connectors and their status, rate of incoming and outgoing data via the connectors, rate of polling and writing records, CPU and memory utilization by the Connect cluster, and other JVM metrics.
Accessing Kafka Connect Monitoring Dashboard
To access the Kafka Connect Monitoring Dashboard:
- Navigate to the left navigation menu and click on Dashboards.
- Run a search for the Kafka Connect Monitoring Dashboard.
- Click on the Kafka Connect Monitoring Dashboard to access it.
Dashboard’s Panels
The Kafka Connect Monitoring dashboard is divided into the following sections:
- Kafka Connect Metrics
Tracks the total number of connectors, tasks, and failed tasks, along with detailed statuses for active connectors and tasks, facilitating troubleshooting and debugging. - Connector Metrics
Offers insights into data throughput, batch processing efficiency, and source and sink connector performance, aiding in the analysis and optimization of individual connectors. - Kafka Connect Node Metrics
Monitors resource utilization, CPU usage percentiles, and data transfer rates at the node level, enabling identification of resource constraints and performance bottlenecks within the Kafka Connect cluster. - JVM Metrics
Provides critical insights into JVM health and performance, including memory usage, garbage collection times, and CPU utilization, facilitating proactive monitoring and diagnosis of potential issues impacting Kafka Connect operations.
At the top of the dashboard, you can apply filters to select specific connectors, workers, and Nodes. These filters allow you to focus on the particular DataStore connectors, aiding in targeted analysis and troubleshooting.
Kafka Connect Metrics
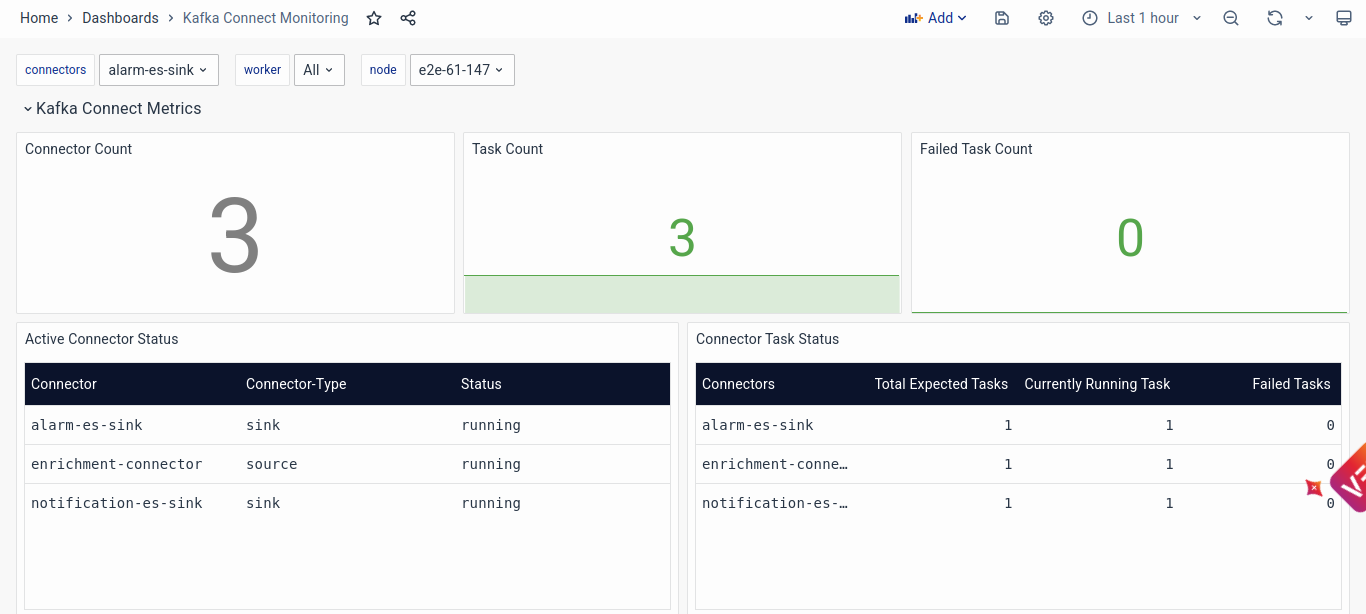
- Connector Count: Indicates the total number of connectors currently active within the Kafka Connect cluster. A sudden decrease or increase in connector count may indicate issues with connector configuration or deployment.
- Task Count: Displays the total number of tasks currently running within the Kafka Connect cluster. Monitoring task count helps ensure that all tasks are executing as expected and identifies any tasks that may have failed or stalled.
- Failed Task Count: This shows the total number of tasks that have failed within the Kafka Connect cluster. Identifying failed tasks is crucial for troubleshooting and resolving issues that may impact data integration and processing.
- Active Connector Status: Presents a detailed overview of active connectors within the Kafka Connect cluster, including their type and current status. Engineers can use this information to troubleshoot specific connectors and address any issues affecting their functionality.
- Connector Task Status: Provides detailed information about the status of tasks associated with each connector, including total expected tasks, currently running tasks, and failed tasks. Monitoring task status helps identify and resolve issues at the task level, ensuring smooth data flow within the Kafka Connect cluster.
Connector Metrics
- Number of Sourced and Sinked Records: Displays the total number of records sourced from and sinked to Kafka by each connector. Monitoring record throughput helps assess connector performance and identify any anomalies or bottlenecks in data flow.
- Batch Size: This shows the average and maximum batch size of records processed by each connector. Monitoring batch size helps optimize data transfer efficiency and identify any issues related to batch processing.
- Source Metrics (Record Poll Rate, Average Batch Poll Time, Record Write Rate): Provides insights into the performance of source connectors, including record poll rate, average batch poll time, and record write rate. Monitoring these metrics helps assess source connector efficiency and identify any issues affecting data ingestion from external systems to Kafka.
- Sink Metrics (Record Read Rate, Record Send Rate, Average Batch Write Timestamp): Offers insights into the performance of sink connectors, including record read rate, record send rate, and average batch write timestamp. Monitoring these metrics helps assess sink connector efficiency and identify any issues affecting data transfer from Kafka to external systems.
Kafka Connect Node Metrics
- Memory and CPU Usage: Displays the maximum and average memory and CPU usage of individual nodes within the Kafka Connect cluster. Monitoring memory and CPU usage helps identify resource constraints and performance bottlenecks at the node level.
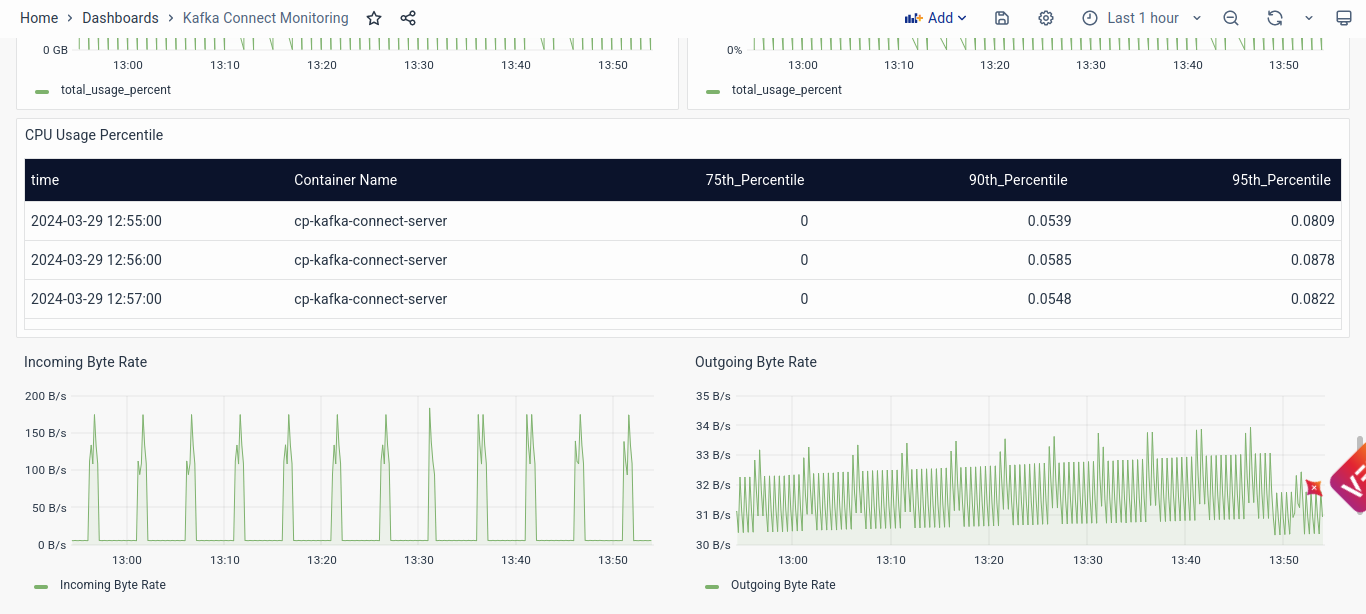
- CPU Usage Percentile: Presents CPU usage percentiles for each node within the Kafka Connect cluster, including the 75th, 90th, and 95th percentiles. Monitoring CPU usage percentiles helps assess node performance and identify any nodes experiencing high CPU utilization.
- Incoming and Outgoing Byte Rate: Shows the incoming and outgoing byte rates for data transfer to and from Kafka on each node within the Kafka Connect cluster. Monitoring byte rates helps assess data throughput and identify any issues affecting data transfer efficiency.
JVM Metrics
- Heap and Non-heap Memory Usage: Displays the heap and non-heap memory usage of Java Virtual Machine (JVM) instances running Kafka Connect. Monitoring memory usage helps assess JVM resource utilization and identify any memory-related issues, such as memory leaks or inefficient resource management.
- Garbage Collection Times (Young and Old): Presents garbage collection times for both young and old generation memory within JVM instances running Kafka Connect. Monitoring garbage collection times helps assess JVM performance and identify any issues related to garbage collection efficiency.
Conclusion
In conclusion, the Kafka Connect Monitoring dashboard serves as a comprehensive tool for solutioning engineers to maintain the integrity and efficiency of the Kafka Connect cluster within vuSmartMaps. By providing detailed insights into connector and node metrics, along with critical JVM health indicators, this dashboard empowers engineers to proactively monitor, troubleshoot, and optimize the Kafka Connect environment. With a focus on data throughput, resource utilization, and JVM performance, this dashboard enables seamless data integration and processing, ensuring the reliability and scalability of vuSmartMaps' data infrastructure.
